
Abstract
The authors report the results of vortex-induced vibrations of a square cylinder in a wind tunnel. This constitutes a high mass ratio environment. The square cylinder is mounted in the wind tunnel in such a fashion that it only performs rigid body oscillations perpendicular to the flow direction with damped free-end conditions. This physical situation allows a direct evaluation for analytical models relying on simplified 2D assumptions. The results are also compared with two-dimensional fluid-structure (CFD-CSD) numerical simulations. The comparison shows that despite having one-dimensional motion, the analytical model does not predict the VIV region with correctness. Results show that the numerical simulations and experimental results differ from the analytical model for the prediction of reduced velocity corresponding to peak amplitude. Also the analytical reduced velocity envelope is underpredicted compared to both numerical simulations and experimental data despite the structure being lightly damped. The findings are significant as the experimental results for freely oscillating high mass ratio body show differences from the low mass ratio especially in the transition between VIV and galloping regions. However the numerical simulations show comparatively close agreement.
1. Introduction
Vortex shedding excitation of a cylinder is probably one of the most studied problems in flow-induced vibrations. This mechanism, referred to as vortex-induced vibration (VIV), occurs when the vortices, developed in the wake, can couple with the dynamics of the cylinder. It can be seen roughly as a resonance mechanism appearing when the frequency of the vortex shedding, controlled by the fluid flow, is close to the natural frequency of the cylinder. However, the physics of the interaction between the flow and the cylinder transverse motion is not simply linear. Mathematical modelling for predicting the amplitude of the cylinder motion has become a widely studied problem in engineering. Wilkinson [1], Otsuki et al. [2], andNakamura and Mizota[3] presented some experimental data on the forced oscillations of square section cylinders. Sarpkaya [4] presented a selective review of the then existing know-how about vortex-induced oscillations. Bearman and Obasaju [5] studied the pressure fluctuations on both fixed and forced oscillating square cylinders. They determined that the amplification of the fluctuating lift coefficient for a square cylinder at lock-in was much less than that of a circular cylinder subjected to similar conditions. Ongoren and Rockwell [6] have studied the effects of cylinder inclination with respect to the mean free stream, using a forced circular cylinder in a water channel. Ongoren and Rockwell [7] repeated some experiments with square and triangular cross-section cylinders. Their experimental setup involved vertically arranged cylinders subjected to low mass ratio environment. Williamson and Roshko [8] provided the mechanism of vortex formation and the underlying physics for mode shifts. Parkinson [9] resumed the phenomenology and the theoretical modelling tools available to understand the vortex-induced oscillations and the galloping instability in case of flow past bluff bodies. Brika and Laneville[10] studied a hollow slender cylinder in a wind tunnel and showed that the cylinder's steady response was hysteretic. Each branch in the hysteresis loop is associated to either the 2S or the 2P mode of vortex shedding. Abrupt change in the amplitude curve is attributed to the sudden mode shift. Govardhanand Williamson [11] presented the transverse vortex-induced oscillations of an elastically mounted rigid cylinder in a fluid flow. The authors point out that in a classical high mass ratio system the initial and lower amplitude branches can be distinctly identified due to a discontinuous mode transition. In case of lower mass ratio systems a further upper amplitude branch is clearly identifiable attributed to a second instance of mode transition. Hémonand Santi[12] submitted experimental and numerical results on the aero-elastic behavior of slender rectangular and square cylinders subjected to a cross flow. Morseand Williamson [13] discovered the 2Poverlap mode using high-resolution data from a forced oscillating cylinder at a fixed Reynolds number. Manzoor et al. [14] presented their experimental results based on the free oscillations of a square cylinder in a high mass ratio environment. Vortex shedding mode switch at the resonant velocity was identified. Hysteresis in the reduced amplitude curve was observed for one of the experimental cases. The same author has presented a possible theoretical explanation of the experimental results inManzoor et al.[14]. The reduced-order van der Pol model proposed by Facchinetti et al. [15] was used. Distinct limitations of the van der Pol model in predicting the VIV behavior have been identified. Sen and Mittal [16] recently submitted their numerical investigation of the two dimensional behavior of a square cylinder oscillating freely in a low mass ratio environment. The authors have neglected the effect of structural damping in their study while varying the Reynolds number in the lower range.
As catalogued above, almost all of the work being reported is largely focused on forced oscillations of circular cylinders in setups with lower mass ratios generally. Experimental data on noncircular bluff bodies is obtained either with lower mass ratio configurations or with forced oscillations mechanisms. Mostly, the experimental setups demonstrate bending modes of vibration rather than rigid body motion. In this study we use an experimental setup which allows only the rigid body modes of oscillations with damped-free ends, thereby providing ground for direct testing of analytical and numerical models relying on planar kinematics. This work contributes also in the sense that we use experimental results for a more realistic configuration in comparison with the numerical simulations and analytical predictions for a practical real-life problem, civil engineering projects for example. For comparison with experimental data, analytical as well as numerical models are used to simulate the free vibration of lightly damped square section with free ends. To best of our knowledge this work is the first attempt to simulate and understand the physics of square section oscillation with free-end conditions.
The organization of this paper is as follows. First we introduce the experimental setup and the details of measurement system with details of system parameters. This is followed with experimental results along with comparison of analytical model predictions for the setup. In the next section the details of the numerical simulation model and the parameters for the coupled fluid structure interaction simulations are detailed. A detailed discussion on the comparison of numerical simulations and experimental results is also included. At the end we conclude the findings of this research paper.
2. Experimental Methods
2.1. Wind Tunnel and Flexibly Mounted Cylinder
The square cylinder has a cross-section, D = 0.02 m, and a span, b = 0.15 m. The cylinder is put in place in the test section using four linear springs mounted outside the test section. Specific chord wiring is used to restrain the cylinder such that it oscillates only transverse to the air flow executing rigid body motion. The use of linear spring mountings allows a damped free-end condition for the cylinder rather than conventional fixed and/or cantilever-type boundary conditions. Special attention is paid to keep the structural damping as low as possible. The experiment is conducted in a vertical axis Eiffel Wind Tunnel which has a closed circular test section ofa diameterof 0.20 m. A centrifugal fan, downstream of the test section, is used to produce the wind stream. This free stream flow velocity can be safely assumed to be uniform over the cylinder span given the comparison between the cylinder span and the test section diameter. Mean velocity in the test section is varied from 2 m/sec to ∼7 m/sec. Turbulence level of the upstream airflow is measured and found less than 1% over the velocity range during the course of this study, Amandolèse and Hémon [19].
For this experimental setup no endplates are attached to the test structure. Due to the high aspect ratio of the cylinder used in this experiment (b/D = 7.5), flow around the longitudinal ends can have a significant effect on the vortex dynamics, the correlation of the induced fluid forces on the body, and thus the vibrations. However the proximity of both the ends of the cylinder with the test section wall reduces the effect of the end conditions. As reported by Morse et al. [20], for a circular cylinder the vortex-induced vibrations for attached and unattached endplates are nearly the same.
2.2. Measurement System
At low flow velocity accurate measurement is always challenging. In the present case, a nozzle is mounted downstream of the test section. Using Bernoulli's theorem we calculate the airflow velocity in the test section and compare it with the flow velocity in the nozzle section. Pressure readings in the test section and the nozzle section are obtained by using pairs of static pressure taps in each section. A thermocouple is also employed for temperature correction. This technique allows us to measure low flow velocities with accuracy better than 1%, Manzoor et al. [14].
Measurements of the transversely displacement of the cylinder are obtained by a laser displacement sensor. The measurement resolution is 40 μm and the accuracy is 1% of the full scale range. Signals from the laser displacement sensors are transmitted to an acquisition system named PAK provided by Mueller-BBM. It consists of an 8-channel acquisition card of 24 bit with a signal processing software. Sampling resolution is 1024 Hz and the typical duration of data accumulation is 60 s. However this duration can be increased to 300 s to enable the frequency measurements of the limit cycle oscillation (LCO) of the cylinder. Increasing the time duration also enabled us to obtain a better frequency resolution of the measurements. The physical degree of freedom “z” is obtained through the recombination of the measured signals using the system kinematics, Manzoor et al. [14].
2.3. Structural Parameters of the Experiments
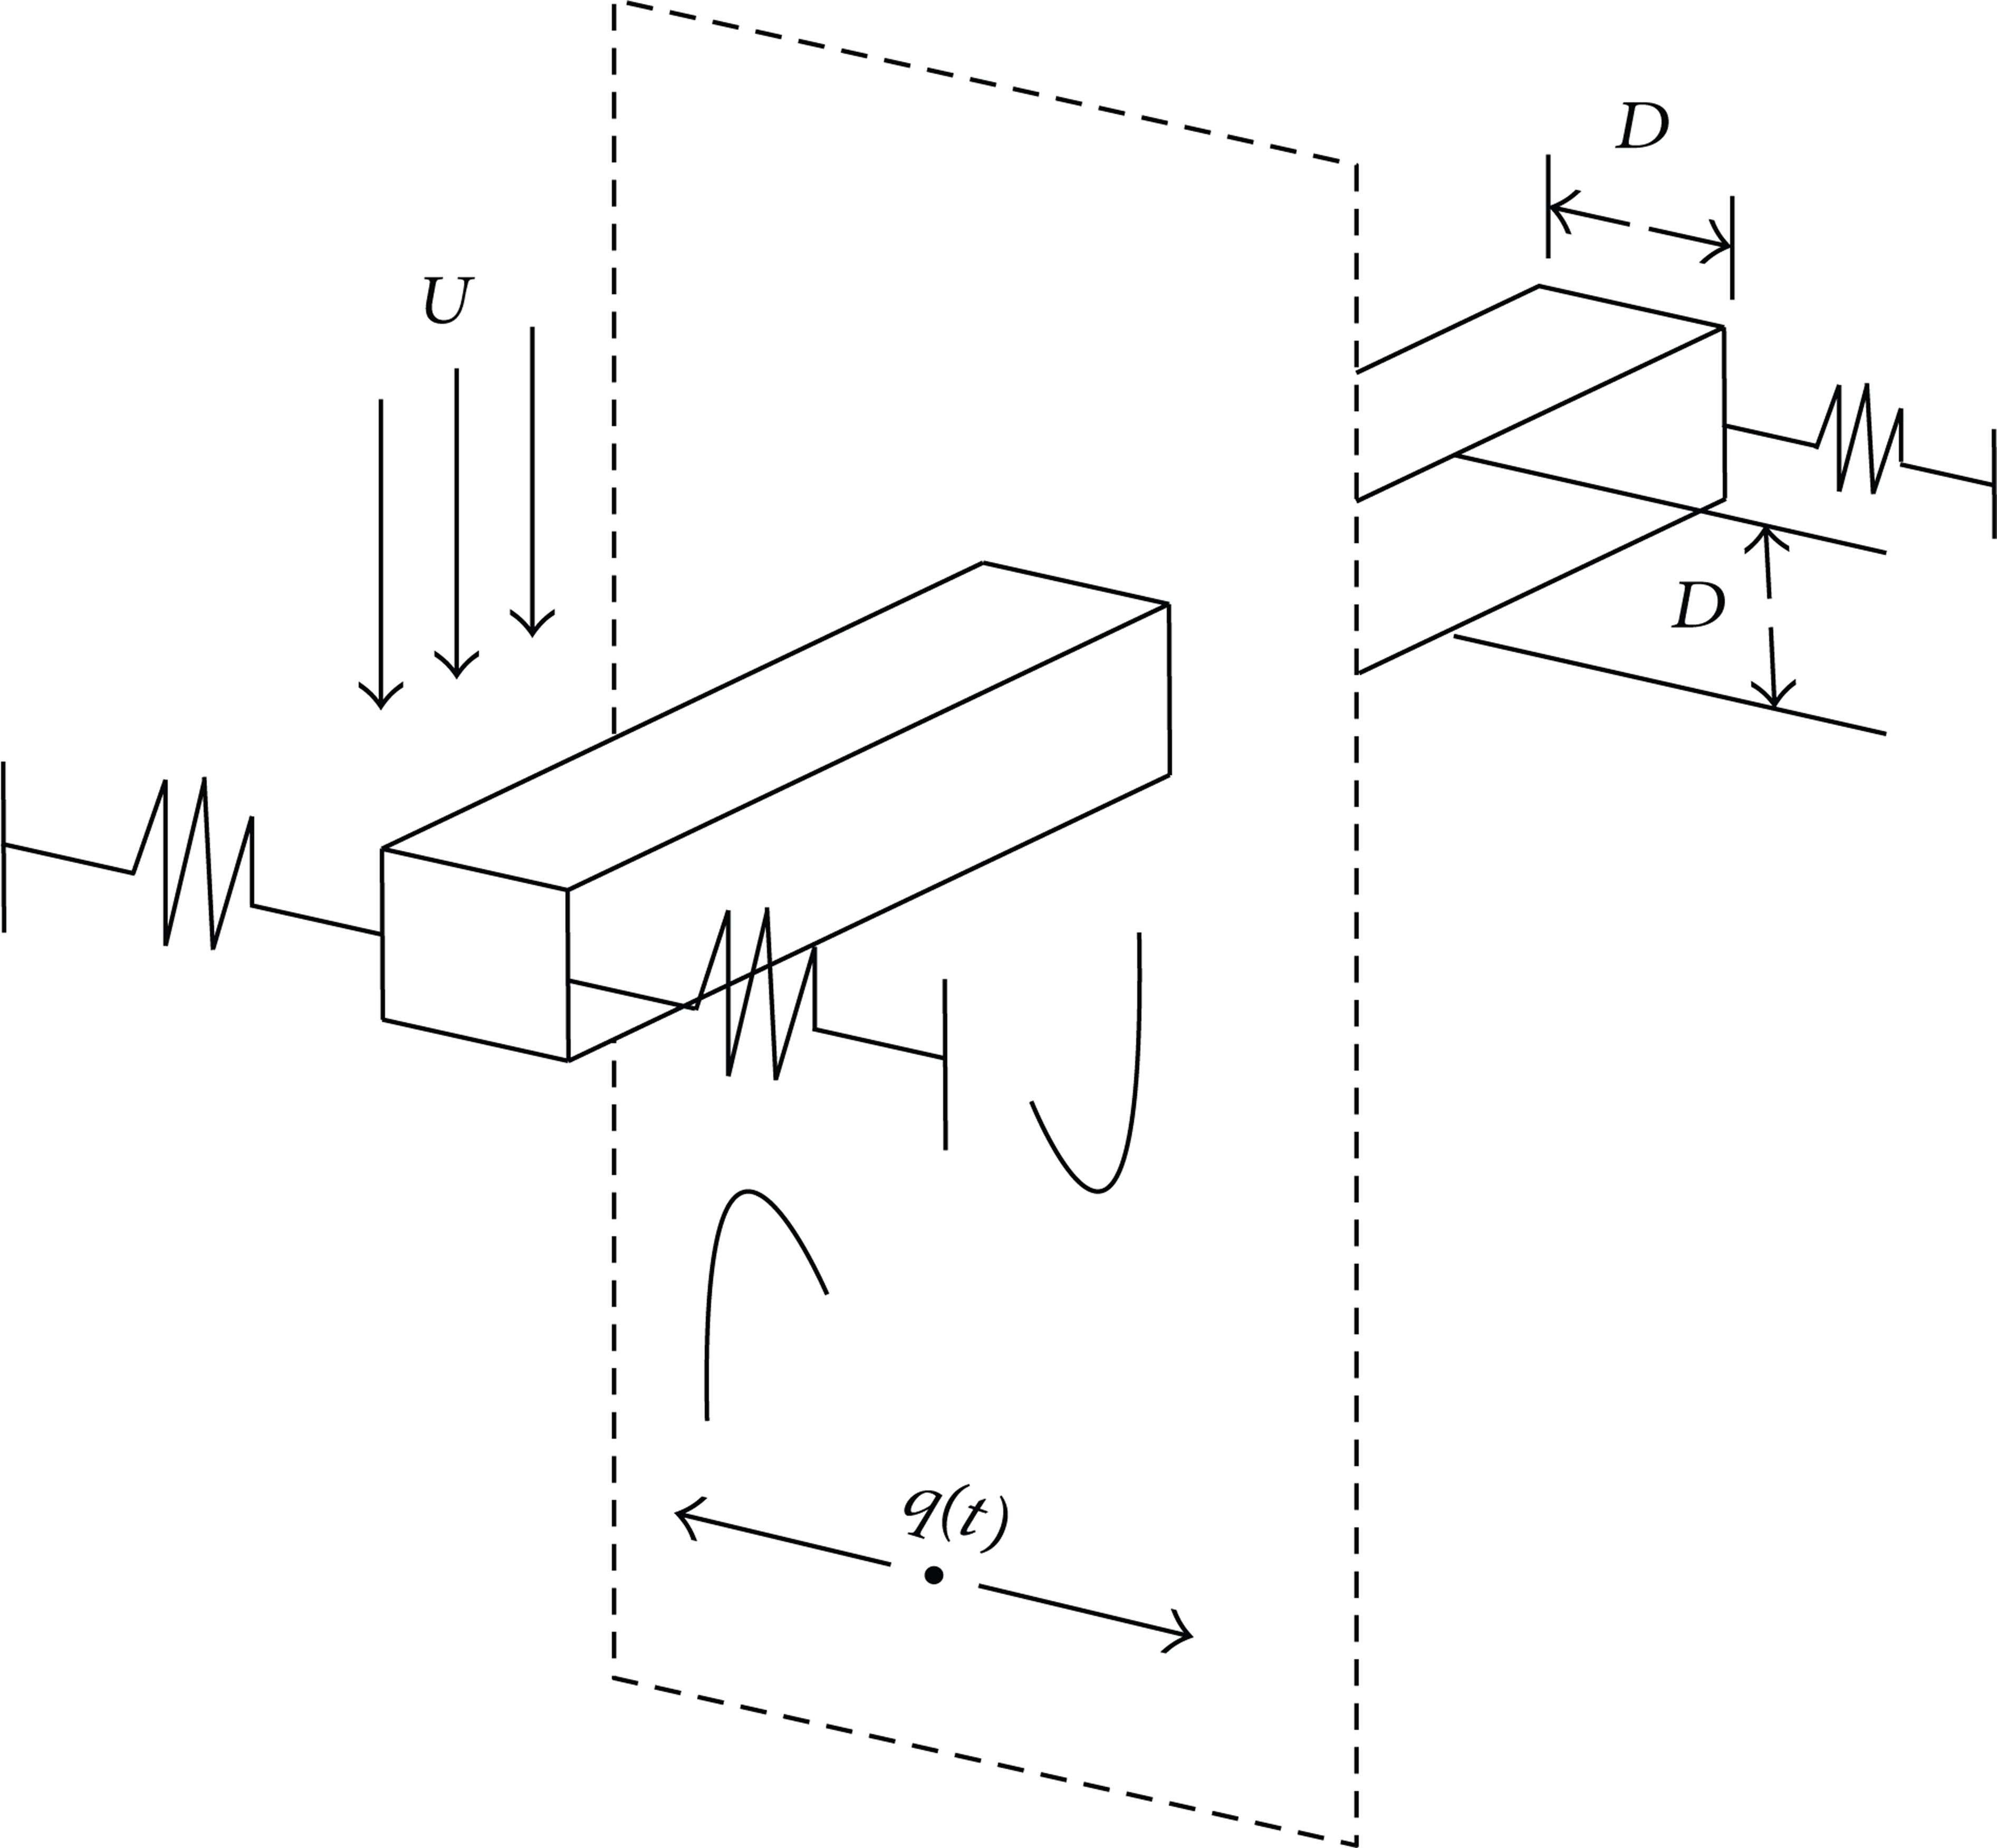
The structure is a rigid square cylinder with the length of the side “D”. The external attachments of the cylinder makes it constrained to oscillate in a direction normal to the mean flow direction as depicted in Figure 2.

Sketch showing the principles of the experimental setup [14].
Schematic for square cylinder coupled wake oscillator for 2D vortex-induced vibrations in a vertical wind tunnel [17].
Flow is assumed to be uniform all along the cylinder length. The cross flow displacement “z” of the cylinder can be described by the standard damped linear oscillator:

The undamped natural frequency of the system is defined as

Here structural parameters are obtained under zero cross wind velocity. The natural frequency f z and the system damping r s are obtained using spectral analysis; Manzoor et al. [14]. A static weight calibration technique is used to calculate the stiffness k. Mass m is then calculated using:

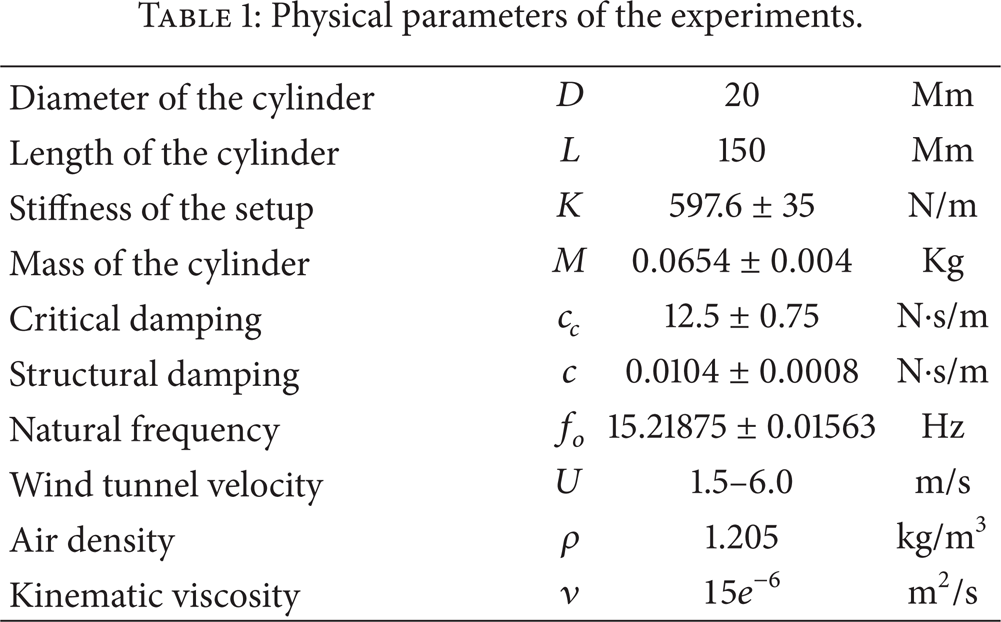
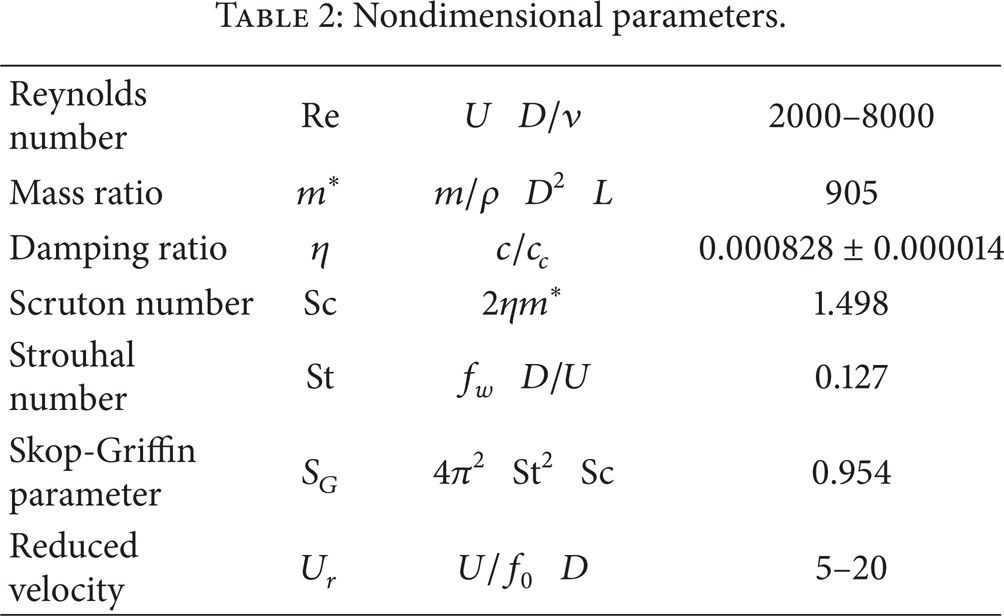
The reduced velocity, U r , is given as U r = U/f o D and the RMS amplitude, Z*, is given as Z* = z/D. Structural supports are assumed to behave linearly throughout the amplitude envelope. Important physical parameters of the experiment are resumed in Table 1. Pertinent nondimensional parameters are also reported in Table 2. From the two tables, it is clear that the system has a high mass ratio m* ≈ 905 associated with a very low damping ratio η ≈ 0.0828%. Very low damping leads to a relatively small Scruton number, Sc ≈ 1.5 which is the key parameter in the observation of vortex shedding vibrations.
Physical parameters of the experiments.
Nondimensional parameters.
Unsteady wake measurements have also been performed in order to measure the Strouhal number of the cylinder at rest. Measurements were obtained using a single-component hot wire anemometer installed downstream of the square cylinder at a distance equal to one length of the cylinder side. For the system under consideration, the Strouhal number was found to be 0.127 over the velocity range of the vortex shedding oscillation regime. This is in accordance with Norberg's data for low Reynolds number, Norberg [21].
2.4. Experimental Results
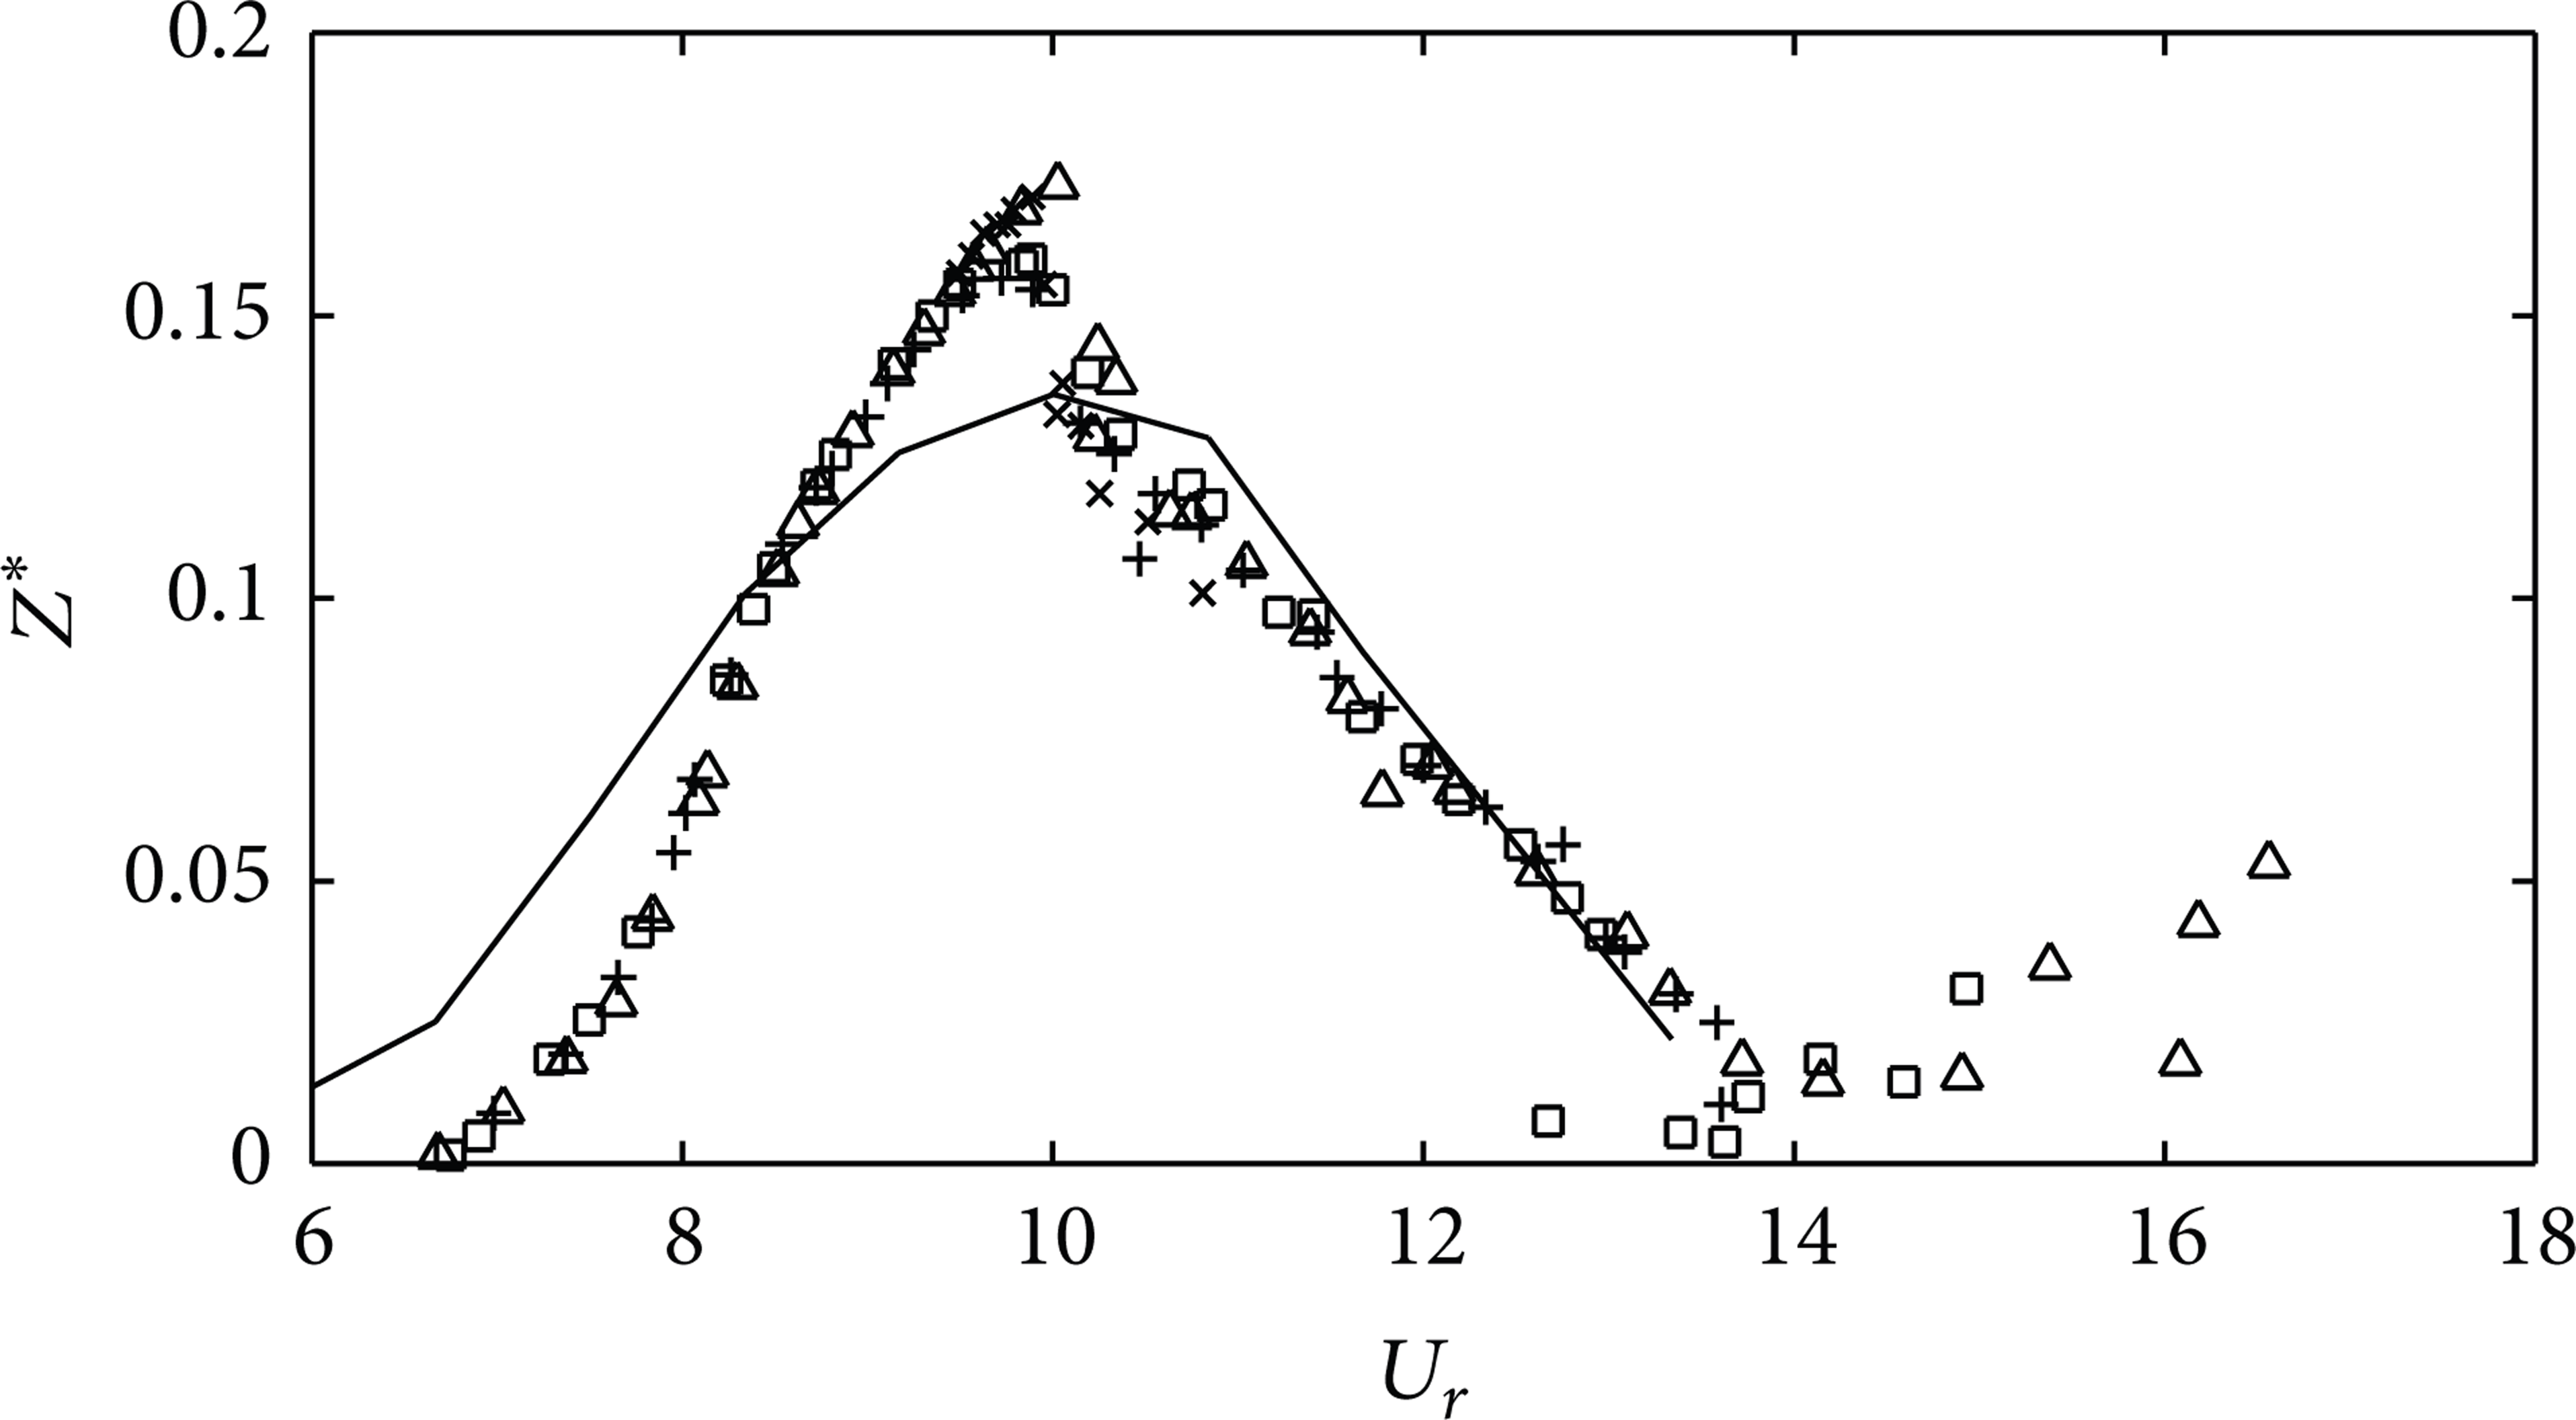
Experimental results presented in Figure 3 show limit cycle oscillations (LCO) of a square cylinder measured for reduced velocity ranging from U r ≈ 6 ≈ 16. Different symbols in the figure signify different experimental runs conducted at different times to ensure repeatability of the experimental procedure. Apart from the obvious dispersion of experimental points at higher reduced velocities we can safely assume that the resonant frequencies lie approximately in the same reduced velocity range for each experimental run. The result can be explained by thetype-II frequency coalescence mechanism, Shehryar [17]. As obvious from the figure, no significant oscillations take place at lower reduced mean free stream velocities, U r < 6, when the two natural frequencies of the system are far apart. The fluid structure interaction mechanism is dominated by the inertial effects due to the incoming flow. As the U r increases, the vortex shedding frequency downstream of the cylinder gets increasingly synchronized with the cylinder oscillating frequency (6 ≤ U r ≤ 13). This results in an increasing energy transfer from the wake to the oscillating cylinder. Facchinetti et al. [15] have stated that for a positive energy transfer of this sort, 0 < (−φ/π) < 1, where ϕ is the phase angle between the vortex shedding frequency and the cylinder oscillating frequency. Increased energy transfer shows as higher cylinder oscillating amplitude. The cylinder exhibits maximum oscillation amplitude for a critical flow velocity where the two frequencies of the system match exactly. Generally, this point of maximum amplitude for a circular cylinder with higher mass ratio is achieved for a reduced upstream velocity close to (1/St), U r ≈ 8. For the square cylinder, however, it occurs at U r ≈ 10 which is slightly more than (1/St) in our case. As the mean free stream velocity is increased further, (U r > 10), a sudden phase shift results in an abrupt change in the wake mode pattern, Khalak and Williamson [22] and Brika and Laneville [10]. This point can be identified on the amplitude curves where there is a sudden change in amplitude. Shehryar [17] observed that for such type-II fluid structure interaction systems, the phase between the structure and wake oscillators showed an overall jump of π passing through the lock-in range.

Reduced RMS amplitude of the limit cycle oscillations versus reduced velocity [17].
As the mean free stream velocity increases, a negative energy transfer takes place accredited to the sudden phase shift. Consequently, the cylinder oscillations amplitude decreases, Figure 3, until a second critical value of the reduced mean free stream velocity is reached (U r ≈ 14). Experimental data presented in Figure 3 depicts amplitude values for a velocity just below this second critical value. Beyond this second critical value of U r , the two system frequencies bifurcate, Shehryar [17]. If the mean free stream velocity is increased further, (U r > 14), the secondary galloping instability sets in; interestingly it starts immediately after the VIV region.
3. Comparison with the Analytical Model
For a one-dimensional case the equation of motion of a rigid cylinder oscillating in the transverse z-direction (normal to the flow) reads as (4), where “m” is the mass of the cylinder, “r” is a viscous damping coefficient, “k” is the stiffness of the setup, and “S” is the aerodynamic force resulting from the fluid structure interaction in this case, mainly due to vortex shedding.
The mass “m” takes into account the cylinder mass and the fluid added mass m f which models the inviscid inertial effects. Following Blevins [18] we candefine

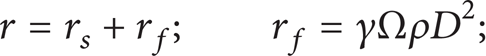
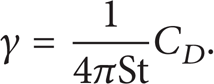
where “γ” is a stall parameter as Skop and Balasubramanian [23] and “Ω” is a reference angular frequency. Assuming that the mean free stream velocity “U” is zero, “Ω” is the angular frequency of the structure oscillation and “γ” is a function of the amplitude of oscillations related to the mean structural drag coefficient C D , Blevins [18]. Blevins [18] defines“γ” for a circular cylinder as:
In our case, however, “Ω” is the vortex shedding angular frequency, Ω = Ω
f
= 2πSt (U/D). “St” is the Strouhal number. Following Skop and Balasubramanian [23], “γ” will be assumed to remain constant for the sake of simplicity. Govardhan and Williamson [11] used two distinct formulations of the equation of motion for the “total force” and the “vortex force”. Following the same approach the fluid effects, namely, the added mass and added damping, have been included directly in the structural oscillator in (4) through (1) and (2). The vorticity effects are modelled by the forcing term at the right hand side in (4). Structural angular frequency Ω
s
is typically defined as

Facchinetti et al. [15] and de Langre [24] have used the standard van der Pol equation to model the fluctuating nature of the vortex street downstream of the oscillating square cylinder:
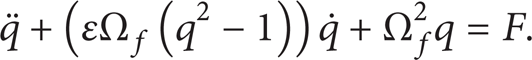
The fluid variable “q” is defined as the reduced vortex lift coefficient. Mathematically, q = 2 (C
L
/C
L
o
). C
L
o
is the reference lift coefficient measured on a fixed cylinder subjected to vortex shedding. “F” shall be “Az” for displacement coupling, “

3.1. Den Hartog's Instability Criteria
It should be kept in mind here that the model proposed by Facchinetti et al. [15] as discussed above is valid for circular cylinders. The present study however is based on the vortex-induced vibrations of a square section cylinder. It is imperative to remark here that this basic difference in geometry has to be taken into account to be able to compare theoretical findings and experimental results later. Blevins [18] suggested a simplified system to be considered, Figure 4.

Single degree of freedom galloping model. reproduced as blevins [18].
The angle of attack “α” can be calculated as
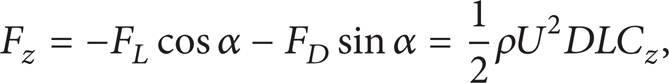
where C z is the vertical force coefficient:

Now because “α” is very small, advancing the last equation
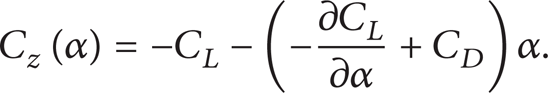
In the last equation if ∂ C z /∂ α < 0 or equivalently (∂ C L /∂ α) + C D > 0, total damping of the system remains positive. The system remains stable. This is known as the Den Hartog's Stability Criteria. Equation (12) at α ≈ 0 gives C z = C L . Trivial algebraic manipulation of (10) and (12) yields
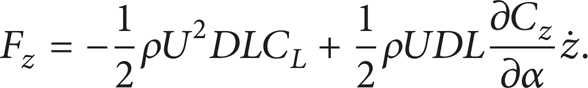
Comparing (1) and (13), retaining only lower-order terms of α, we arrive at

where (∂ C z /∂ α) is 3 for a square cylinder in smooth flow and 3.5 for a square cylinder in turbulent flow, Blevins [18].
Investigations by Facchinetti et al. [15] revealed that using acceleration coupling in the forcing term of the wake oscillator best matches with the then available experimental results. The coupling terms were formulated to essentially allow only the linear functions of the wake variable “q” and displacement “z” and their temporal derivatives. In order to set the values of parameters “A” and “∊”, the total lift coefficient was assumed to be the same as the vortex lift coefficient. Although Facchinetti et al. [15] recommend acceleration coupling as the most suitable, it is important to keep in mind that the theoretical model was devised for systems with lower mass ratios. Since this experimental work involves a higher mass ratio system we refer to the lock-in domain calculations as a function of mass ratio by the same authors. Given the seemingly asymptotic relationship between the upper and lower bounds of the lock-in region in the velocity coupling model at lower mass ratios, we can conclude that it is the velocity coupling model which is best suitable for our high mass ratio experimental setup. This study therefore focuses on the velocity coupling model.
Following the same approach as Facchinetti et al. [15] and the references there in, we solved the model numerically as presented in (7) and (8) using the Fox and Goodwin iteration scheme. Details of the iteration scheme are described in Shehryar [17]. System parameters are described in Tables 1 and 2, Figure 5.

Hysteresis standard wake oscillator model solved numerically using velocity coupling as in Facchinetti et al. [15]. Solid line: Increasing Velocity, dashed line: decreasing velocity. Z* is the amplitude normalized with respect to the dimension “D” of the square cylinder, Figure 1, and q is the reduced vortex lift coefficient.
We shall now compare our experimental results as presented with the theoretical wake oscillator model. As can be observed from Figure 6, the wake oscillator model predicts the location of maximum limit cycle amplitude closer to the expected value of (1/St) for this case. However, the extent of frequency lock-in domain does not match the experimental result. We can safely state that only the lock-in amplitude model in (9) provides acceptable results given that the added aerodynamic damping effect due to bluff body cross section (14) has been taken into account. de Langre [24] states that the extent of the lock-in domain is in fact controlled by the product AM where “A” is the coupling force scaling in the wake oscillator model. Following Facchinetti et al. [15], we determine A = 2.7 for our case. “M” is a mass parameter such that


Reduced RMS amplitude of the limit cycle ocillations starting from rest configuration. solid line: velocity coupling simulations of the wake ocillator model as presented in Facchinetti et al. [15].
4. Comparison with Numerical Simulations
For the current case we also carried out coupled fluid-structure interaction of the square cylinder to resolve the physics of the flow and its effect on the rigid body oscillations. The flow physics shall enable us to visualize the dynamics of wake structure and its influence on the structure through coupled simulation. For simplicity, the coupled model is reduced to 2D interaction only because of the nature of the vibration (one dimensional oscillation) and low turbulence. This section details the coupled computational fluid dynamics (CFD) – computational structural dynamics (CSD) model and the simulation results.
4.1. Coupled CFD-CSD Model
The coupled CFD-CSD simulations are carried out using Fluent through its user defined function (UDF) feature. An in-house developed UDF developed using C-Language was linked with Fluent through Dynamic Link Library (DLL). The coupled CFD-CSD system is modelled using loosely coupled partition procedure Matthies and Steindorf [25]. The time step size chosen for unsteady CFD-CSD simulation is 2e – 4 sec based on the vortex shedding frequency of the structure measured experimentally.
4.2. Computational Fluid Dynamics Model
For computational fluid dynamics simulations the chosen domain is two dimensional containing 60000 cells and 60600 nodes as shown in Figure 7. For the square cylinder a solid boundary nonslip wall condition was prescribed while pressure-far-field boundary condition was used on the outer domain boundaries. The distance between the solid wall boundary and the outer boundary of the domain was set at more than 10 times the size of the square cylinder as shown in the Figure 7. The grid size is selected after carrying out a grid independence study.
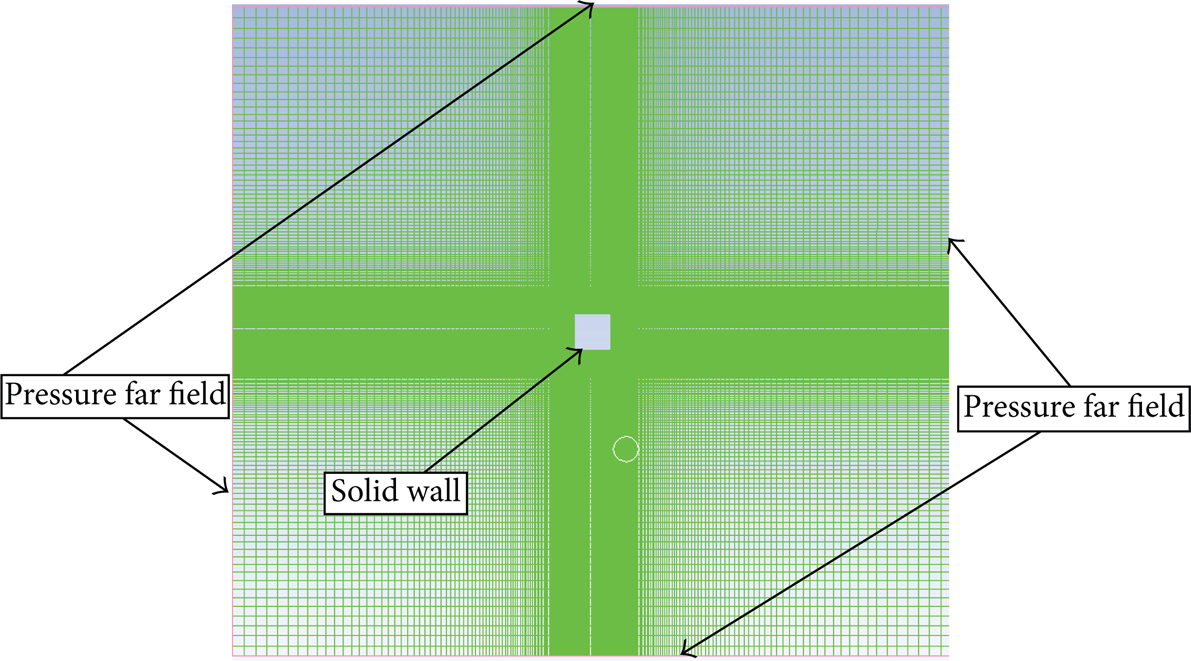
Illustrating the mesh around the square cylinder.
The two-dimensional flow was modelled using viscous two-dimensional Navier strokes equations along with shear stress transport (SST) kw turbulence model, Menter [26]. This particular turbulence model was used because of its good performance for the flows with adverse-pressure gradients, Dina et al. [27]. The initial turbulence intensity wasset to be equal to one percent because the Reynolds number based on the size of the square cylinder is inlow Reynolds number regime (2000∼6000). The numerical simulations are performed for various flow velocities ranging from 1.5 m/sec to 6 m/sec. Value for the air density was kept constant at 1.205 kg/m3 with static air pressure of 101325 Pa to match the experimental test conditions.
4.3. Computational Structural Dynamics Model
The computational structural dynamics (CSD) model used for the square cylinder has a single degree of freedom in plunge direction “z”. The mass “m” of cylinder is 0.0654 kg with the stiffness “k” of the cylinder is modeled using a lineal spring attached to the center of the cylinder with stiffness of 597.6 N·m. The value of structural damping “ξ” coefficient was taken to be around 0.0104 to match the parameters of experiments.
For the single degree of freedom a mass spring-damper system is modeled (see (1)) and solved numerically using fourth-step Rung Kutta (RK4) method with the lift force “S” as the input to the system. The lift force, generated due to airflow, was calculated by numerically integrating pressure, calculated through CFD, around the cylinder.
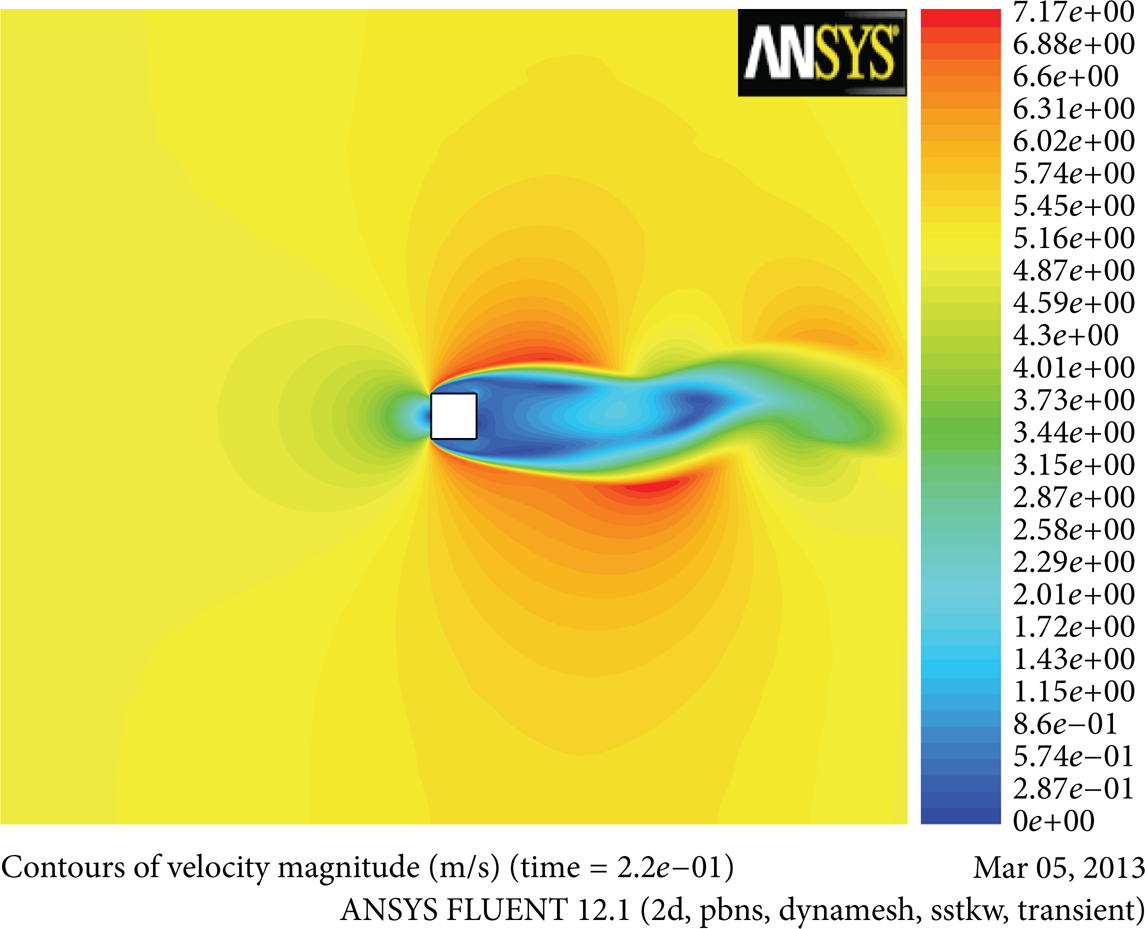
The time-resolved coupled CFD-CSD simulation show that initially a separation bubble is formed downstreamthecylinder as shown in the velocity magnitude plot of Figure 8. This velocity magnitude contour plot is shown for free-stream flow of 5.5 m/sec at time 0.14 sec. As shown, initially the contour plot is symmetric about the cylinder, but after a certain time the separation bubble starts to become asymmetric as shown in Figure 9. The asymmetry is induced by the fluid itself without the requirement ofan external plug or trigger. The asymmetry leads to the formation of an alternating vortex which is continuously shed in the wake of square cylinder as shown in Figures 10 and 11. The resultant is the formation of a continuous vortex street behind the square section as seen in Figure 12. This asymmetric vortex shedding introduces asymmetric pressure distribution around the cylinder which introduces fluctuating lift force. This lift forces causes the square cylinder to vibrate. As the incoming velocity is varied the amplitude of the lift force increases; this results in the higher amplitudes of vibrations. However this does not continue for all incoming velocities. At a certain critical velocity, the amplitude maximizes to its highest value and after than the peak amplitude decreases.
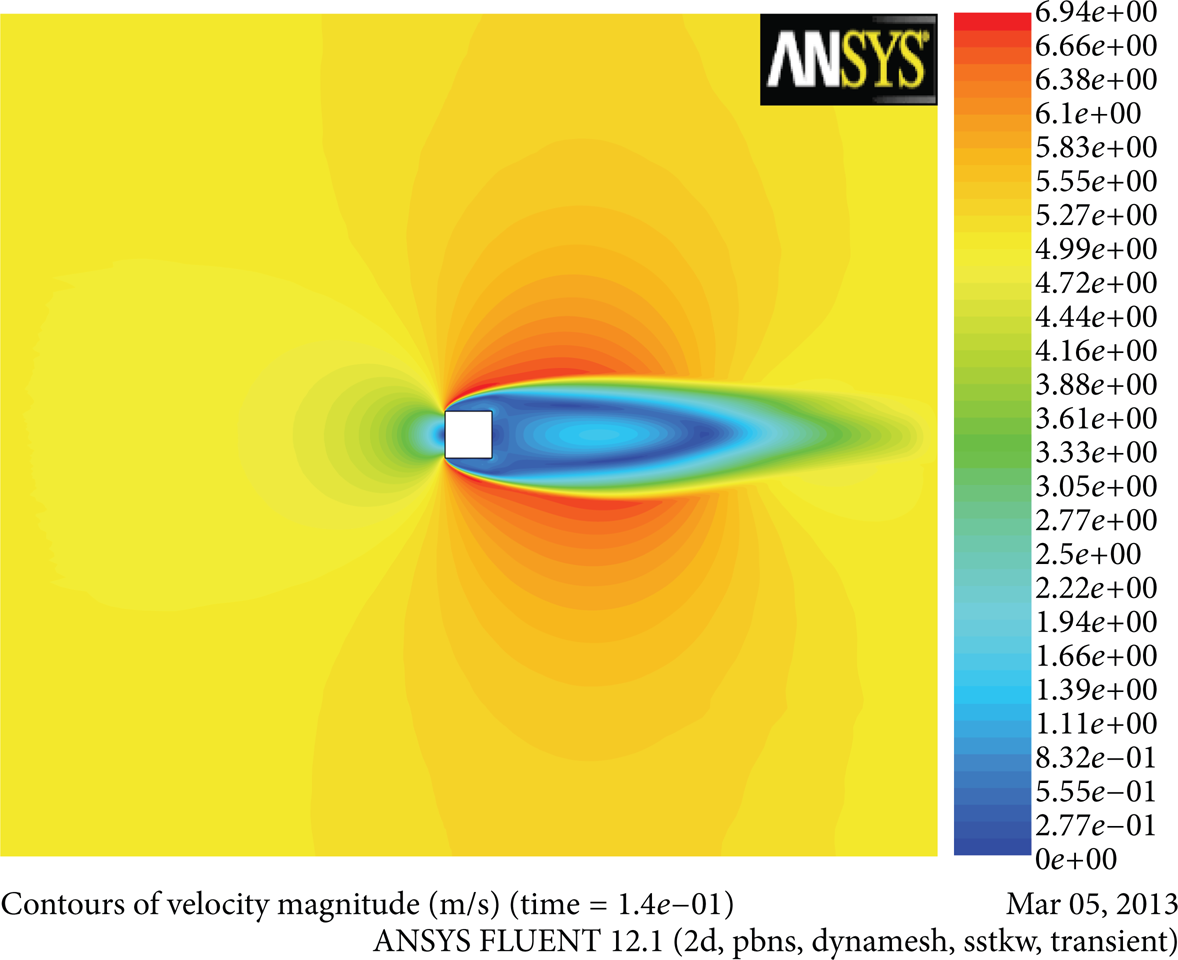
Velocity magnitude contour plot for free-stream velocity of 5.5 m/sec at time 0.14 sec.

Velocity magnitude contour plot for free-stream velocity of 5.5 m/sec at time 0.16 sec.
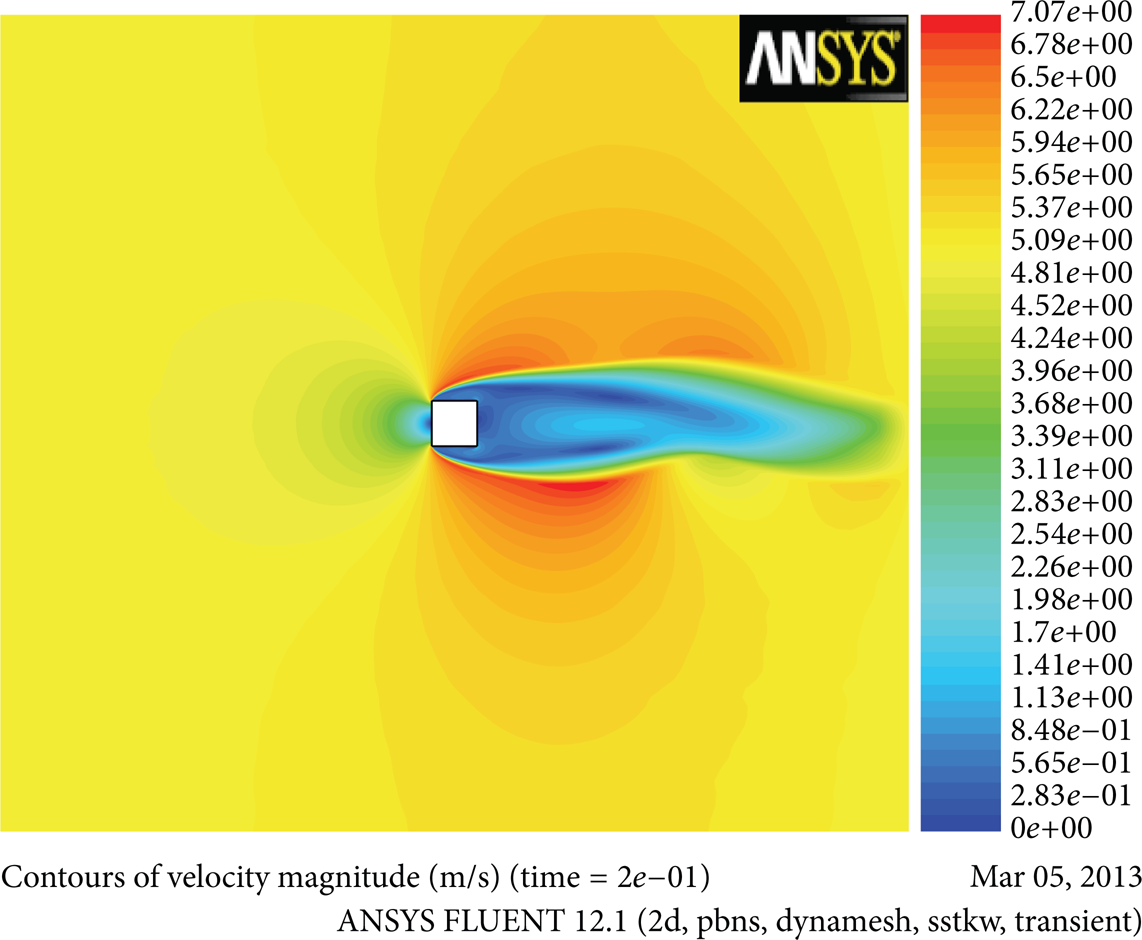
Velocity magnitude contour plot for free-stream velocity of 5.5 m/sec at time 0.2 sec.
Velocity magnitude contour plot for free-stream velocity of 5.5 m/sec at time 0.22 sec.

Velocity magnitude contour plot for free-stream velocity of 5.5 m/sec at time 0.32 sec.
A comparison of the peak amplitudes of oscillations predicted by the coupled CFD-CSD simulations and experimental data is shown in Figure 13. For illustration, comparison of results predicted by the analytical model is already shown in Figure 6. It is evident that the analytical model is by far the least demonstrative of the trend seen in the experiments. On the other hand the coupled CFD-CSD simulations show good comparison with the peak amplitude prediction as well as the width of the VIV region.
Comparison of coupled CFD-CSD simulations (solid line) with experimental data (symbols).
5. Discussion
Different authors have published their work in attempts to enhance the wake oscillator model since it was proposed by Currie and Hartlen [28]. Such models are based on the reduced vortex lift coefficient manipulated in the form of a standard van der Pol equation to model the effects of the vortex shedding on the solid object. The solid object in turn is modeled in the form of a standard damped spring mass system. Forcing terms in both the equations impose the necessary coupling. An important aspect associated with using this type of theoretical models is the fact that the ratio between the coupling force scaling “A” and the near wake van der Pol parameter “∊” has to be fixed independently for each case of a bluff body executing vortex-induced vibrations. This ratio governs the maximum limit cycle amplitude at lock-in. The extent of the lock-in domain is controlled by the product of the coupling force scaling “A” and the mass parameter “M”, de Langre [24]. While our experimental results validate the model's ability to predict the maximum lock-in amplitude, the comparison reflects an important drawback regarding the extent of the lock-in range. Especially the model fails to predict the complete VIV envelope in the post peak amplitude region as observed in Figure 3. It can also be noticed that the van der Pol model predicts a sudden decrease in the amplitude of vibration after the point of peak vibration amplitude. This suggests that the force scaling parameter “A” in this region may not remain constant for the entire envelope and requires further tuning. As described earlier, the change in the amplitude curve can be linked with the mode shift in the vortex shedding pattern, Govardhanand Williamson [11]. However the van der Pol model does not account for the change in the lift force scaling in the region.
Also, a closer inspection of our experimental results in Figure 3 shall reveal that the maximum lock-in amplitude lies at a slightly higher value of the reduced velocity than the expected (1/St). The wake oscillator model proposes that this maximum amplitude should lie indeed at reduced velocity closer to (1/St). This discrepancy in the location of the maximum lock-in amplitude and the extent of the lock-in domain may be connected. A detailed investigation of the blockage effects in this case may yield new experimental evidence. At the same time extending the model to consider higher-order terms in the forcing functions could improve the accuracy of theoretical curves. Another important tool which could be used is a visualization study. The ability to simply see the vortex shedding patterns in real time could shed some more light on any existing phenomena near resonance. One easier approach is to simulate the coupled fluid-structure interaction. Here, we solved 2DNavier-Stokes with the simplest of the structural model which only accounts for the structural damping. Despite the nonlinearity, the model has been able to predict the maximum lock-in amplitude as well as the VIV envelope reasonably. The structural model can be upgraded to include other forms of damping and forcing terms to improve the comparison. Significantly the only difference is the coupled numeric simulation of the flow field that links the wake dynamics with the oscillations. The wake physics is highly complex especially with the introduction of turbulence. The wake oscillator model (Section 4) cannot account for such nonlinearity.
As we know that the value of the van der pol parameter is tuned to obtain the range of reduced velocity, we suspect that the parameter is highly nonlinear and cannot be fixed for the complete reduced velocity envelope. Rather we think that the parameter should evolve into a form at different reduced velocities and massratios so that it accounts for the wake dynamics especially when transition from laminar to turbulent occurs. It is recommended that further theoretical investigation isconductedso as to find a better approximation of the van der Pol parameter especially for the free vortex-induced oscillations of noncircular cross sections. In this regard we suggest that reduced-order modelling technique can be used.
6. Conclusion
The research paper summarizes the vortex-induced vibrations of a square cylinder subject to cross flow. The cylinder is held with thedamped free-end conditions. The experimental findings show lock-in peak amplitude away from region of reduced velocity predicted by the analytical models. On the other hand numerical simulations show peak amplitude and VIV envelope corresponding well with the experimental data. However, the predictions of the analytical model show lesser spread of VIV region with the peak lock-in amplitude in accordance with the experimental findings. The comparison of analytical and numerical results suggests that the wake model used for analytical lift force predictions needs revision. Especially the van der Pol parameter needs correction to incorporate the effects of turbulence experienced in the wake. At the moment the van der pol parameter is tuned to adjust the spread of the region, but it needs better understanding using first principles. We expect that in the near future further numerical simulations and experimental results along with reduced-order modelling may help in improving the formulation of the van der Pol parameter.
Footnotes
Nomenclature
Acknowledgments
The experimental part of this work was done at the Laboratoire d'Hydrodynamique (LadHyX) under the supervision of Dr. Pascal Hèmon and in collaboration with Dr. Xavier Amandolèse. Portions of the work have already been published in ASME 3rd FEDSM and in Shehryar [![]() ]. This is an attempt to further the ongoing discussion in the light of computational fluid and structure dynamics. The authors acknowledge the contribution by the team at LadHyX in designing the experiment and comprehending the experimental data.
]. This is an attempt to further the ongoing discussion in the light of computational fluid and structure dynamics. The authors acknowledge the contribution by the team at LadHyX in designing the experiment and comprehending the experimental data.