
Abstract
For high power centrifugal pump which is usually used in high risk applications, circular casing structure has been adopted to increase the reliability of the pump. This special casing structure can make the flow more complex and cause huge hydraulic losses. In this paper, the periodically unsteady turbulent flow in the circular casing of a high power centrifugal diffuser pump has been investigated numerically by CFD calculation. The velocity distributions in different positions were analyzed, and the pressure fluctuation results in time and frequency domains were considered. Finally, the pressure fluctuation intensity coefficient (PFIC) and peak pressure coefficient (PPC) based on statistical thinking were defined on each grid node and the results were analyzed quantitatively to check the time accumulation effect of the unsteady flow phenomenon. The results show that strong flow unsteadiness can be found near diffuser outlet positions of the circular channel and in discharge tube. In addition, the PPC and PFIC results can supply a new angle of view to evaluate the pressure variation, and it is a good supplement to the traditional unsteady pressure analysis method in time and frequency domains.
1. Introduction
Centrifugal pump is one of the most important energy conversion devices widely used in almost all industrial and agricultural applications: nuclear industry, petroleum, agri-business, chemistry, as well as cryogenic propellant pumping, and so forth. The complex inner flow phenomenon of centrifugal pump, such as strong rotor-stator interaction, can generate hydraulic excitation forces and give rise to pressure pulsations. These dynamic pressure components then will lead to mechanical vibrations and alternate stresses in various pump components, called flow-induced vibration problem [1]. The vibrations transmitted to the foundations can spread as solid-borne noise throughout the building, and the vibrating pump structures can also radiate airborne and fluid-borne noise [2]. When the power of centrifugal pump becomes higher and higher, the severer stability problems of centrifugal pump caused by unsteady turbulent flow should be noticed, especially in the application field of high risk industry.
Obvious unsteady turbulent flow phenomenon is mainly caused by rotor-stator interaction of a rotating impeller and stationary diffuser under conventional operating conditions and can spread into the whole flow passage. This periodic rotor-stator interaction has two kinds of effects, discussed by Feng et al. [3]. The first is the down-stream effect of the impeller on the stator flow, which is characterized by unsteady effects due to the highly distorted relative impeller flow field and impeller wakes. The second is the upstream effect of the stator on the impeller flow, which causes unsteady pressure and velocity fluctuations to the relative flow. Some studies on this unsteady effect have been conducted both numerically and experimentally; for instance, Shi and Tsukamoto [4] calculated three-dimensional unsteady Reynolds-averaged Navier-Stokes (URANS) equations with standard turbulence models within an entire stage of a diffuser pump to investigate pressure fluctuations due to the interaction between impeller and diffuser vanes. He et al. [5] calculated the three-dimensional unsteady flow in a diffuser pump stage. All impeller blades and diffuser vanes were considered simultaneously at the design operation point by using a time marching based method. Zhang and Tsukamoto [6] calculated an unsteady flow of a vaned diffuser to investigate unsteady hydrodynamic forces and pressure fluctuations in the diffuser region. Benra and Dohmen [7] calculated the transient flow in an industrial radial pump stage with all the blades by CFX for design operating point. Experimental work was carried out by Feng et al. [8] to investigate the unsteady flow in a low specific speed radial diffuser pump using LDV and PIV techniques. The phase-averaged velocity field, turbulence field, and the blade orientation effects were quantitatively examined in detail. Akhras et al. [9] revealed by LDV that there was a presence of jet-wake flow structure in the impeller exit. Pintrand et al. [10] presented some results of two-dimensional LDV measurements within the outer part of the impeller and vaned diffuser. Sinha and Katz [11] used PIV measurements to identify the unsteady flow structure and turbulence in a transparent radial pump with a vaned diffuser. Stel et al. [12] investigated the rotor-stator interaction in the flow field of the first stage of a two-stage centrifugal pump with a vaned diffuser. Some other research works [13–20] can be also found for the study of pressure fluctuation caused by periodical unsteady flow in centrifugal pumps.
In reality, especially in some high risk applications in which the stability of centrifugal pump is the most important, the circular casing structure has been adopted to increase the reliability of the overall structure of the high power pump. Because of this special circular casing structure, the unsteady flow phenomenon in the whole flow channel may become more complex than other centrifugal pumps with volute and cause huge hydraulic losses. Therefore, a deep analysis of the turbulent flow phenomenon in the casing has important practical and academic significance for optimizing the structure to increase both the hydraulic and reliability performances. In this paper, a numerical analysis of the unsteady turbulent flow was carried out by solving 3D URANS equations in the circular casing of the pump. The velocity distributions in different positions were analyzed, and the pressure fluctuation results in time and frequency domains were considered. Finally, the pressure fluctuation results based on statistical method were analyzed quantitatively to check the time accumulation effect of the unsteady flow phenomenon.
2. Numerical Simulation Method
2.1. Pump Geometry and Parameters
The model pump investigated is a high power, single-stage, single-suction, horizontal centrifugal diffuser pump with a circular casing which is always used in the power station. Figure 1 shows the cross section of the model pump, the structure configuration of the hydraulic components, and the relative positions between rotating and stationary components. 3D modeling of the pump is also shown in Figure 1, and the main geometric parameters of impeller, vaned diffuser, and circular casing are listed in Table 1. The dominant design rotating speed (n), flow rate
Main geometric parameters of the pump.

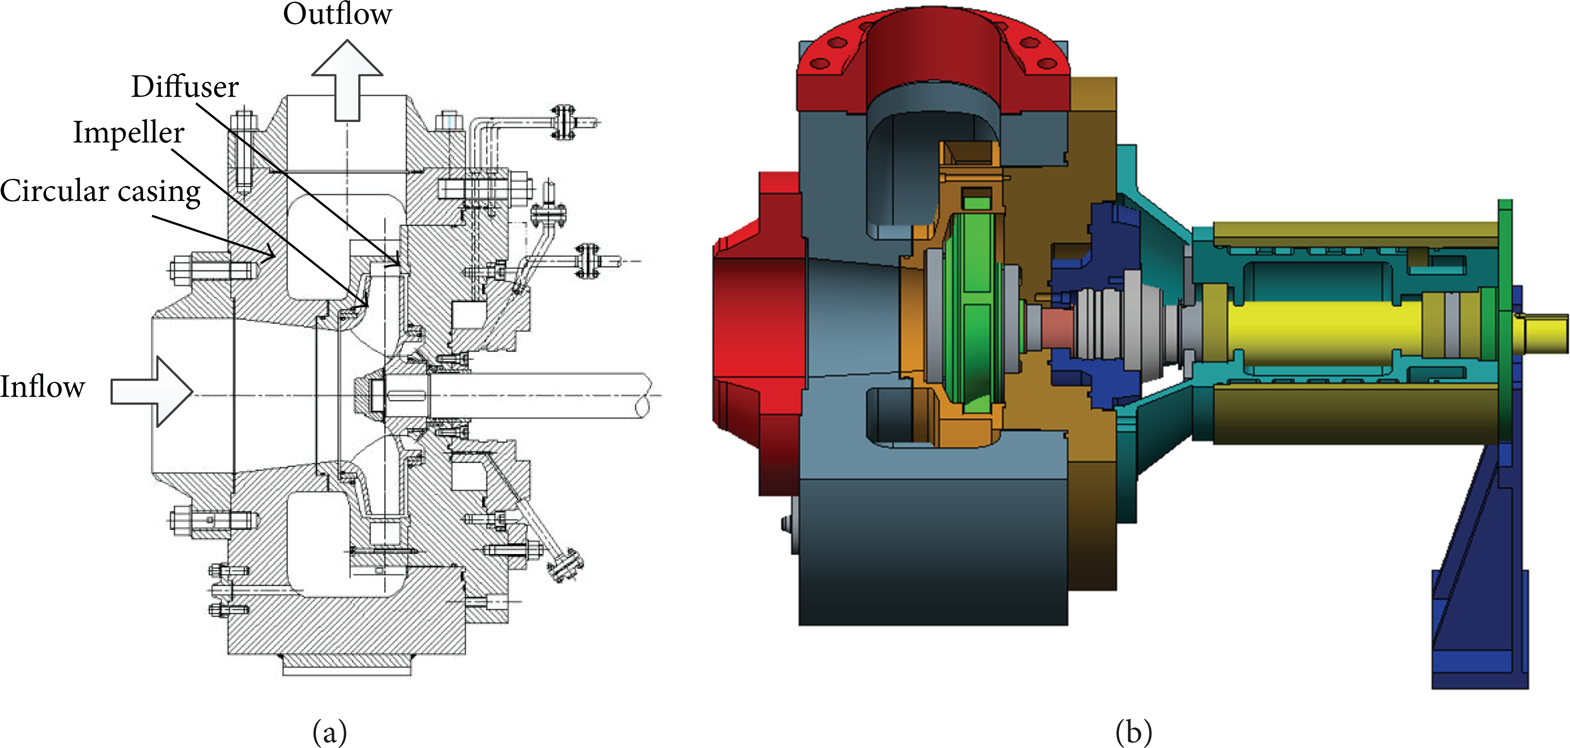
Cross section and 3D modeling of the pump.
2.2. Governing Equations and Turbulence Model
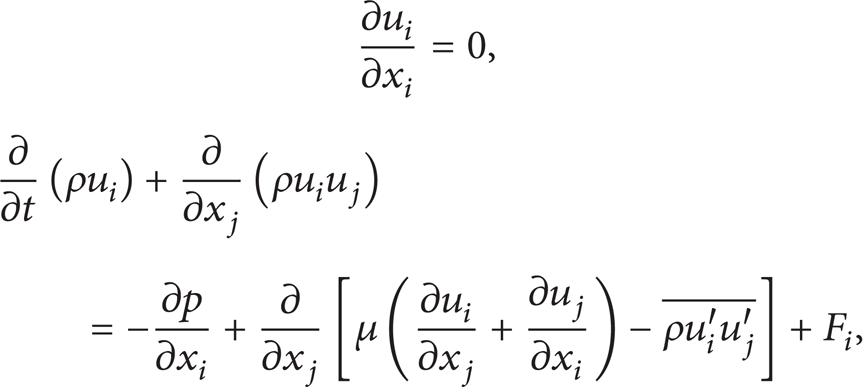
The internal flow of centrifugal pump is a three-dimensional, viscous, and unsteady turbulent flow; therefore 3D Reynolds-averaged Navier-Stokes equations are considered. The mass conservation equation and momentum conservation equation for incompressible fluid are shown in (1). Since all the variables here are mean flow quantities, it is customary to drop time symbols as follows:
where μ is dynamic viscosity, F
i
is source item, and
The shear stress transport (SST) turbulence model by Menter [21] is chosen to enclose the equations. The SST model is a modified k-ω turbulence model and is a hybrid model of k-ω and k-∊ turbulence models which can switch automatically in between near-wall area and main-flow area. Transport equations for k and ω are as follows:

The turbulence viscosity is calculated by the following equations:
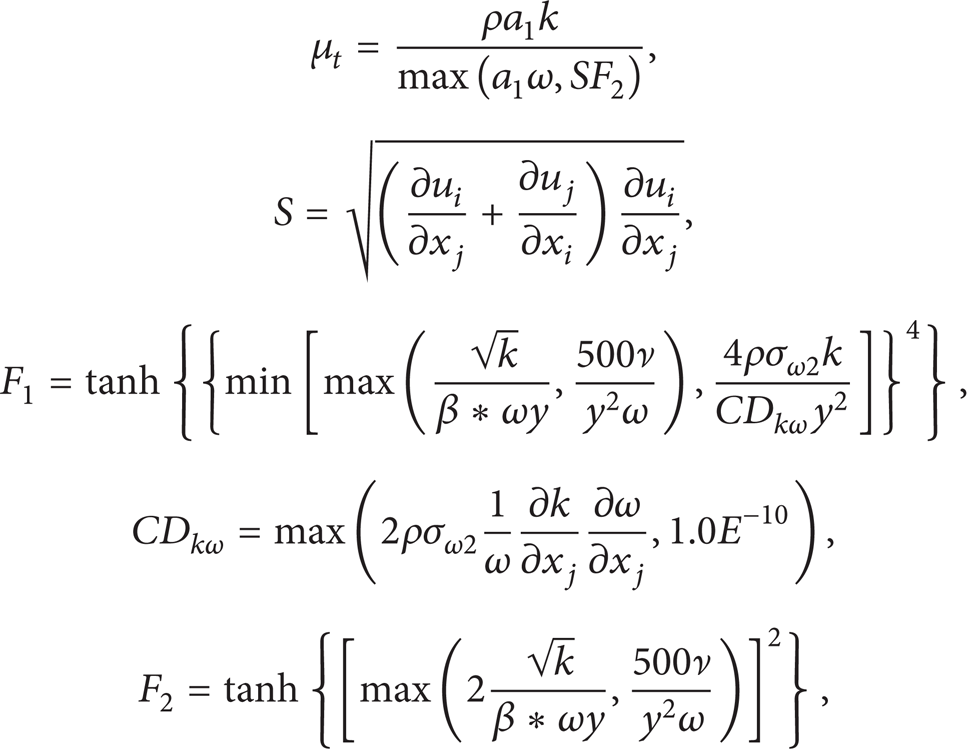
where the coefficients are as follows: β* = 0.09, a1 = 5/9, β1 = 3/40, σk1 = 2, σω1 = 2, a2 = 0.44, β2 = 0.0828, σk2 = 1, and σω2 = 0.856.
2.3. Calculation Grid and Transient Simulation Setup
The fluid calculation domain of the whole flow passage in the pump includes impeller, diffuser and circular casing channels as well as suction, wear-ring, front chamber, and back chamber channels. More accurate results can be obtained because of the leakage flow considered. The structured grids for the whole computational domains are generated using the grid generation tool ICEM-CFD; the grid details are partially shown in Figure 2. The mesh independence is analyzed with 7 different grid numbers. As shown in Figure 3, when the number of mesh increases from 5.49 million to 5.83 million, the results of pump head calculated are similar. Therefore, the grid with about 5.83 million nodes is selected, and the maximum of nondimensional wall distance y+ < 85 has been obtained for the main hydraulic components.

Computational grid.

Mesh independence analysis.
The inlet boundary condition is set to total pressure in the stationary frame while the outlet condition is mass flow rate, and all specific values are obtained from the tests. The discretization in space is of second-order accuracy, and the second-order backward Euler scheme is chosen for the time discretization. The interface between the impeller and the diffuser is set to “transient rotor-stator” to capture the transient rotor-stator interaction in the flow, because the relative position between the impeller and the diffuser is changed for each time step with this kind of interface. Two different coordinate systems are utilized for the rotating and the stationary domains, respectively. A smooth wall condition is used for the near wall function. The chosen time step Δt for the transient simulation is 3.35571 × 10⁻⁴ s for the nominal rotating speed, corresponding to the changed angle of 3° of impeller rotation, therefore, 120 transient results are included for one impeller revolution calculation. Within each time step, the number of iterations has been chosen to be 10 and the iteration stops when the root mean square of residual is less than 10−5. The convergence criterion for the transient problem is that the result has reached its stable periodicity; 9 revolutions of the impeller for each operational condition in this case are conducted. To obtain stable periodic flow results efficiently, a steady calculation with frozen rotor strategy was finished in advance.
With the purpose of the numerical accuracy estimation of the calculations, an established method recommended by the Fluids Engineering Division of ASME was adopted [22]. In principle, this method is based on the Richardson extrapolation theory [23] and has been developed into a generalized formulation applicable for the practical CFD cases. In this paper, three different gird numbers have been studied for the numerical accuracy analysis, namely grid number of 5.83 million, 5.65 million, and 4.24 million. The average mesh volume and grid size h was computed, where h is defined as

Then two monitor points in the flow channel were selected as the “variable φ.” P1 is in the impeller outlet and P2 is in the middle of the diffuser. The detailed parameters of the two points are summarized in Table 2.
The detailed parameters of monitoring points.

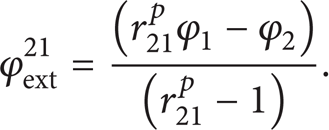
Let h1 < h2 < h3 and r21 = h2/h1, r32 = h3/h2, and calculate the apparent order, p, of the method using the expression
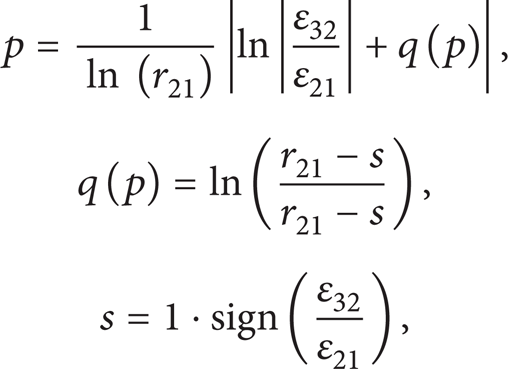
where ∊32 = φ3 – φ2, ∊21 = φ2 – φ1, and φ k denotes the solution on the kth grid. Agreement of the observed apparent order with the formal order of the scheme used can be taken as a good indication of the grids being in the asymptotic rang; the converse should not necessarily be taken as a sign of unsatisfactory calculations.
Calculate the extrapolated values:
Calculate and report the following error estimates, along with the apparent order p:

Extrapolated relative error:

The fine-grid convergence index:
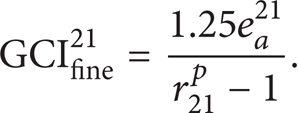
These errors for P1 and P2 have been calculated following the above process. The results were indicated in Table 3. In this case, the numerical uncertainty in the fine-grid solution should be reported as 3.46%.
Calculation results of accuracy estimation procedure.

3. Performance Prediction
The original model pump was tested in the open test rig in the lab, whose testing precision is superior to the national grade 1. As shown in Figure 4, the performance curve is measured by the relevant measurement requirements. The pressure in the inlet and outlet is measured by the pressure sensor, and the precision of sensor is 0.1%. The flow rates are measured by the LWGY-200A turbine flow meter with 0.5% measurement error.

The open test rig.
In order to predict the hydraulic performances of the centrifugal pump, the hydraulic characteristics of flow versus head were calculated. The flow of inlet surface Q in the centrifugal pump is defined as follows:

where A is the area of the inlet or exit of the centrifugal pump,
The total pressure on the inlet and exit surfaces is, respectively, defined by the pattern of the mass average value as follows:

where p t is the total pressure of the calculation element.
The head of centrifugal pump is shown as follows:
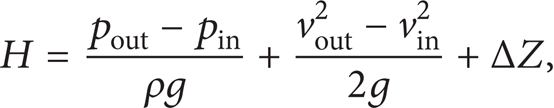
where pin and pout are, respectively, the total pressure of the inlet and outlet of the pump. ΔZ is the vertical distance between the inlet and outlet. vin and vout are, respectively, the speed of the inlet and outlet. g is gravity acceleration.
Figure 5 shows the comparison between calculated and measured performance curves of the pump, and good agreement can be observed while about 4% deviation can be seen for small flow rate condition.

Comparison of predicted and measured performance curves.
4. Results and Discussion
A time-dependent nondimensional pressure coefficient C p was defined to evaluate the periodic pressure as the function of time and impeller rotation position as follows:

To analyze and visualize the flow phenomenon in the circular casing, Figure 6 shows the definition of monitoring points and flow channel sections of circular casing. Six monitoring points P1 to P6 were included. P1 and P2 were located in the discharge tube, and P3 to P6 were located in the circular channel of the casing. Because of the special mounting position of the diffuser in the circular casing, which is an asymmetrical arrangement in axial direction shown in Figure 4, monitoring points in discharge tube and circular channel have different axial positions. Four cross sections in the discharge tube were selected and marked as DTS1 to DTS4, while 6 cross sections of circular channel were also marked as CCS1 to CCS6, and the angle interval between two neighboring sections is 60°. The numerical simulation results under design condition were analyzed in this paper.
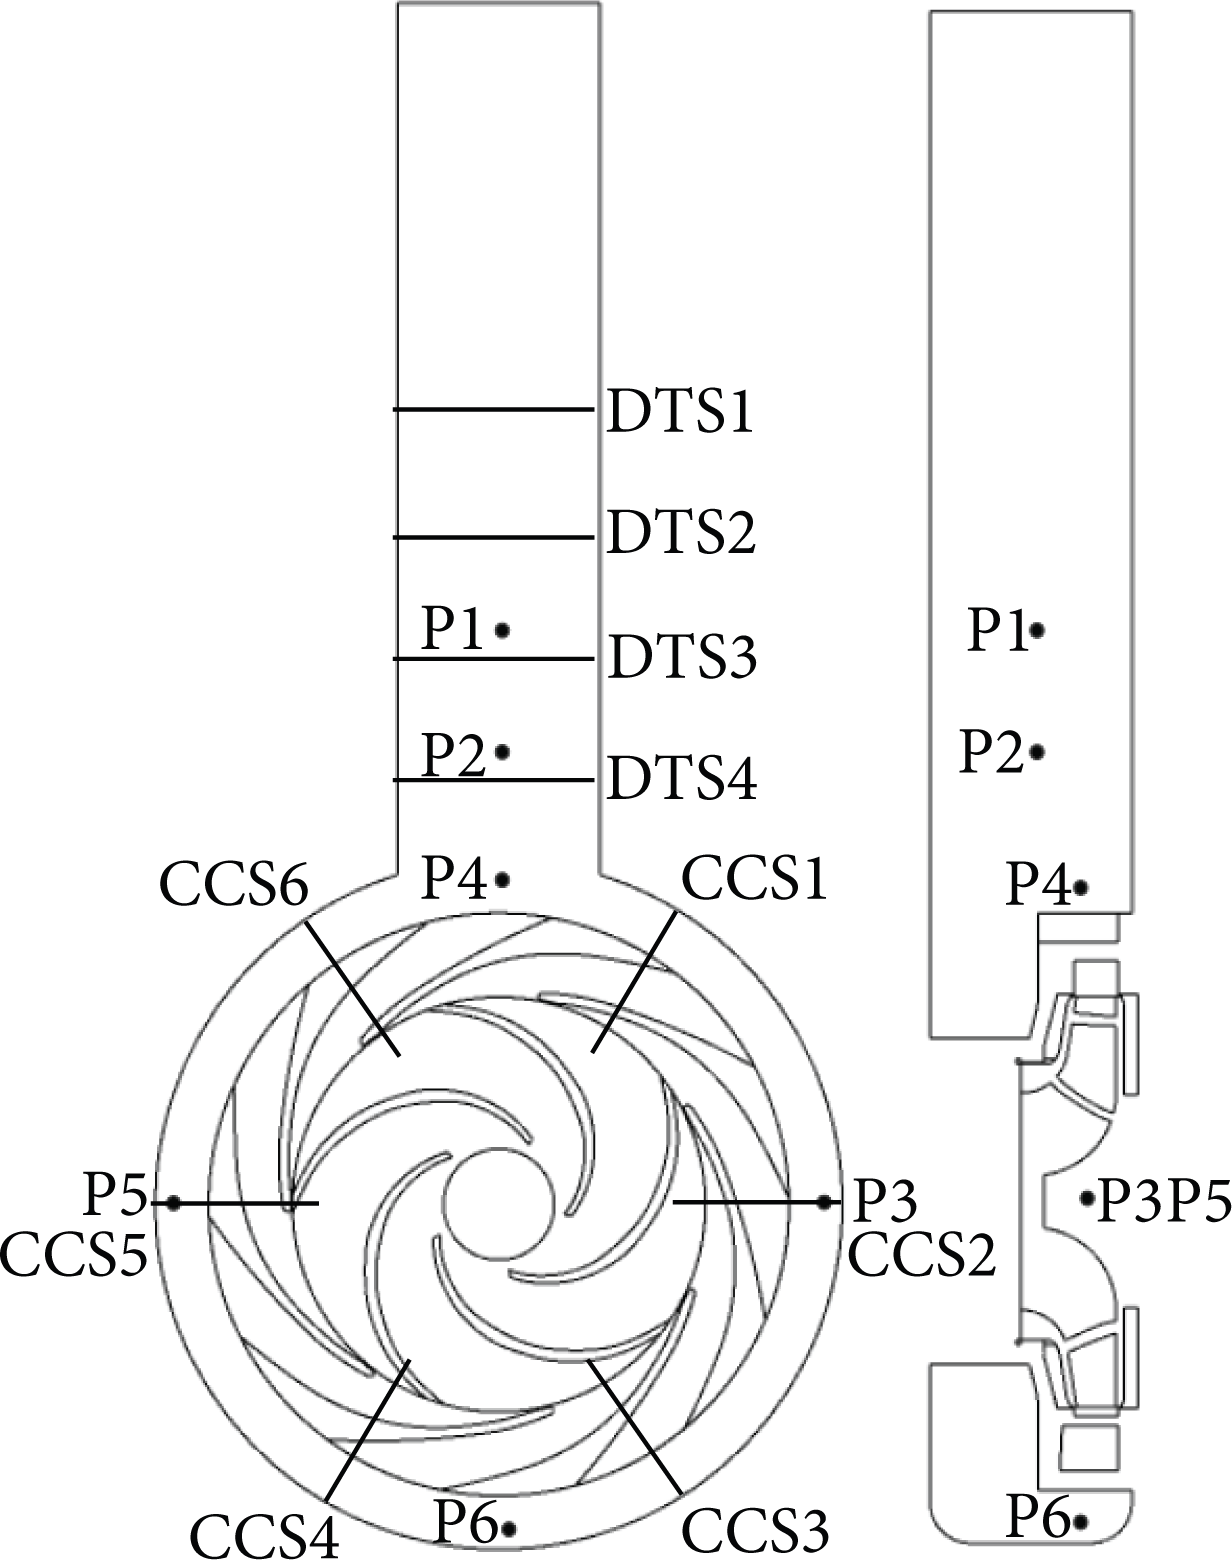
Monitoring points and flow channel sections of circular casing definition.
4.1. Time and Frequency Domain Results on Monitoring Point
Figure 7 shows the time-history results of pressure on monitoring points P1 and P2 for one impeller revolution. Obvious periodic fluctuations of pressure can be found, while the peak-valley value is less than 0.1 on P1 and bigger than 0.1 on P2, because P2 is closer to the gap between diffuser and impeller. To analyze the pressure fluctuation more deeply, the results in the angle of frequency domain should be stated, and the fluctuations with different frequency components can be studied; then the main contributing fluctuation components can be recognized; therefore, the Fast Fourier Transform (FFT) method was used to transform the time domain results into frequency domain results. Because of the time step selected in this paper, the frequency domain below 1500 Hz is valid due to the principle of Shannon sampling theorem. To improve the frequency resolution and to accurately analyze the composition of pressure fluctuations, the sampling time of last 6 calculated impeller revolutions is used which is acceptable in the engineering. Figure 8 shows the frequency domain results of fluctuating pressure on monitoring points P1 and P2, and fBPF indicates the impeller blade passing frequency defined as


Time-history results of pressure on monitoring points P1 and P2 for one impeller revolution.

Frequency domain results of fluctuating pressure on monitoring points P1 and P2.
The pressure fluctuation component of the impeller BPF is much stronger on P2 than on P1, and on most of the higher integer harmonics of the impeller BPF except 2 times, 8 times, and 11 times harmonics of BPF, the fluctuation components on P2 are stronger. However, for P1, stronger fluctuating component can be found in about 16.5 Hz that may be due to some non-periodic turbulent flow effects other than periodic rotor-stator interaction phenomenon.
Figure 9 shows the time-history results of pressure on monitoring points P3 to P6 for one impeller revolution. The averaged values of periodic pressure fluctuations on P4 and P5 are stronger, because the main flow in the circular casing has transferred more kinetic energy to pressure energy in this section. Almost the same fluctuating phase can be found for P3 and P6, while different fluctuation forms can be observed for P4 and P5. Therefore, to check this character, frequency domain results of fluctuating pressure can be observed in Figure 10. On P4, stronger fluctuating component can be mainly found for BPF, while on P5, stronger fluctuating components can be clearly obtained for 2 times and 4 times of BPF. For P3 and P6, little difference can be observed for most of the integer harmonics of BPF, and obvious difference can be only found on BPF.

Time-history results of pressure on monitoring points P3 to P6 for one impeller revolution.

Frequency domain results of fluctuating pressure on monitoring points P3 to P6.
4.2. Unsteady Flow Results in Discharge Tube Channel
To study the unsteady flow phenomenon in more extended space of the flow channel, flow velocity and 2D streamline distributions were analyzed for several typical time points; the time points selected (t0–t3) and the corresponding impeller rotating positions can be seen in Figure 7. Figure 11 shows the velocity and 2D streamline distributions on different DTSes for time point t4. Flow pattern variations on different sections of the discharge tube can be found, and the positions of high velocity and low velocity areas obviously change. In addition, strong secondary flow can be observed for different sections; therefore, strong hydraulic losses will be caused in this area. To indicate the time-variation effect of unsteady flow phenomenon, velocity and 2D streamline results for different time points were selected and shown for DTS4 in Figure 12. Two vortexes can be seen in the whole section, and the scale and form of vortexes change obviously and accordingly with time. The change of the vortex positions can be also observed, and they rotate in the direction of counter-clockwise with time.

Velocity and 2D streamline distributions on DTSes for t4: (a) DTS1, (b) DTS2, (c) DTS3, and (d) DTS4.

Velocity and 2D streamline distributions on DTS4 for different time points: (a) t0, (b) t1, (c) t2, and (d) t3.
The unsteady flow results analyzed above were only visualized on flow channel sections for limited time points or at limited monitoring positions for a whole impeller revolution. It is not easy to check the flow unsteadiness behaviors considering both whole revolution period and whole flow channel at the same time. Therefore, the peak pressure coefficient (PPC) Cppeak and pressure fluctuation intensity coefficient (PFIC) Cpsdv based on statistical thinking were defined as

where p,
Figure 13 shows the PPC distributions for an entire impeller revolution on different DTSes; it can supply the evidence of the peak pressure value on each mesh node during one impeller revolution period. The biggest PPC value and the biggest difference between maximum and minimum PPCs can be found on DTS1 that indicates that during one impeller rotating period the flow structure is the most asymmetrical among all examined sections, and the high pressure and low pressure areas can be found near the tube wall. In addition, the changing trend can be found that, when the section is much closer to the circular channel, more symmetrical distribution of PPC can be observed. Figure 14 shows the PFIC distributions which can indicate pressure fluctuation strength of each mesh node in the casing fluid domain of an entire impeller revolution. Relative weak PFIC distributions can be found on DTS1 and DTS4, and only small part of the section has PFIC values up to 0.00028. On DTS 2 and DTS3, strong PFIC distributions can be observed which indicates in the discharge tube strong pressure fluctuation phenomenon can be found in this area. In addition, the strongest PFIC with the value of 0.0034 can be obtained on DTS2, and the area locates near the tube wall.

Peak pressure coefficient distributions based on statistical method for an entire impeller revolution on DTSes: (a) DTS1, (b) DTS2, (c) DTS3, and (d) DTS4.
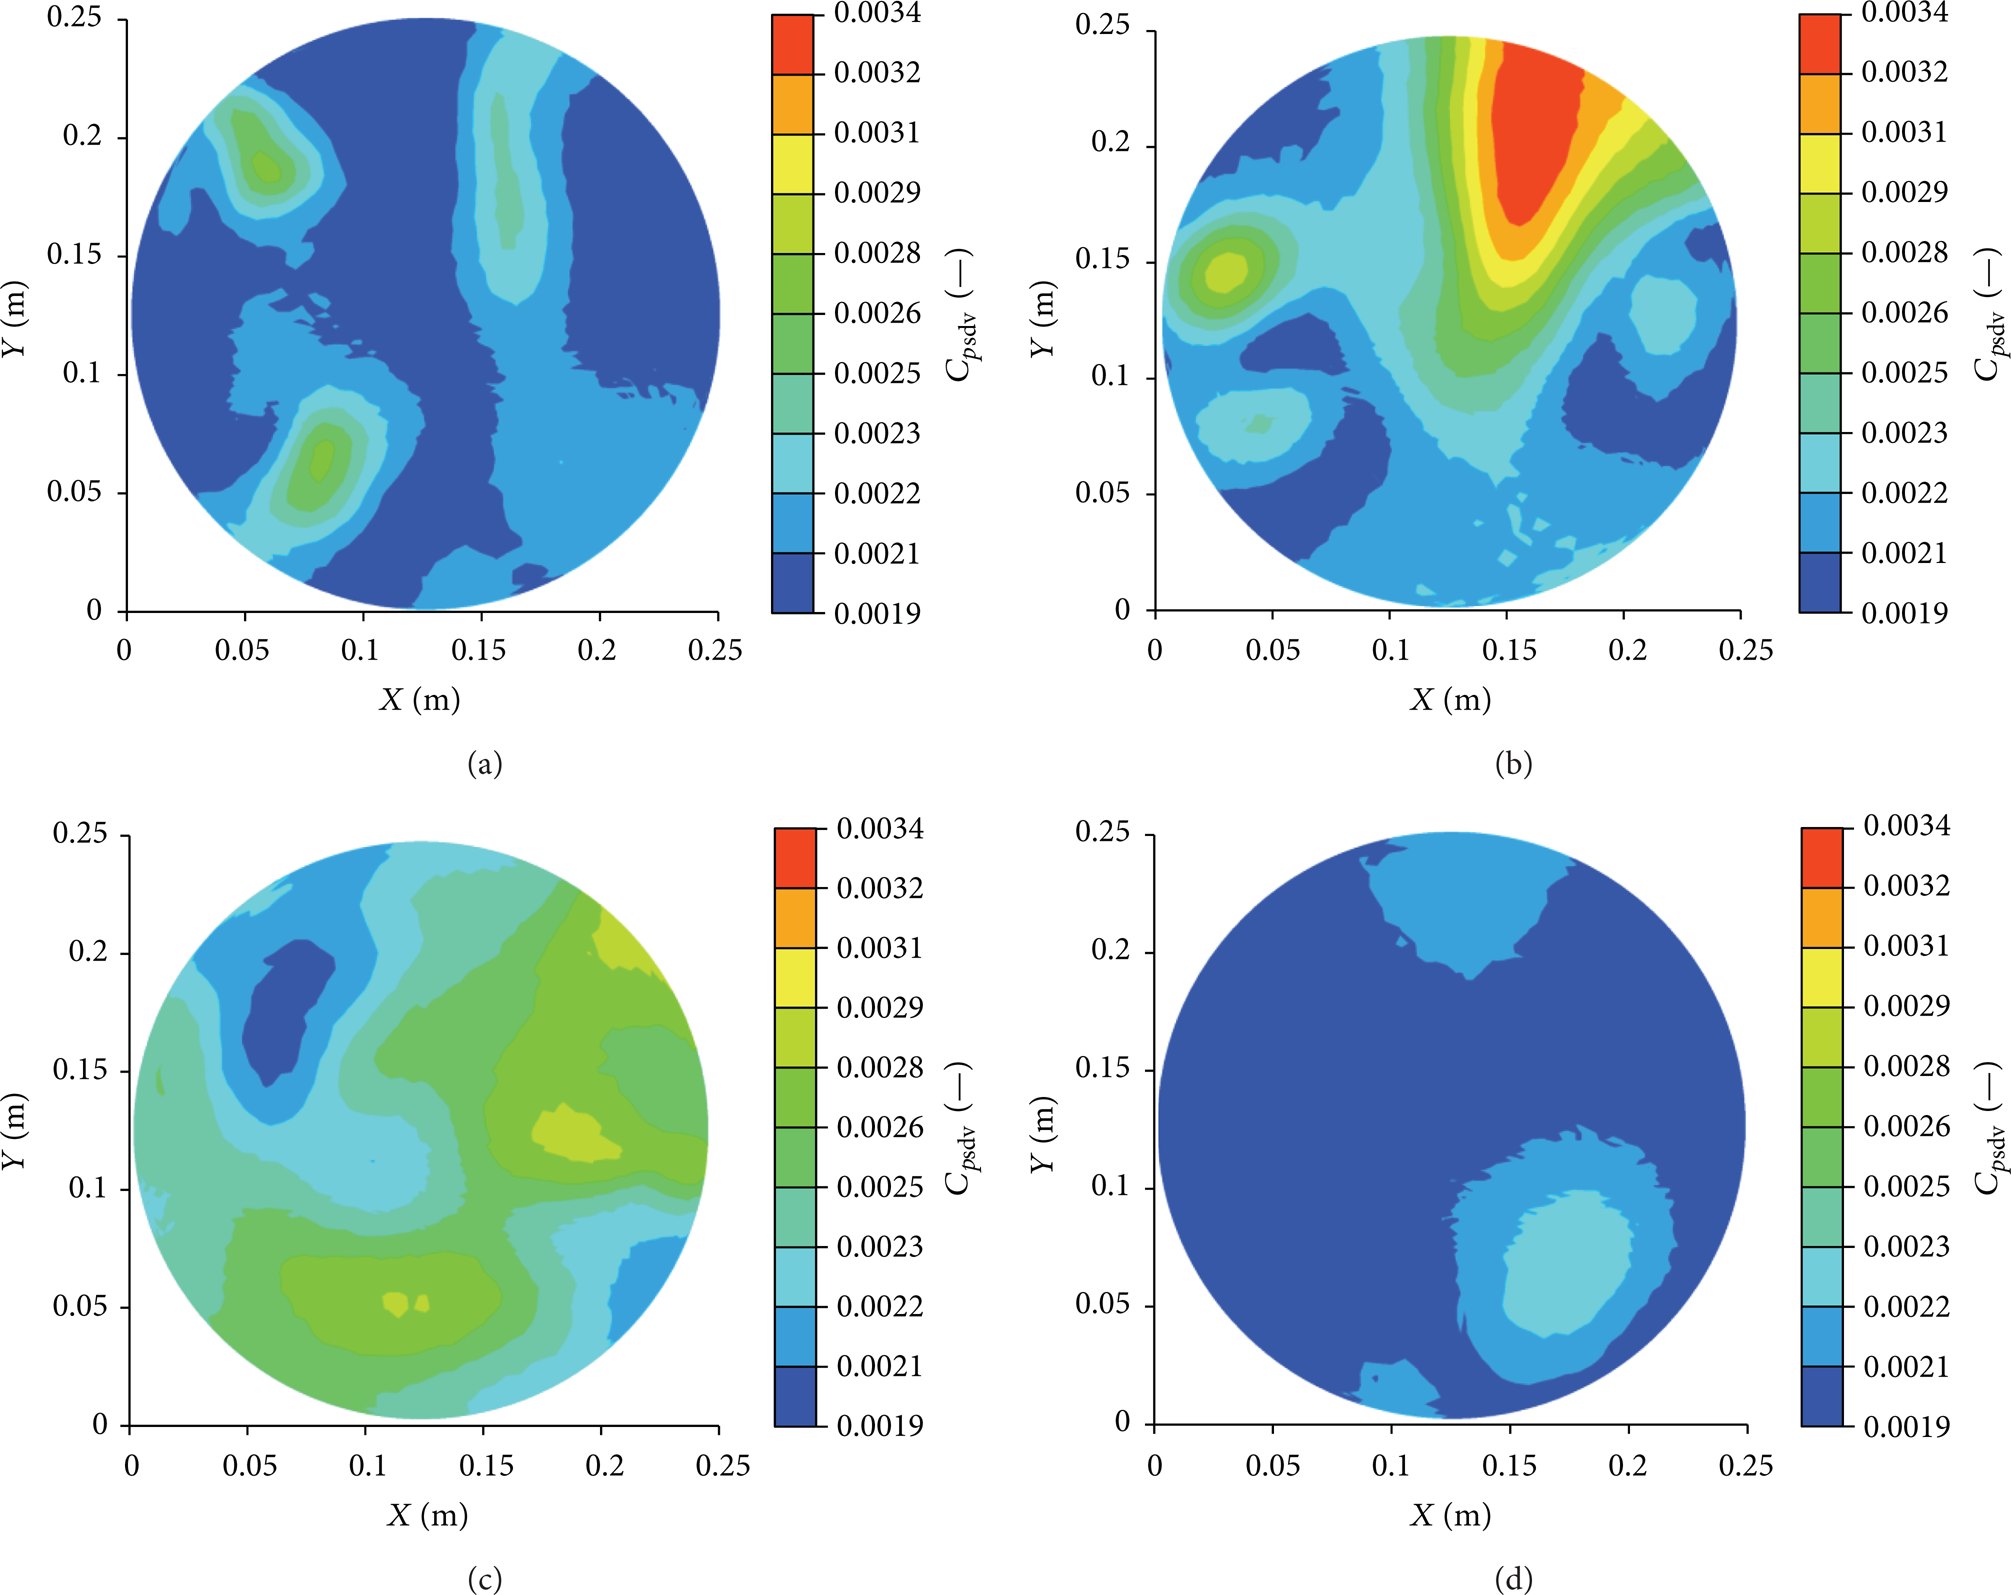
Pressure fluctuation intensity distributions based on statistical method for an entire impeller revolution on DTSes, (a) DTS1: (b) DTS2, (c) DTS3, and (d) DTS4.
4.3. Unsteady Flow Results in Circular Channel
According to the same method, the unsteady turbulent flow in the circular channel of casing was visualized and analyzed. Figure 15 shows the velocity and 2D streamline distributions on 6 CCSes for time point t4. Complex flow structure can be observed, and secondary flow can be seen in all sections. High fluid velocity area can be found near diffuser outlet position on each section, and the velocity on the section decreases from CCS1 to CCS6. Figure 16 shows the velocity and 2D streamline results for different time points on DTS4, and some changes can be noticed, especially near diffuser outlet. However, these results cannot supply the level of changing easily.

Velocity and 2D streamline distributions on CCSes for t4: (a) CCS1, (b) CCS2, (c) CCS3, (d) CCS4, (e) CCS5, and (f) CCS6.

Velocity and 2D streamline distributions on CCS5 for different time points: (a) t0, (b) t1, (c) t2, and (d) t3.
Therefore, the PPC and PFIC distributions for one impeller revolution period should be analyzed. Figure 17 shows the PPC distributions on different CCSes. On CCS1, the smallest PPC value of all sections can be found near diffuser outlet positions, and the biggest difference between maximum and minimum PPCs can be also observed which indicates that the flow pressure field structure is quite asymmetrical in this area. The biggest PPCs can be found on CCS2 in the range of 0.272 to 0.274, and relatively symmetrical distributions of PPC can be observed on CCS3, CCS4, and CCS5. The PFIC distributions were shown in Figure 18, and the smallest PFIC can be found on CCS1 which means weak pressure fluctuations exist in this area. From CCS2 to CCS6, almost the same PFIC distribution can be observed, and strong pressure fluctuations can be obtained in the area near diffuser outlet area, and as a source, the fluctuation energy will spread to the other part of the channel. The strongest PFIC can be found on CCS5 in this case which can supply a clue to optimize the pump casing for more stable pressure field.

Peak pressure value distributions based on statistical method for an entire impeller revolution on CCSes: (a) CCS1, (b) CCS2, (c) CCS3, (d) CCS4, (e) CCS5, and (f) CCS6.

Pressure fluctuation intensity distributions based on statistical method for an entire impeller revolution on CCSes: (a) CCS1, (b) CCS2, (c) CCS3, (d) CCS4, (e) CCS5, and (f) CCS6.
5. Conclusions
In this paper, the periodically unsteady turbulent flow in a special circular casing structure of a high power centrifugal diffuser pump has been investigated numerically by CFD calculation. The velocity distributions in different positions were analyzed, and the pressure fluctuation results in time and frequency domains were considered. Finally, to solve the problems of pressure fluctuation visualizing in whole flow channel for limited time points or at limited monitoring positions for a whole impeller revolution, the pressure fluctuation intensity coefficient (PFIC) and peak pressure coefficient (PPC) based on statistical thinking were defined on each grid node and the results were analyzed quantitatively to check the time accumulation effect of the unsteady flow phenomenon. It was confirmed that the PPC and PFIC results can supply a new angle of view to evaluate the pressure variation, and it is a good supplement to the traditional unsteady pressure analysis method in time and frequency domains.
It is indicated that the three-dimensional unsteady turbulent flow in the circular casing is very complex and includes oscillating large-scale vortexes and secondary-flow phenomenon, and strong pressure unsteadiness can be found near diffuser outlet position of the circular channel and in discharge tube. The present study suggests that it is necessary to estimate the flow unsteadiness distribution in the circular casing during the design process to find the appropriate structure to decrease the flow unsteadiness and to increase the pump reliability.
Footnotes
Nomenclature
Conflict of Interests
The authors declare that they have no financial or personal relationships with other people or organizations that can inappropriately influence their work; there is no professional or other personal interest of any nature or kind in any product, service, and/or company that could be construed as influencing the position presented in, or the review of, this paper.
Acknowledgments
This work was supported by the National Natural Science Foundation of China (Grant nos. 51239005, 51009072), the National Science & Technology Pillar Program of China (Grant no. 2011BAF14B04), and Research Foundation for Advanced Talents of Jiangsu University (Grant no. 13JDG084).