
Abstract
Fire is a common and disastrous phenomenon in subway transportation systems because of closed environment and large passenger flow. Traditional methods detect and forecast fire incidents by fusing the data collected by wireless sensor networks and compare the fusion result with a threshold. However, this approach has a significant shortcoming. Fusion of data decreases the amount of useful information since the distribution of data is not considered. In this paper, a novel mechanism based on wireless sensor networks is proposed and we can use the mechanism to detect fire in subway transportation systems. The core algorithm in this mechanism is an alternative of data fusion in wireless sensor networks. The mechanism uses the quantity information acquired from the data and also considers the distribution information of the data in order to predict the occurrence of fire incidents. The simulation results show that fire incidents can be detected fast and efficiently.
1. Introduction
Wireless sensor networks (WSNs) have extensively been used due to their excellent capability of monitoring real physical environments and collecting data [1]. For example, WSNs have been used in military, medical, and environmental monitoring applications, among others. Surely, the fields in which they are applied will continue to expand.
With the rapid process of urbanization, more and more people live and work in big cities. As a result, public transportation systems are under great pressure, and subway transportation systems are good choices to help relieve this pressure. However, fire is a common and disastrous phenomenon in subway transportation systems, and great attention must be paid to guarantee the safety of the public in such systems. Thus, the research on fire detection in subway transportation systems is very important.
In this paper, WSNs are used in subway transportation systems to monitor fire. The sensors deployed can collect data about temperature, and then we store the data in the database. Fire incidents can be predicted by comparing the distribution of the data collected and the normal distribution of the data on the condition when there is no fire. There are two rules that will be followed when comparing the distributions—the rule of the best consistency comparison and the rule of the best squared comparison. In this paper, these two rules are the core of the mechanism for fire detection. The best consistency comparison is a good method for fire locating, but it cannot provide any indication of the situation of the fire. Conversely, the best squared comparison cannot locate a fire, but it is a perfect method for estimating the severity of the situation, because this method has accumulated all the differences of these two functions rather than just the large differences. Therefore, the two methods have their own advantages and shortcomings and fire can be detected more accurately and efficiently by making use of the strengths of these two methods.
The mechanism proposed in this paper is an alternative of the mechanisms based on data fusion. Compared with other mechanisms, our mechanism can detect fire incidents all around and the result is more accurate. Fire incidents can be sensed, located, and monitored and the situation of the fire incidents can be estimated. Therefore, the mechanism proposed in this paper is more valuable.
The rest of the paper is organized as follows. Section 2 introduces the related work of this paper, and Section 3 introduces the preliminary techniques. The fire detection system is discussed in detail in Section 4, and its performance is evaluated in Section 5. The conclusions are presented in Section 6.
2. Related Work
Studies on smart home [3–6] such as fire monitoring and detection have been researched for many years. Most monitoring and detection approaches make use of temperature and humidity sensors, smoke detectors, cameras and so on. In [7], a fire-detection system is proposed based on multisensory technology and neural networks. However, this method requires a large number of training samples due to the multivariate classification that applies to a neutral network. Moreover, it is assumed that possible events of fire detection have to be well studied for its priori information by the neural network. Hence, for an unseen event to be learned, the entire neural structure must be reformed. In [8, 9], the authors presented a system that was based on various types of sensors and that used probabilistic neural networks. However, such systems require the use of a training set, and most of them are evaluated in indoor environments, where the environmental conditions are absolutely controllable and, of course, completely different from the outdoor environment. A method for fire detection based on multisensory data fusion was presented in [10]. There are three types of sensors, that is, temperature sensors, humidity sensors, and cameras, and the authors combined the three types of data by D-S evidence theory (Dempster-Shafer evidence theory) to detect a fire [2, 11]. In [12], the authors proposed adaptive fusion algorithms, which are improvements over data fusion algorithms. Neubauer [13] applies genetic algorithms to an automatic fire detection system. The online identification of stochastic signal models for measured fire signals was presented. A system for monitoring fires using a WSN that collects temperature, humidity, and barometric pressure is described in [14].
Our approach is a novel mechanism for monitoring fires, and it is based mainly on statistical data and the process is different from the approaches used in previous methods. In order to illustrate the mechanism easily, we assume that there are only temperature sensors present. The occurrence of fire is judged by combining the distribution of the data collected and the normal distribution of the ordinary data when there is no fire. If the data show significant differences, it is very likely that there is a fire.
3. Preliminary Techniques
The proposed novel mechanism for fire detection mainly has three preliminary techniques
Interpolation is an alternative method of data fitting, and, in some conditions, it is an easier and more accurate method especially for the complicated functions; for some extreme cases, the performance of data fitting cannot be accepted. Because of the reasons we proposed before, in this paper, cubic spline interpolation is used rather than Gaussian data fitting or some other data fitting techniques to get the continuous function of the discrete data collected by the sensors. The second preliminary technique is the best consistency comparison. It is a method that can identify the points at which the two distributions have obvious differences. The differences will be used to locate fire. The third preliminary technique is the best squared comparison, which can be used to obtain the whole difference between two distributions that can be compared. It can accumulate all of the differences rather than just the main differences. Therefore, it is a good way to estimate the situation of the fire.
We will introduce the techniques in detail below.
3.1. Cubic Spline Interpolation
Interpolation is an alternative method of data fitting whose characteristic is the continuous function across all the discrete data points. Cubic spline interpolation is a classic method because of its gliding property. The performance of interpolation is better than the performance of fitting when the function is not a simple function, for example, when the discrete data have two peaks.
As shown in Figure 1, the continuous function obtained using the method of cubic spline interpolation crosses all the discrete points and is smooth. However, the continuous function obtained by polynomial fitting is not close to the actual data, even though the order of the polynomial is nine. Therefore, in this paper, cubic spline interpolation is used to process the discrete data.

Cubic spline interpolation and a ninth-degree polynomial fitting.
3.2. The Best Consistency Comparison
Assuming there are two continuous functions, for example,

The peaks of
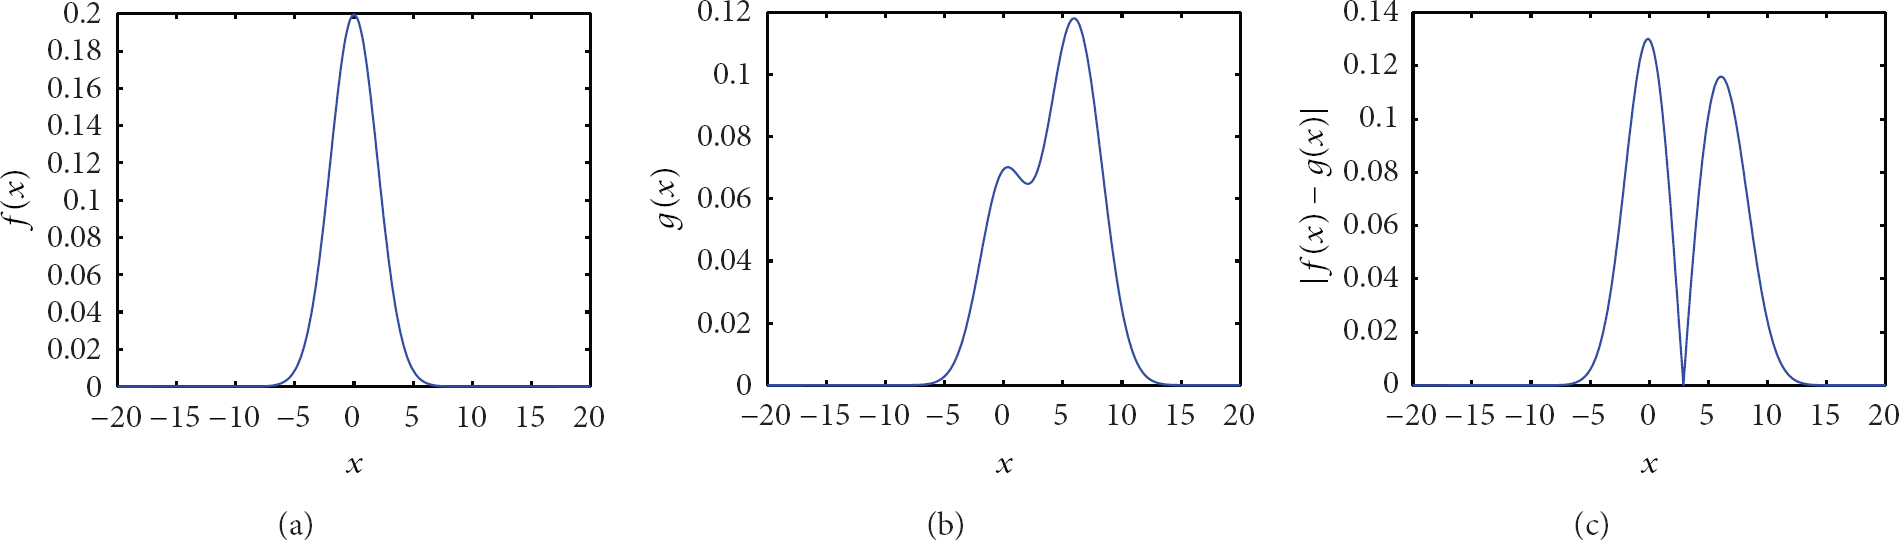
(a)
As shown in Figure 2, the peaks of
The best consistency comparison is very sensitive to the big differences in a point and it is quite good for locating the fire. But the shortcoming is that this method cannot provide any information about the fire situation. To offset the shorting of the best consistency comparison, we propose another rule for comparison in Section 3.3.
3.3. The Best Squared Comparison
When there are two continuous functions, for example,
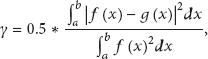
(a)
We can define the severity of a fire by γ:

The best squared comparison is a good measure for estimating the situation because this method accumulates all the differences between the two functions. On the contrary with the best consistency comparison, the shortcoming of the best squared comparison is that it cannot locate a fire, so these two comparisons will become complementary.
4. Fire Detection System
Applying the technologies introduced in Section 3, this paper proposes a new fire detection mechanism as shown in Figure 4 briefly to predict the fire perfectly. To be specific, the implementation details of each subprocess are expounded in Sections 4.1–4.5.

Flow of the fire detection mechanism.
As shown in Figure 4, SubProcess4 is the core of our mechanism by which we can judge whether there is a fire. SubProcess1 and SubProcess2 are the basement of SubProcess4 through which we can get
4.1. Predict the Normal Temperature in the Subway Transportation Systems
To predict the normal temperature in the subway transportation system, the association rules between the climate of the city and the normal temperature in the system are to be determined. A weather report provides the climate of city in a discrete way, for example, every 30 minutes or 60 minutes, and through the association rule, we can predict the normal temperature in the subway transportation system.
To our knowledge, the association rule between the climate and temperature in the subway transportation system can be mined by the technique of data mining, and then we can get the normal temperature, but it is not the core algorithm in this paper. Therefore, normal temperature in Beijing subway transportation system is given and is a set of discrete data at different times on a day as shown in Figure 5.

Continuous temperature for a day obtained by cubic spline interpolation.
To get the temperature at any time, continuous function to represent the discrete data based on cubic spline interpolation is developed, and the result is presented in Figure 5. We can find that the continuous function crossed all the discrete points and it is very smooth and it satisfied our feeling better than data fitting.
This is the continuous function of temperature for a day obtained by cubic spline interpolation, and the actual temperature at any time of the day can be obtained using this function. Getting the accurate temperature is the basement of fire detection.
4.2. Reason the Normal Distribution
of the Data We Collected by WSNs
Because of the inherent features of sensors, accurate measurements of the temperature in the subway transportation system cannot be obtained. The observed value often follows a Gaussian distribution with a variance
In Section 4.1, we obtain the normal temperature T and the distribution of the temperature obtained from the sensors should be a Gaussian distribution with a mean of T and a variance of
For example, the sensors deployed in the subway transportation systems with a variance

Normal distribution of temperature for 30°C.
Figure 6 shows that, although the temperature is 30°C accurately, because of the property of sensors, we cannot obtain the temperature accurately using the sensors; often, the measuring result follows a Gaussian distribution. Therefore, if the distribution of the data obtained from the sensors is very similar to the distribution shown in Figure 6, we believe that the actual temperature is 30°C.
4.3. Get the Distribution
of the Data Collected by WSNs
After collecting the temperature data from the sensors deployed in the subway transportation system, we process the data to get their approximate distribution function, as described below.
First, the smallest and the largest number of data is found, recorded as
Second, the range
Third, for each segment, the number of the data that fall into this segment is added up, and a bar graph of data is obtained that comprises of discrete points.
Fourth, we use cubic spline interpolation to get a continuous function, which is an approximation of the discrete data.
The pseudocode of this algorithm is described as in Algorithm 1.
Input: the data set Output: the distribution (1) Sort the data in D and get new sequence (2) (3) (4) for each (5) if ( (6) (7) end if (8) end for (9) Get the two dimension data set (10) Interpolate the discrete data set (11) Return
Figure 7(a) is a bar graph of 2000 temperature readings generated by the 2000 sensors deployed, and Figure 7(b) is the continuous function obtained by cubic spline interpolation.

(a) Discrete bar graph of the data (b) Continuous function of the discrete data (°C).
4.4. Control the Period
of Data Collected and Process by Analyzing
At the beginning of fire, the distribution of
To find the peaks, the algorithm proposed is described as follows.
First, the derivative of
Second, get the normal temperature T through Section 4.1.
Third, if there is a zero point
In Figure 7(b), there are six zero points, that is, 23.4, 23.7, 29.8, 35.5, 36, and 36.7. However, there is no zero point that satisfies the conditions described in the third step; therefore,
Conversely, if the fire alarm is removed,
The pseudocode of this algorithm is described in Algorithm 2.
Input: thresholds, Output: the new period (1) Take the derivation of (2) Find the zero points of them in the data set (3) for each (4) if (5) (6) break;} (7) else if (8) (9) break;} (10) end if; (11) end for (12) return
4.5. Compare
and
to Find Whether There Is Fire
We have got
The flow to judge whether there is a fire is shown in Figure 8.

Flow of the fire judgement.
Just as we described in the Introduction, the best consistency comparison and the best squared comparison have their own advantages and disadvantage. So, we will use both of them to get an all-sided result and for different results we should take different methods to process the fire appropriately.
5. Performance Evaluation
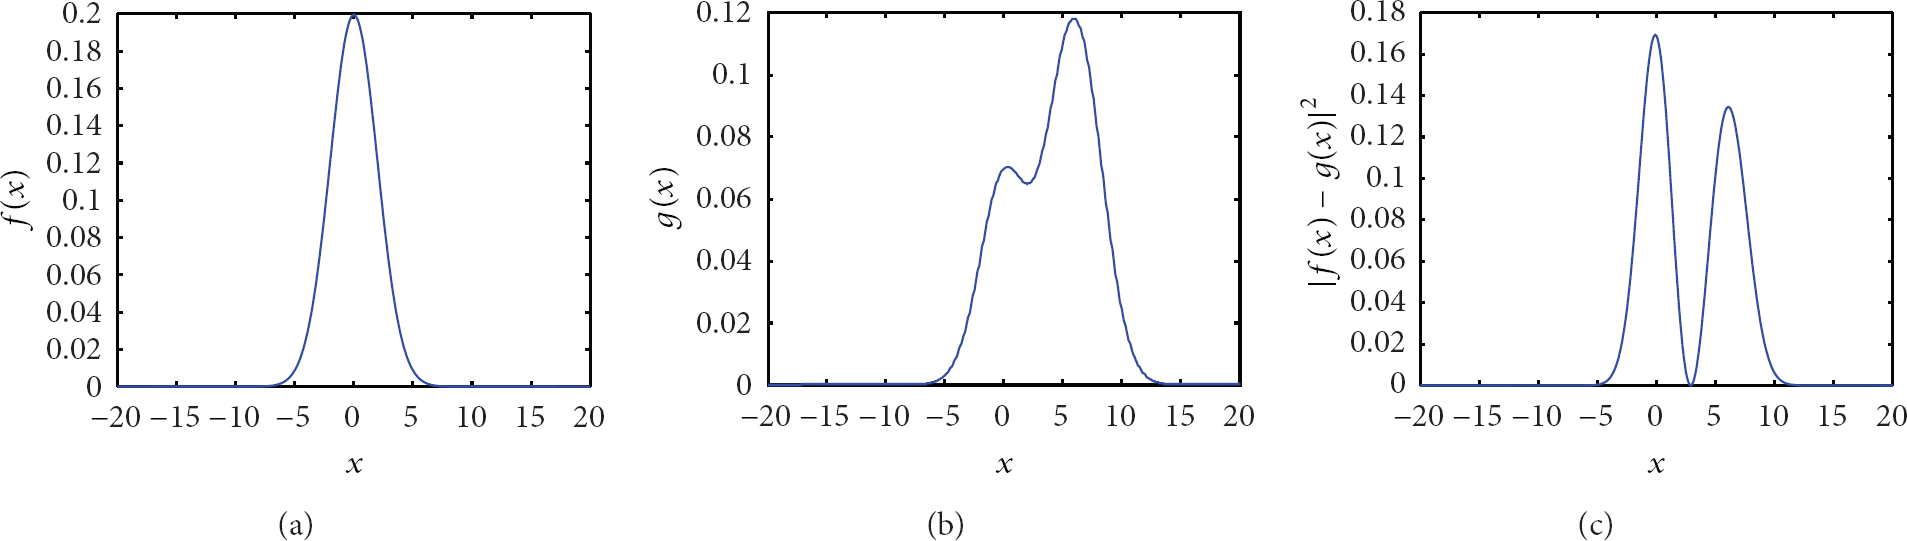
To examine the mechanism for fire detection in subway transportation systems, we set two different situations of fire incidents and they can check the mechanism in different aspects. The local fire incident is used mainly to examine the best consistency comparison and the large fire incident is used mainly to check the best squared comparison. For different fire, our experimental parameters are set as in Table 1.
Experimental parameters.
Through our mechanism, the fire incidents will be predicted. If there are local fires in various places, we will locate them quickly and inform the security officers; if there is a large fire that is almost everywhere in the system, we will locate the places where the fire is very severe, and then we will inform the security officers.
5.1. Hypotheses of Simulation
To simplify the simulation, there are some hypotheses.
Difference of properties in sensor measurement between the sensors is not considered. We assume that all the sensors have the same properties, such as the same measuring range and the same measuring error. In this paper, we assume that each sensor used can measure temperature up to 1000°C and the errors in the measurements are presented in the distribution of the data measured by the sensors. The temperature around a fire is all the same. In fact, the temperature decreases with the increase of the distance between the fire and the sensors. In this case, it is very difficult to simulate. Therefore, in this paper, we ignore the influence of this phenomenon. The temperature of the subway transportation system is all the same. This hypothesis is reasonable because for a subway transportation system, the environment of a subway is almost all the same. If the subway transportation system is too big that the temperature is different between different parts, we can divide the subway transportation system into several parts and it is feasible that the environment of each part is almost all the same. We can use our mechanism in each part. To guarantee a good result, we assume that the number of sensors is large enough and the sensors are deployed uniformly in the subway transportation system. In our experiment, we assume that for a local fire, there are 200 sensors that can defect the fire, and for a large fire, there are about 1500 sensors that can defect the fire.
Based on the three hypotheses, our experiment results are presented as follows.
5.2. Detect Local Fires
In this part, local fire at about 100°C is simulated and the system consists of 200 sensors for temperature measurement.
The simulation results are shown in Figure 9.

Continuous function of the discrete data obtained by cubic spline interpolation.

Normal distribution and the continuous bar graph.
As shown in Table 1, 2000 temperature measurements are obtained, and the interval is 0.5°C. Figure 9 shows that there are two peaks: one peak is at 30°C and the other peak at 100°C indicates a local fire.
A continuous function of the discrete bar graph is obtained by cubic spline interpolation, and this function could be easily compared with the normal distribution.
Figure 10 shows the normal distribution and the continuous function obtained by cubic spline interpolation. It is evident that there are mainly two large differences between them. The first difference occurs at 30°C, and the second occurs at a temperature of 100°C. However, they are not equally important, because the first difference means that some sensors may have moved to a higher temperature, and our more important concern is the new location of the sensors. The second peak shows that the temperature of some places in the subway transportation systems has increased to 100°C. Because

(a) Consistency difference between the normal distribution and the continuous bar graph. (b) Square difference between the normal distribution and the continuous bar graph.
After determining the unusual points through the best consistency comparison and locating the fire, the situation can be estimated using the best squared comparison. By (2), we get
5.3. Detect Large Fires
In this part, a large fire is simulated with a temperature of 200°C, and the fire is measured using 1500 sensors.
It is evident that there are two peaks of the data collected by the sensors in the subway transportation system. The first peak is at 30°C and the second one is at about 200°C. Obviously, it is unusual for the second peak which is much higher than the first peak, and this indicates that the fire is large.
In order to compare the distribution of the discrete data with the normal distribution through our two comparison rules, the discrete data are interpolated by cubic spline interpolation, and the results are shown in Figure 12.

Continuous function of the discrete data obtained by cubic spline interpolation.
Figure 13 shows that there are two big differences between them: one is at 30°C and the other is at 200°C. Figure 14 shows the consistency difference and the square difference between the normal distribution and the continuous bar graph.
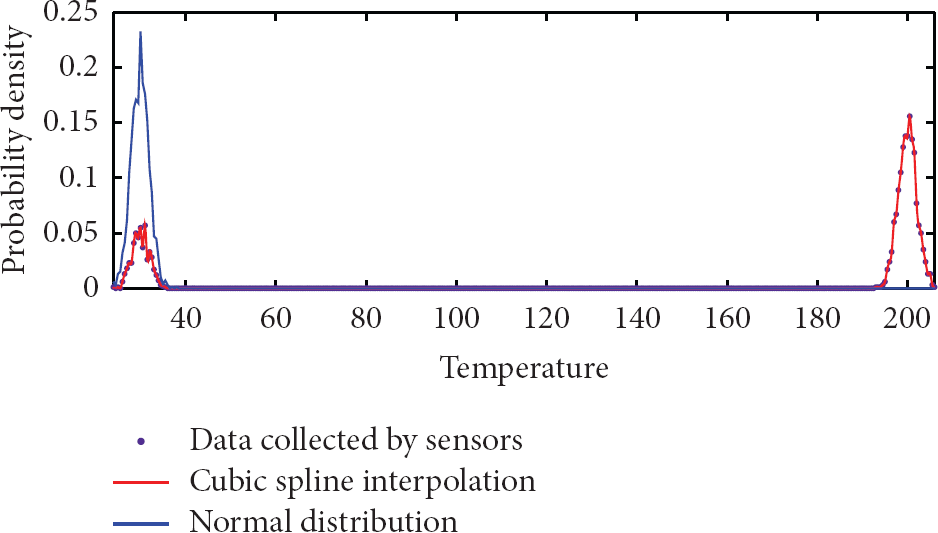
Normal distribution and the continuous bar graph.

(a) Consistency difference between the normal distribution and the continuous bar graph. (b) Square difference between the normal distribution and the continuous bar graph.
Because
6. Conclusion and Future Work
In this paper, we have proposed a novel mechanism based on WSNs for fire detection in subway transportation systems. For different types of fire incidents, it is obvious that we focus our attention on different aspects of them. For a local fire, it is important to locate the places where the fire happens quickly and efficiently because it is the best result to put out the fire when it is small, and for a large fire incident, it is important to estimate the situation as accurate as possible because it is impossible to extinguish a big fire immediately. For different order of severity we should take different measures. Through the two comparisons we proposed in our paper, we can get a satisfied result. The simulation shows that the performance of the mechanism described in this paper is satisfactory, and we can detect almost all the situations associated with a fire efficiently and quickly.
As our future work, to improve the reliability and safety of the mechanism, we will introduce some other important measures for a fire, such as the humidity of the environment and the concentration of smoke in the subway transportation system. In this way, there will be several results for the prediction of fire. However, it is not competent for our mechanism to fuse these several results. Therefore, we will use the technique of fuzzy set theory or D-S evidence theory to fuse the results on decision level.
On the other hand, we will design a better simulation which is closer to the actual situation. In this paper, we have several hypotheses to simplify our simulation which may have some influence on the simulation results.
Footnotes
Acknowledgments
This research is supported by Beijing Science and Technology Program under Grant Z121100007612003, Beijing Natural Science Foundation under Grant 4132057, and National Natural Science Foundation under Grant 61371071.