
Abstract
A numerical modeling of bubble-driven flow patterns in a glass of champagne has been carried out for three champagne temperatures, by using the finite-volume method by CFD (computational fluid dynamics). In order to define source terms for flow regime and to reproduce accurately the bubble nucleation process responsible for champagne effervescence, specific subroutines for the gaseous phase have been added to the main numerical model. These subroutines allow the modeling of bubbles behavior based on semiempirical formulas relating to bubble diameter, mass transfer, velocity, and drag force. Both ascending bubble dynamics and bubble-driven flow patterns dynamics were examined, respectively, 60 s, 180 s, and 300 s after pouring champagne into the glass. Details and development of the various steps of modeling are presented in this paper, showing that the bubble-driven flow patterns velocities of the liquid phase significantly vary with the champagne temperature.
1. Introduction
Ascending bubbles are indeed very common in our everyday life. They play a crucial role in many natural as well as industrial processes (in physics, chemical and mechanical engineering, oceanography, food science, and even medicine) [1–6]. Nevertheless, their behavior is often surprising and, in many cases, still not fully understood. In the science of champagne, much interest has been devoted to bubble dynamics in the past decade. A large piece of experimental works has focused on what could be called the bubble trilogy, namely, the bubble nucleation, the bubble rise, and the bubble collapse, as they reach the champagne surface (for a global review see [7] and references therein).
Since the end of the 17th century, champagne has been a worldwide renowned French sparkling wine. From a strictly physicochemical point of view, champagne wines are multicomponent hydroalcoholic systems, with a density close to unity, a surface tension γ ≈ 50 mN m−1 (indeed highly ethanol dependent), and a viscosity about 50% larger than that of pure water (also mainly due to the presence of 12,5% v/v ethanol) [7]. Champagne wines are also supersaturated with CO2-dissolved gas molecules formed together with ethanol during the second fermentation process (called prise de mousse, and promoted by adding yeasts and a certain amount of sugar inside bottles filled with a base wine and sealed with a cap). It is worth noting that a standard 75-centiliters champagne bottle typically holds about 9 grams of dissolved CO2, which correspond to a volume close to 5 liters of gaseous CO2 under standard conditions for temperature and pressure. No wonder champagne and sparkling wine tasting mainly differs from still noneffervescent wine tasting due to their large amount of dissolved carbon dioxide.
When a bottle is uncorked, and champagne is poured into a glass, there are indeed two pathways for progressive CO2 and volatile organic compounds (VOCs) losses. CO2 and VOCs escape (i) into the form of heterogeneously nucleated bubbles, the so-called effervescence process and (ii) by “invisible” diffusion through the champagne/air interface [8–10]. Glass shape, and especially its open aperture, is therefore also suspected to play an important role as concerns the kinetics of CO2 and flavor release during champagne tasting. From the taster's point of view, the perception of wine flavors was indeed found to be influenced by glass shape [11, 12]. From the consumer point of view, the role of effervescence is indeed essential in champagne, sparkling wines, beers, and to a great extent, in any other carbonated beverage [13–15]. Without bubbles, champagne would be unrecognizable as such, beers and sodas would be flat. However, the role of effervescence is suspected to go far beyond the solely aesthetical point of view. Effervescence and dissolved CO2 impact champagne and sparkling wine tasting in terms of (i) visual perception, by the presence of dancing bubbles in the glass, (ii) taste and mouthfeel, by the fizzy and chemosensory excitation of nociceptors in the oral cavity (via the conversion of dissolved CO2 to carbonic acid) [16–18], and (iii) aromatic perception, as bubbles release their content in gaseous CO2 and VOCs above the champagne surface. Furthermore, ascending bubbles were strongly suspected to play an indirect role on the release of gaseous CO2 and VOCs above the champagne surface. Actually, it is worth noting that, at the bubble scale, the lower part of a rising bubble is a low-pressure area which literally attracts the fluid molecules around. A rising bubble is thus able to drain by viscous effect some fluid along its path toward the free surface. The huge number of bubbles released from the several nucleation sites found in a typical champagne glass (of order of several hundreds of bubbles released per second during the first minutes of champagne tasting) was therefore suspected to set the whole liquid bulk in motion. In turn, the release of gaseous CO2 by diffusion through the free air/champagne interface, as well as the release of the numerous VOCs found in the liquid phase (which both strongly depend on the mixing flow conditions of the liquid medium), should be logically enhanced in case of ascending bubble-driven flow patterns. For all the aforementioned reasons, a very strong coupling was therefore strongly suspected in champagne and sparkling wines tasting, between dissolved CO2, the presence of rising bubbles, glass shape, CO2 discharge, and VOCs release [19].
Recently, the simultaneous quantification of CO2 and ethanol in the headspace of a champagne glass was monitored, in real tasting conditions, all along the first 15 minutes following pouring, depending on whether the glass shows effervescence or not. Both CO2 and ethanol were found to be enhanced by the presence of ascending bubbles, thus confirming the close link between rising bubbles and the release of gaseous CO2 and volatile organic compounds [7]. Only quite recently, laser tomography techniques combined with fluorescent continuous dyes or solid discrete tracers were used to evidence ascending bubble-driven flow patterns found in champagne glasses [20–22]. Flow patterns found in champagne glasses were characterized by a vortex ring showing axisymmetry with regard to the ascending bubble column [23–25], as illustrated in Figure 1. Very recently also, numerical modeling was used in order to approach bubble-driven flow patterns found in champagne glasses. The influence of the glass geometry was investigated [26]. From a numerical point of view, the two most common approaches to model bubble columns are the Euler-Euler (called also two-fluid approach) and the Euler-Lagrange (called also discrete phase) ones [1, 2]. In the Euler-Euler approach, the continuous liquid phase and the dispersed gas phase are modeled as two interpenetrating continuous phases. In the Euler-Lagrange approach, the volume-averaged Navier-Stokes equations are used to describe the motion of the liquid phase [2]. In the latter situation, each bubble is tracked on the basis of a balance of forces acting upon bubbles and on a motion equation [26]. Even if the dynamics of individual bubbles are now well understood, it seems that there is a lack of data in the study of bubble-driven flow patterns in beverages supersaturated with dissolved gas. Moreover, temperature is strongly suspected as being a key parameter in champagne tasting. The temperature indeed modifies both the liquid viscosity and the vapor pressure of volatile aromatic compounds.

Flow visualization evidenced through laser tomography technique (a); and 3D scheme of flow patterns found in a glass (b).
In this paper, the influence of champagne temperature on ascending bubble-driven flow patterns found in a very typical champagne flute was investigated, through numerical modeling. Both bubble dynamics and bubble-driven flow patterns in the champagne bulk were followed with time, during the first 300 seconds after champagne was poured into the flute, and for three champagne temperatures (namely, 4, 12, and 18°C).
2. Materials and Methods
2.1. Geometry and Mesh Generation
A traditional flute has been considered as a reference glass case. The glass geometry used in this study has been created from the real dimensions measured of the glass used for the experiments (see Figure 2(a)).

Champagne flute model used in our study (a); inspired from a real flute etched by the glassmaker on its bottom to promote bubble formation (b); the small ring etched on its bottom has been done with adjoining laser beam impacts.
To ensure a continuous and perfectly controlled process of effervescence, glassmakers usually consider circulary etched glasses (Figure 2(b)). In such a way, as previously mentioned, the flow structure exhibits a quasi-steady two dimensional behavior [22] (Figure 1).
In this situation, a 2D examination in the axis symmetry plane can be considered as sufficient. For this purpose, only half of the studied area was drawn. The study area has a total height of 80 mm which corresponds to the fill level and its diameter is 50 mm at the liquid surface level (Figure 2(a)).
The ANSYS Workbench Design Modeler software has been used to draw the geometry from the real size (scale 1: 1) of the numerical study glass used as reference.
The mesh of the domain has been carried out using the ANSYS Workbench meshing software. It consists in a two-dimensional mesh efficient in the case of simulations of axisymmetrical flow features. The body has been meshed with quadrilateral elements (0.2 × 0.2 mm). Along the central part of the flow, the mesh is structured but to follow the wall, the mesh is unstructured (Figure 3).

Mesh of the half fluid domain.
2.2. Equations and Numerical Scheme
Because champagne is a wine in which gaseous as well as liquid phase is simultaneously present, the flows in a glass of champagne have been simulated numerically with a multiphase model. The flow is supposed laminar [19, 27] and transient, so the liquid-phase hydrodynamics are described with the continuity and momentum conservation equations for laminar flows.
2.2.1. Continuity Equation
The general form of the continuity equation can be written as follows:
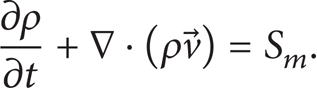
The source S m is the mass added to the continuous phase from the dispersed second phase.
For 2D axisymmetric geometries, the continuity equation is given by
where x is the axial coordinate, r is the radial coordinate, ν x is the axial velocity, and ν r is the radial velocity.
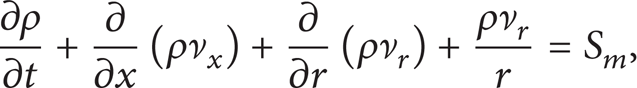
2.2.2. Navier-Stokes Equations
Conservation of momentum is described by

where ρ is the static pressure and
For 2D axisymmetric geometries, the axial and radial momentum conservation equations are given by

where

In this work, we have used the Lagrangian-Eulerian approach which analyzes the liquid phase (primary phase) by the Eulerian method and the bubble phase (secondary phase) by Lagrangian assumption allowing the monitoring of bubbles life cycle.
The Euler-Lagrange approach is the basis of the lagrangian discrete phase model. The dispersed phase is solved by tracking the bubbles through the calculated flow domain while the liquid phase is treated continuously by solving the continuity and Navier-Stokes equations. Exchanges of momentum and mass are realized between the dispersed phase and the fluid one.
According to the Lagrangian multiphase model, the volume fraction of the discrete phase (secondary phase) is quite small.
The bubbles trajectories are computed individually at each time step during the liquid phase calculation. This model is perfectly adapted for modeling the flows in a glass of champagne [26]. In order to reproduce as closely as possible the principle of nucleation, subroutines have been used for the gaseous phase. These subroutines have been written based on physical laws that are taken from previous experimental results [19, 27].
2.2.3. Ascending Bubbles Dynamics
The trajectory of a bubble is predicted by integrating the force balance in a Lagrangian reference frame.
During its rise in the liquid, a bubble is subjected to the action of several forces [19, 27]. The driving force of bubble ascent is buoyancy:

The drag force F D exerted by the fluid around the bubble is expressed as follows:

where C D is the drag coefficient.
The movement of the surrounding fluid leads to an additional force FMA called “added mass” related to the variation in the amount of movement of liquid displaced:

The volume V of liquid entrained in the wake of the bubble is roughly equal to the half of the volume of the bubble. Thus

The equation of motion can be written as follows:

The force of added mass has been compared to the buoyancy along the path of the bubble to the surface. The force of added mass does not exceed 2–3% of the buoyancy, so it can be neglected in the remainder of the study. The equation of motion is finally reduced to a simple equality between the drag force and buoyancy.
During ascent, surface-active materials progressively accumulate at the rear part of the rising bubble, thus increasing the immobile area of the bubble surface.
A rising bubble rigidified by surfactants runs into more resistance than a bubble presenting a more flexible interface free from surface-active materials. The champagne bubbles showed therefore a behavior intermediate between that of a rigid and that of a fluid sphere. To take into account the surfactants accumulation, the two following experimental drag coefficient laws, available in the range of intermediate Reynolds numbers (10−1 to 102) covered by champagne bubbles, have been used. Magnaudet et al. [28] have proposed a semiempirical relationship between the drag coefficient and the Reynolds number:

This experimental determination of the drag coefficient for fluid spheres is available for Reynolds number less than 50.
Since the Reynolds number exceeds the limit of 50 for sufficiently long path, another empirical law has been used available for Re > 50, determined by Maxworthy et al. [29]

Because bubbles do not exceed a critical diameter of 2 mm, they remain spherical during their ascent. Moreover, the assumption that the bubbles do not coalesce or breakup has been considered.
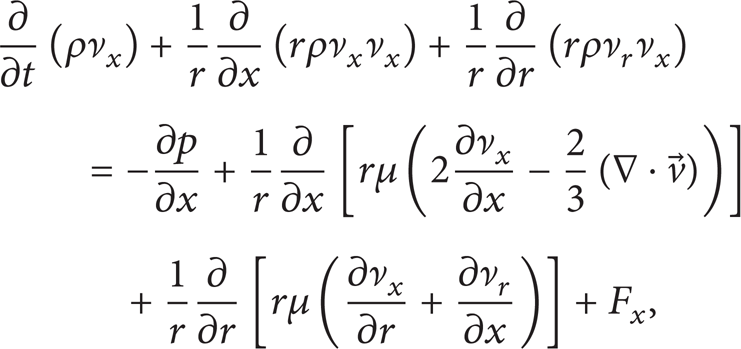
The Reynolds number is defined by:
The density and the viscosity of the champagne wine for the liquid phase and the density and the viscosity of the carbon dioxide for the gaseous phase have been stored in the materials database.
The numerical simulations have been carried out with the ANSYS FLUENT software using finite volume approach. The convergence criteria were based on the residuals resulting from the integration of the conservation equations over finite control volumes. During the iterative calculation process, these residuals were constantly monitored and carefully scrutinized. For all simulations performed in this study, converged solutions were usually achieved with residuals as low as 10−5 (or less) for all the governing equations. Calculations have been performed for the three wine's temperatures (4, 12, and 20°C) with the same time steps and the same mesh.
2.3. Boundary Conditions
Models based on classical nucleation theory do not give a satisfactory approach of nucleation in the effervescent wines [30]. The idea has been to create routines to simulate the principle of nucleation and then compare the results with those obtained with experimental data [19, 27]. In order to simulate the bubbles growth, the bubbles velocity, the mass transfer between bubbles, the mass flow rate, and the drag law, we have written user-defined functions (UDF) in C language which defines source terms for the flow regime. The variation of bubbling frequency, which is a function of the CO2-dissolved concentration, is made possible by changing the time step during the calculation.
The radius R of a bubble increases with time at a constant growth rate
Thus, R(t) = R0 + kt, where R0 is the bubble radius as it detaches from the nucleation site.
The semiempirical growth rate (k, expressed in μm/s) of bubbles rising in champagne was linked with some physicochemical properties of liquids as follows [19]:

The bubbles diameter depends on several parameters, including both the distance traveled by the bubble, denoted by h, and the dissolved CO2 concentration, denoted by C L which continuously decreases with time (as a result of bubbling). Recently, the rate at which the dissolved CO2 concentration decreases as time proceeds after pouring champagne into a flute etched on its bottom was experimentally determined for three distinct champagne temperatures (namely, 4, 12, and 20°C) [31]. As illustrated in Figure 4, the rate at which the dissolved CO2 concentrations escape from champagne is strongly temperature dependent. For more details about the determination of Figure 4, see the article by Liger-Belair et al. [31] and references therein.

Evolution of the rate of dissolved carbon dioxide according to time in a champagne flute for the three service temperatures. The values have been experimentally measured with the same glass and the same filling level, throughout the 30 minutes following the pouring process of the glass.
The law governing the change in radius R of a bubble is as follows [19]:

where α is a numerical coefficient that depends on the fluid in question, estimated to be 0.7 in the case of sparkling wines [19].
The bubbles velocity u

This factor accounts the rigidity of the bubble and thus the braking effect due to the presence of surfactant molecules on the surface of bubbles. It will be smaller if the bubble is made rigid by a thick shield of surfactant molecules.
The mass flow rate Q m (kg/s) is defined by

The CO2-dissolved concentration C L decreases continuously over time once the wine is poured into the glass (Figure 4). This parameter also varies with the temperature. In this study, we have used the champagne physicochemical parameters for the three wines temperatures (Table 1).
Physicochemical parameters of champagne wine for the three service temperatures.

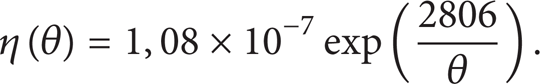
The fluid viscosity varies in a significant way with the temperature; it tends to decrease when the temperature increases. The dependence of the viscosity of the champagne with the temperature follows an Arrhenius-like equation [7]:
The temperature appears in (16), directly in the termθ5/9, but it is also included in Henry's coefficient k H as well as in the viscosity η, which both depend on the temperature. Henry's constant depends strongly on some gas and on some liquid considered, as well as on the temperature. The dependence of Henry's constant on the temperature follows a law described by the equation of Van't Hoff:

The effects on the bubble growth and on the upward bubbles dynamics are intrinsically connected to the variations of the physico-chemical parameters varying from a temperature to the other one (Table 1). Once (16) solved, we show that the influence of the temperature on the bubbles size is weak. Thanks to the influence of the viscosity and Henry's constant (Table 1), it is worth noting that increasing the temperature of a champagne of about 10°C (from 278° to 288°K) leads to increase of the bubbles size from 5 to 6% (which is totally undetectable in the naked eye). On the contrary, the temperature will have a significant influence on the viscosity of the liquid phase, varying in important way (42% between 4° and 20°). The velocity of the liquid phase, and therefore the mixing mechanisms of the wine, are conditioned by the unsteady evolution of the gaseous phase. Let us call back besides that the evolution of the rate of dissolved carbon dioxide differs for the three champagne temperatures (Figure 4).
3. Results and Discussion
We are going to present the numerical results (diameter and velocities of bubbles and velocity isocontours for the liquid phase) for three champagne temperatures (4°, 12°, and 20°). We will study the influence of these parameters on the liquid phase for 3 moments (60, 180, and 300 s) after the pouring process.
3.1. Ascending Bubbles' Dynamics
During its ascent towards the surface, the bubble grows by accumulating progressively the CO2 dissolved in the wine. The Figure 5 shows the unsteady evolution of the bubbles diameter in the case of a 4° service temperature. One may notice clearly a progressive decrease of the bubbles' size according to time. This is due to the progressive decrease with time of dissolved carbon dioxide in the liquid phase (as shown in Figure 4).
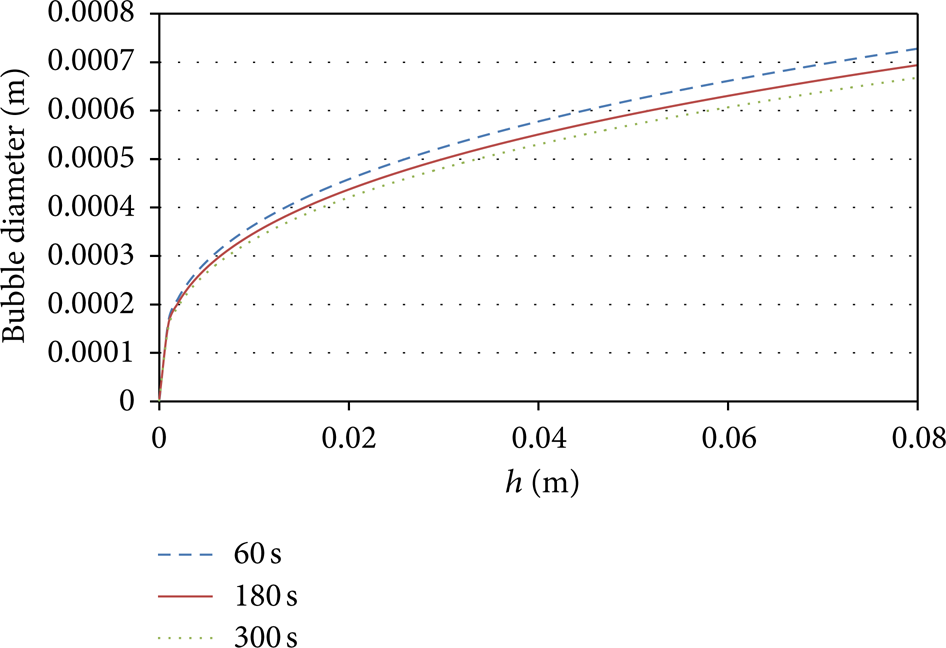
Evolution of the diameter according to the height h for a given champagne temperature of 4°C.
Moreover, because bubbles increase in size while rising toward the champagne surface, bubbles accelerate, as illustrated in Figure 6. Besides, it is worth noting in Figure 6 that the bubbles' velocity decreases with time, due to the progressive decrease of carbon dioxide dissolved in the liquid phase. Once again, the temperature will influence the upward dynamics of bubbles via the temperature dependence of the viscosity of the liquid phase.

Evolution of the bubble velocity according to the height h for a given champagne temperature of 4°C.
3.2. Temperature Dependence of Ascending Bubble-Driven Flow Patterns Dynamics
A strong hypothesis in the tasting of the champagne wine is that there is a relation between the convection movements in the wine and the gaseous and aromatic exchanges which are very important in the gustative perception. During this study, we are going to show the impact of the temperature on the dynamics of mixing mechanisms of the wine.
Figure 7 represents the streamlines of the liquid phase for three champagne temperatures, 60 s after the pouring process. One may observe that the vortex core goes away from the axis of the flute when the temperature and the velocity increase. We can already note a dependence of bubble-driven flow patterns velocities and overall dynamics on the champagne temperature.

Evolution of the location of the vortex cores at 60 s following the pouring process and for three service temperatures (a), detail on the upper part of the glass (b).
Both the progressive increases of ascending bubbles' diameters, and bubbles' velocities are presented in Figures 8 and 9, for the three various champagne temperatures, 60 s after pouring champagne into the flute.

Bubbles' diameters in the bubble column, 60 s after the pouring process, and for the three champagne temperatures.

Bubbles' ascending velocities, 60 s after the pouring process, and for the three champagne temperatures.
By observing Figure 8, it is worth noting that bubbles' diameters are very close to each other, whatever the champagne temperature. More important differences are nevertheless observed concerning the bubbles' velocities, as shown in Figure 9. This is due to the temperature dependence of the liquid phase viscosity (see Table 1) which contributes to the bubbles' velocity, as shown in (17). Generally speaking, the higher the temperature is, the higher the bubble velocity is. Because the liquid phase is driven by ascending bubbles (through viscous effects), the dynamics of the flow patterns found in the flute are therefore expected to be strongly temperature dependent. As expected, the higher the champagne temperature is, the higher the velocity of bubble-driven flow patterns found in the liquid phase is, as illustrated in Figure 10 (60 s after pouring). The same trend has been observed 180 (Figure 11) and 300 s (Figure 12) after pouring for the three champagne temperatures, but with overall velocities progressively lowering as time proceeds (mainly because both ascending bubbles' diameters and velocities decrease with time due to the progressive loss of dissolved carbon dioxide found in the liquid phase).

Flow patterns velocity magnitude, 60 s after the pouring process, and for the three champagne temperatures.

Flow patterns velocity magnitude, 180 s after the pouring process, and for the three champagne temperatures.

Flow patterns velocity magnitude, 300 s after the pouring process, and for the three champagne temperatures.
4. Conclusion
In this paper, a numerical modeling of bubble-driven flow patterns found in a glass of champagne has been carried out for three champagne temperatures (4, 12, and 20°C) using the finite-volume method by CFD (computational fluid dynamics). The results, for both the gaseous phase (ascending bubbles) and the liquid phase (bubble-driven flow patterns), were systematically compared at several moments following the pouring process. Because ascending bubbles velocities strongly depend on the champagne temperature, the velocities of ascending bubble-driven flow patterns were found to logically vary with the champagne temperature. The champagne viscosity, which strongly depends on its temperature, plays a crucial role in the temperature dependence of ascending bubble-driven flow patterns. As expected, the higher the champagne temperature, the higher the velocities of the liquid phase. In a near future, these numerical results are expected to be confirmed by PIV experiments. Moreover, since a correlation is strongly suspected between ascending bubble-driven flow patterns and the release of aromatic volatile compoundsfrom champagne, further investigations are to be conducted together with sensory analysis experiments.