
Abstract
Combining particle filter (PF) with sample entropy feature of discharge voltage, a method of remaining capacity estimation for lithium-ion battery is proposed. The sample entropy calculated from discharge voltage curve can serve as an indicator for assessing the condition of battery. Under a certain working condition, a functional relationship between sample entropy and discharge capacity is created and estimations computed from the function are taken as observations to propagate particles in PF. The results indicate that the algorithm enhances the accuracy. Due to the establishment of functions at different discharge rates and temperature modification, prognostic accuracy of discharge capacity has been improved under multi-operating working conditions.
1. Introduction
With the rapid development of industrial technology, the exploration and utilization of new energy have been in urgent need. Electric vehicle occupies a pivotal position in new energy automobile. Battery management system (BMS) is specially designed to improve efficient utilization, to prevent overcharge or overdischarge, to prolong the service life, and to monitor the state of the battery. A more sophisticated prognostic of battery health state is much needed for high requirements of reliability, stability, and security of batteries. Consequently, the prediction of remaining battery life is considered as one of the promising research fields. Numerous papers have reported the studies on state of charge (SOC) and state of health (SOH) which are the focus of battery Prognostic and Health Management (PHM).
Battery discharge capacity reaching its criteria without any omen leads to a disastrous failure in some cases. The accurate prediction of remaining useful life (RUL) of battery is essential for long-time efficient use. The causes of capacity fading are internal factors such as anodic and cathodic active material changes and SEI membrane incrassation [1, 2]. Accurate battery SOC estimation is of great significance to battery electric vehicles and hybrid electric vehicles. SOC estimation aims at the management of energy flows of electric vehicles and avoiding battery overcharge or undercharge. Lee et al. [3] proposed an Extended Kalman Filter (EKF) method along with a measurement noise model and data rejection of lithium-ion battery SOC estimation. The proposed algorithm and model approach were verified through several experiments. An adaptive unscented Kalman filtering method to estimate SOC of lithium-ion battery was presented [4]. The proposed SOC estimation method had a better accuracy compared with previous works. Lee et al. [5] estimated the SOC and the capacity of a lithium-ion battery with a modified OCV-SOC model. The method overcame the variation in conventional OCV-SOC.
Methods of battery capacity estimation are proposed based on the following two ideas. One method is feature-based. In one sense, as variations of voltage, current, and temperature characteristic curves could reflect the battery aging processes or internal resistance variations, some characters are often extracted from them. Salkind et al. [6] proposed a practical method that resistances obtained by electrochemical impedance spectroscopy (EIS) measurement and coulomb counting techniques were employed in predicting SOC and SOH. The advantage of the work was that there was no need to know previous discharge or cycling history. Gomez et al. [7] made a detailed analysis on EIS and pointed out that aging information could be extracted from the parameters of EIS equivalent circuit model. Pincus [8] firstly introduced the concept of approximate entropy mainly to compute the complexity of time series. Widodo et al. [9] took sample entropy features obtained from discharge voltage curves as inputs of support vector machine (SVM) and relevance vector machine (RVM) for SOH prediction. The results showed that the method proposed was plausible.
The other is model-based. Generally, fault feature is closely related to the parameters of the model. Correction and adjustment of model parameters can enhance the prediction accuracy. The model-based techniques contribute to an in-depth understanding of the mechanism and have the advantage of real-time fault prediction. A model of battery system state is established to describe the discharge behavior or battery health state. Abbas et al. [10] introduced an integrated methodology based on both physics of failure models and Bayesian estimation methods for prognosis of electrical components. An empirical formula was proposed to depict discharging behavior of lithium-ion batteries [11–13]. Simulation results indicated that PF algorithm was appropriate for the prediction of battery health state. Saha et al. [14] presented several algorithms including ARIMA, RVM, EKF, and PF. A RVM-PF framework had significant advantages over the conventional methods of RUL estimation like ARIMA and EKF.
Some researchers have also established electrochemical numerical model and thermal model for the study on battery internal characteristics. Porous electrode model with liquid electrolyte was proposed by West et al. [15]. That electrolyte depletion was the primary limiting factor of capacity was demonstrated. Park et al. [16] presented an electrochemical heat conduction phenomenal model. A better understanding of conduction phenomena of lithium-ion batteries was presented. Kim et al. [17] extended one-dimensional modeling approach to three dimensions to capture geometrical features such as shapes and dimensions of cell components, to simulate oven tests and to determine how a local hot spot can propagate through the cell. Though some key behaviors of battery cells can be captured in these models, it is complex to deploy a large number of unknown parameters due to the memory and computation. Lumped battery models are likely to be the preferred choice with a relatively fewer parameters. A systematic comparative study of twelve lumped battery models was conducted [18]. The developed cell voltage models could be used in SOC estimation in BMS.
This work is conducted by the combination of the two ideas mentioned above. In the following section, we firstly introduce the theory about sample entropy and basic utilization of particle filter in terms of prognostics of lithium-ion battery RUL. Then, we present the detailed prediction procedure.
2. Theory and Intelligent Prognostic Method
2.1. Sample Entropy
Sample entropy is defined as generation rate of new information by Richman and Moorman [19] for the calculation of complexity of time series. It can be expressed as SampEn (m, r, N), where N is a given total number of data, r is the tolerance for accepting matrices, and m is the dimension of vectors. The specific algorithm of sample entropy is as follows. For a given series
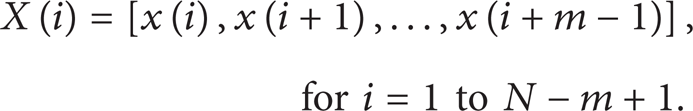
The distance between vectors X(i) and X(j) is defined as
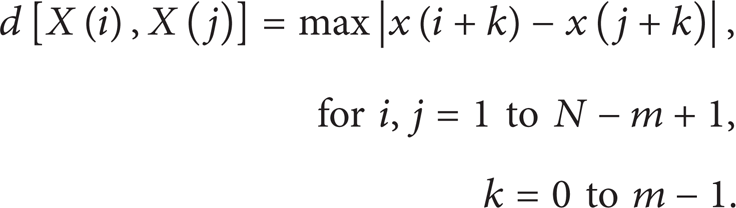
For a given r, calculate the number when d[X(i), X(j)] < r, for i ≠ j, and define the function

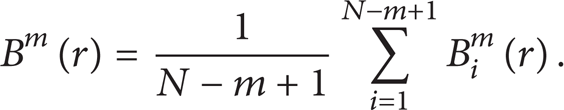
Then, take the average of B i m (r). The result is expressed as
Similarly, replace m with m + 1 and repeat the steps from the beginning. Afterwards, we can determine the two values

The value of SampEn (m, r, N) is closely correlated with m, r, and N. Thus, the proper selected parameters could result in more reasonable statistical properties.
2.2. Particle Filter
PF is a Bayesian learning technique using Monte Carlo simulations. The idea is to describe the system state as a probability density function (PDF) approximated by particles that are generated from a priori distribution and updated from observations through a measurement model. Model parameters are included as a part of the state vector to be tracked [11]. PF framework can be applied to RUL prediction of battery due to its good state tracking performance.
Actual discharge capacity is associated with many factors. It is obvious that charging directly determines the discharge capacity in one cycle. Besides, reaction products forming up around the electrodes will decompose during rest or relaxation period, which lead to the increase of available capacity in next cycle. Primarily, considering the main influence factors of battery capacity, the following state equations are cast to describe the model as follows:


where k is cycle index, C k denotes the charge capacity, ΔT k is the relaxation period between the two adjacent cycles, Ck + 1 is the discharge capacity, β1, β2, and β3 are parameters of the state equation, and v1, v2, and v3 are independent zero-mean Gaussian noise terms.
Saha and Goebel [11] established a measurement model and regarded charging capacity as the observation to propagate particles. A reasonable observation for measuring the weights of particles and selectively propagating them plays an important role in prediction accuracy. In the case of our application, via the fitting method, a functional relationship of sample entropy and discharge capacity is established to obtain an appropriate observation. Particularly, sample entropy is calculated from the discharge voltage curve of the cycle number k. The corresponding output of the function is used as the observation in cycle k + 1. It is worth mentioning that there is no need to take other experiments to obtain such features, for the discharge voltage curves can be easily obtained during the monitoring in each cycle.
2.3. Intelligent Prognostic Method
The procedure comprises the following.
Data collection is as follows.
Extract battery discharge voltage curves from training data and the selected parameters m and r are 2 and 0.1, respectively. The functional relationship of discharge capacity and sample entropy is created under the current operating condition. Gain discharge current curves, charging capacity, and relaxation time of adjacent discharge cycles from validation test data. In addition, some historical capacity data are also needed.
Particle filter initialization is as follows.
Set the starting prediction point T in proportion to the number of historical capacity data.
Obtain initial parameters β i (i = 1, 2, 3) via fitting.
500 initial particles are generated with values obtained in (2)-(b) and the variances of noise term v i (i = 1, 2, 3) are about 10,000 times smaller than β.
Prediction is as follows.
Particles {x k i }i = 1 N are updated by (7) and the priori discharge capacity values in cycle k + 1 are calculated through those updated particles {xk + 1 i }i = 1 N .
Take sample entropy feature as the input of the function and compute the weight of each particle per deviation between the calculated observation and previous discharge voltage value. Normalize the very particles using the following formula:

Through the method of random sampling, each particle {xk + 1
i
}i = 1
N
is copied or abandoned selectively according to its weight and then new sample
The average of the sample
Repeat the step from (3)-(a) to (3)-(d) until the capacity reaches its criterion which is a 30% fading of rated capacity.
3. Experiment Data
The full set of aging data collected from commercially available 18650-size lithium-ion cells provided by NASA Ames Prognostics Center of Excellence was taken as object of study. Battery anode and cathode materials are mostly LiNi0.8Co0.15Al0.05O2 and MAG-10 graphite, respectively. The electrolyte is 1.2 M LiPF6 in EC: EMC (3: 7 wt%) and the separator is 25 μm thick PE.
All testing batteries were run through different working profiles (charge, discharge, and impedance). Batteries No. 6 and No. 18 were tested by the following steps: (1) charging was carried out in a constant current mode at 1.5 A until the battery voltage reached 4.2 V, (2) a constant voltage mode was then in operation until the charge current dropped to 20 mA, (3) batteries were put aside for a period of time, (4) impedance measurement was implemented with an electrochemical impedance spectroscopy frequency sweep from 0.1 Hz to 5 kHz, (5) at 24°C, discharging was carried out at a constant current level of 2 A until the battery voltage fell to 2.5 V, (6) the same step as (3), and (7) the same step as (4). Repeated charging and discharging resulted in an accelerated aging process. The experiments were stopped when the batteries reached the end-of-life criteria which was a 30% fading in rated capacity (from 2 Ahr to 1.4 Ahr).
4. Results and Discussion
4.1. Single Working Condition
Figure 1 depicts the discharge voltage curves in different cycles. At a constant current of 2 A, the voltage drops from 4.2 V to 2.6 V. Obviously, the curves vary from cycle to cycle in the aging processes. It can be seen from Figure 1 that the lowest voltage point bounces back instantly at the end of discharge and subsequently rises slowly until it comes to a stop. The two arrows point out the processes mentioned above. Observing the definition of sample entropy, we can find that when the maximum distance computed from the adjacent vectors constituted by the sequential samples is greater than r, the complexity number of the corresponding vector in (3) will not change in statistical calculations. Otherwise, if the noise signal is added to the samples with larger amplitude, it will be ignored by detection, for the distance between the disturbed vectors is longer than others. In that sense, sample entropy could capture the features of voltage variance in a constant current mode.

Battery voltage curves in different cycles and the two voltage variation processes were pointed out by the arrows.
As battery is aging gradually during the usage period, we find an interesting connection between the sample entropy feature and the discharge capacity. In consequence, sample entropy could serve as an indicator for assessing the condition of battery. With training data of battery No. 18, a cubic polynomial fitting is introduced to find out the functional relationship between them. When the parameter m and r are deployed to 2 and 0.1, respectively, a better fitting effect is obtained with a reasonable statistical result.
The starting point T and predicting length are 25 and 115. Figures 2 and 3 show the prediction result of battery No. 6 and its errors. From the actual discharge capacity curve, it is evident that battery No. 6 has faded to its limit 1.405 Ahr when it cycles at cycle number 108. Observing Figure 3, apart from several points, most relative errors are within 5%. The early prediction has higher precision and errors of some rebound points are less than 2%.

Prediction of battery No. 6.

Relative errors.
To illustrate the superiority of this work compared with Saha and Goebel [11], Figure 4 shows the comparative prediction result.

Comparative simulation results through different methods.
As is showed in Figure 4, some key points of prediction are pointed out by seven arrows on the graph and the contrastive prediction apparently engenders a greater error. Prediction accuracy is measured by the root-mean-squared (RMS) error and peak error. The statistical figures reveal that RMS errors of both predictions are 8.64% and 4.30%, respectively, and the peak errors are 37.86% and 8.28%.
The discharge capacity is not only directly related to charge capacity and rest time of adjacent cycles but is also affected by actual working conditions. When the forecasting and training conditions, such that ambient temperature and discharge rate are inconsistent, it can be easily expected that the estimation points will deviate from the actual ones in each cycle.
4.2. Multioperating Working Condition
Without knowing of aging mechanism, it is hard to make a specific illustration that how the aging process inside the battery is influenced by environmental factors. But, it is certain that as battery aging processes, different operational conditions accounts for the discharge capacity fading behaviors. It is required to update or revise the aforementioned function properly to satisfy the requirement of high accuracy when facing a multioperating working condition. The datasets provided by NASA only include several discharge rates. Thus, the paper builds three functions taking different C-rates under each ambient temperature into account summarized in Table 1, where x is sample entropy and F is the estimation capacity used as observation in algorithm PF in our method.
Capacity estimation functions under different optional conditions.

Suppose that the operating ambient temperature is 24°C. It is interesting to find that the relative mean deviations between estimation values and discharge capacities at actual temperature 4°C and 43°C are around −0.38 and 0.02. As a matter of fact, higher or lower temperature affects the actual discharge capacity. On account of the higher ambient temperature, the internal substances are more active resulting in a larger discharge capacity. On the contrary, the lower temperatures slow down the physicochemical reactions inside the battery leading to the fact that the actual capacity cannot reach the maximum. In a constant discharge current mode, it is reasonable and essential to modify the capacity observations in PF algorithm. Thus, according to the previous calculations, a functional relationship between ambient temperatures and estimation offsets is established through quadratic curve fitting. The fitting result is given in Figure 5.
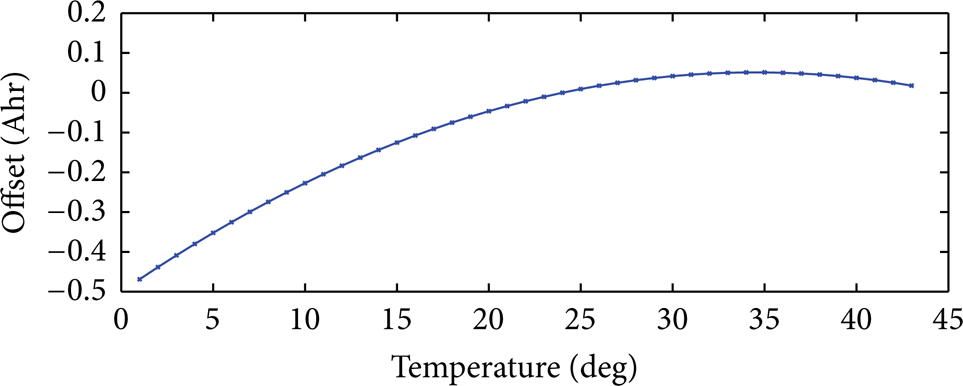
Offsets at different temperature.
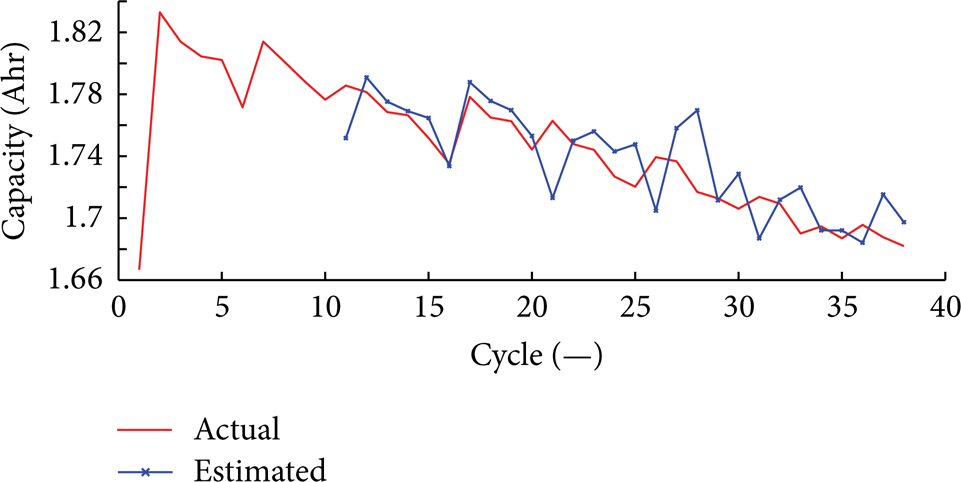
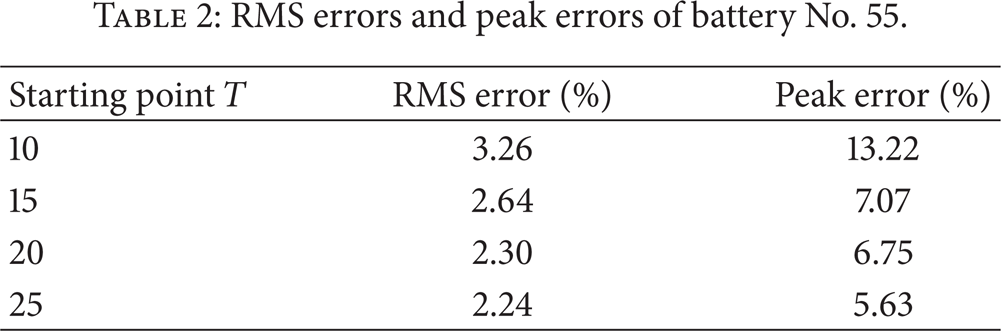
The selected offset benchmark is zero at 24°C. Figures 6 and 7 show the prediction results of battery No. 55 (4°C, 1C) and No. 31 (43°C, 2C). Both two offsets are separately −0.38 and 0.02. As is expected, the prediction curves are basically consistent with the actual ones.

Prediction of battery No. 55.
Prediction of battery No. 31.
Tables 2 and 3 show the RMS errors and peak errors at different prediction starting points. The results indicate that as the number of historical capacity data is increasing, errors have the downward trends.
RMS errors and peak errors of battery No. 55.
RMS errors and peak errors of battery No. 31.

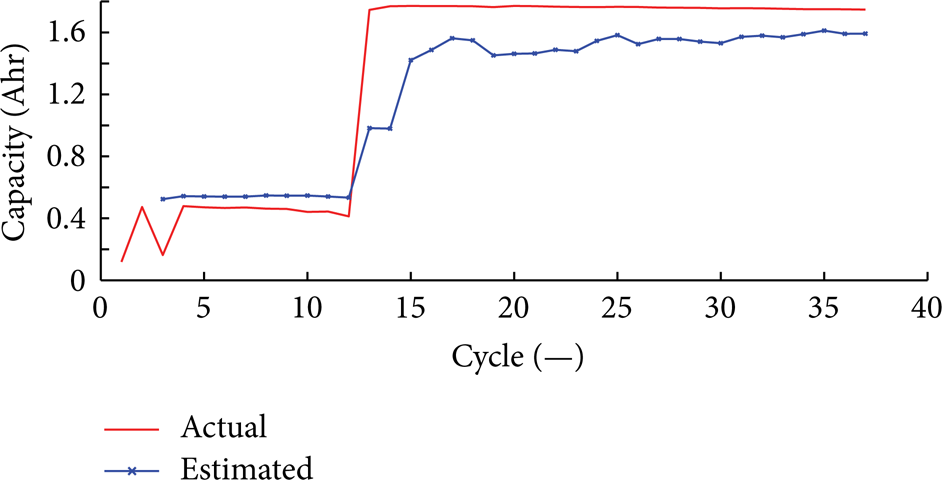
Battery No. 39 is tested under a multioperating working condition. The first several discharge cycles are tested at 24°C, 2C and the others at 44°C, 0.5C. The corresponding capacity estimation function should be selected in accordance with the operating condition. As one of the relevant functions is built at 4°C, 0.5C, the actual offset at 44°C should be increased to 0.398 rather than 0.018 in Figure 5. The prediction result of battery No. 39 is presented in Figure 8 and the RMS error is 5.78%.

Prediction of battery No. 39.
Figure 9 shows the contrastive prediction result. Without the consideration of C-rate and ambient temperature, the estimation performs much worse with 27.56% RMS error.
Comparative prediction.
A large amount of discharge datasets will be required mainly for establishment of a set of capacity estimation functions. The choice of a proper function in accordance with the working condition is necessary for the implement of algorithm. Otherwise, it takes about a period of 200 ms proportional to the number of estimation points to complete prediction for each cycle.
5. Conclusions
This paper focuses on developing an intelligent prediction method of battery capacity through particle filter and sample entropy. Under a certain optional condition, a functional relationship of sample entropy and discharge capacity is created. The estimations computed from the function are taken as observations to propagate particles in PF. When facing a multioperating working condition, this paper builds three functions considering different C-rates under different ambient temperatures. It is a key point to select a corresponding capacity estimation function and to modify the observation by temperature. On account of good tracking capabilities, PF algorithm is applied to determine the unknown parameters and fulfill the prediction with better statistical calculations. The prediction result can reflect the capacity fading behaviors and has a higher accuracy with not more than 5% RMS error of battery No. 6. Compared with other methods, prognostic accuracy has been greatly improved under a large range of cycling conditions with less than 6% RMS error.
In addition, though the prediction results have been satisfactory, there still leaves considerable room for improvements. Our method is not fit for practical application now, for the ambient temperature and C-rates are constants in one cycle in our work. When facing a dynamic cycle, such as a complex current, its impact on capacity could be equivalently seen as a constant one, which seems to be a considerable solution. With an improving understanding of these impacts on battery capacity, the prognostic performance can be further refined.
Conflict of Interests
The authors declare that there is no conflict of interests regarding the publication of this paper.
Footnotes
Acknowledgments
This research is financially supported by the National Natural Science Foundation of China (no. 51107021) and the Fundamental Research Funds for the Central Universities (Grant no. HIT. NSRIF. 2014021). We sincerely appreciate the significant help on translation by Miss. Han Wang.