
Abstract
We research into the upstream sections of off-street parking access in the city. When the parking car turns right from the main road of the rightest lanes into the access, the vehicles which are the upstream of the access on the main road may be affected and the influence length can be presented as two parts: one is the deceleration distance of the parking car and the other is the propagation distance of traffic wave caused by the following vehicles. By the way of theoretical analysis and field investigation, we present a model that represents the dynamic influence length under the condition of different entering time and moderate saturation. Parameters were specialized to represent the characters of parking car and the vehicles following it, including park entering time and speed variation rate. Some conclusions were drawn by contrasting the simulation of VISSIM 5.3 and the model. First, when entering time was between 4 s to 8 s, saturation and the influence length were in inverse proportion; while the entering time was more than 8 s, saturation and the influence length were in direct proportion. Second, when the saturation was between 0.46 and −0.5 and entering time was between 4 s and 15 s, parking car had no effect on the vehicles. Third, when the saturation was more than 0.6 and entering time was more than 9 s, the effect of parking car on the vehicle's influential length increased significantly.
1. Introduction
It is a common problem of the vast number of cities that vehicle's parking will cause certain influence on traffic of the main road. Parking facilities, according to the difference of the spatial location, can be divided into two types; one is on-street parking and the other is off-street parking. Impact on the dynamic traffic of off-street parking car mainly embodied the influence of the vehicles while the car drives into or out of the access of main road. In order to find the law of the off-street parking which influence the vehicles on the main road, the paper will analyze the different step of the parking and establish the equation by the method of experiment and theory. Car to be driven out generally needs to be completed by waiting for an appropriate gap on the main road, as it is influenced by the main road traffic severely, while relative to the behaviour of driving out, the process of driving into affects main road traffic stream more seriously.
It is a common mode that the car drives into the off-street parking access by the way of right-turn. The process can be divided into three stages: deceleration, turning around, and entering, and it is shown in Figure 1. Deceleration of car will generate a certain safe braking distance, while turning around and entering will lead the vehicles following the car to decelerate or follow. Thus it can be seen that car's entering will bring about a certain influence length on main road traffic stream while it will change dynamically due to the changes of the initial deceleration speed, turning around, and entering time. Too long entering time is likely to cause the upstream vehicles of the main road queue and form congestion or even extend to the upstream intersection in a short period of time.
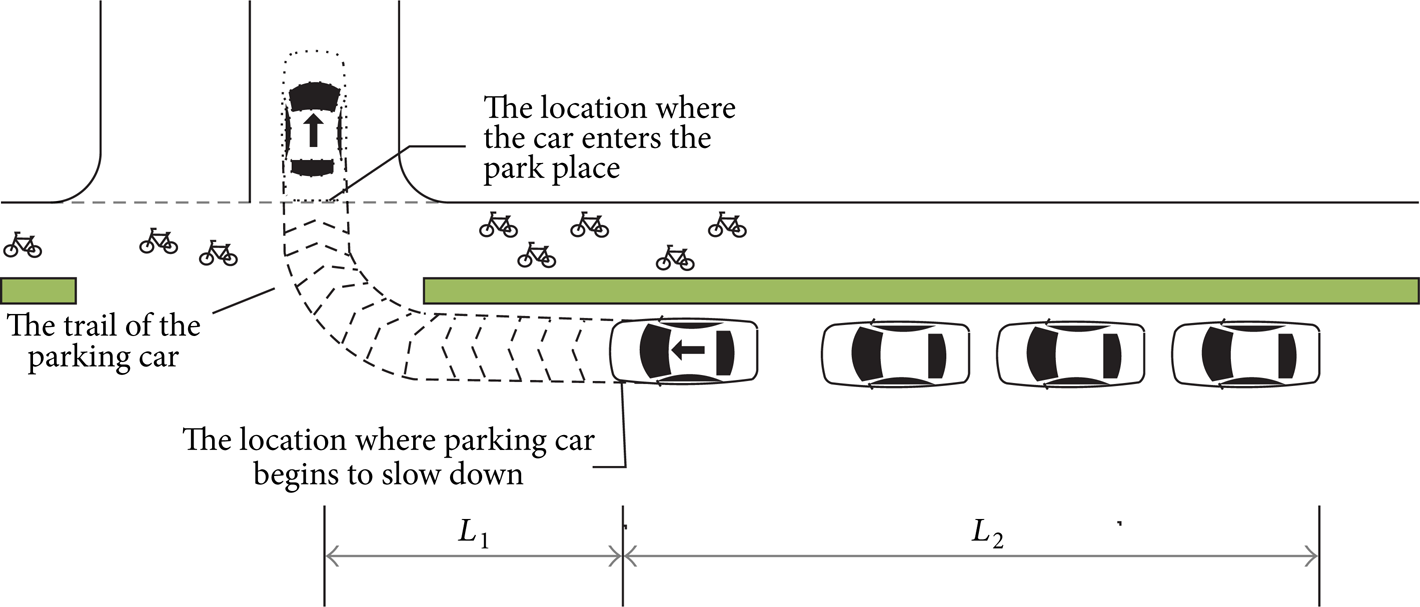
Dynamic influence diagram of the entering process.
Little research has explored these issues. Thus, it is very necessary to take a close and an in-depth review to research into the variation of the influence length affected by the entering process of right-turn car at the off-street parking access. The result of research would optimize the traffic organization and avoid mutual interference between the vehicles on the main road.
Less studies can be found at state level, while similar studies mainly embodies on the urban intersection and bus stop site. According to intersections, the US AM [1] manual proposed the concepts of upstream functional area and downstream functional area. In addition, different lengths of the functional area were given due to different design speed. Functional characteristics and the legal requirements of the access were discussed by the Access Management handbook [2] and the Access Management Guidebook [3]. Different effects of the functional area due to the access management were discussed by NCHRP Report 395 [4], NCHRP Report 420 [5], and NCHRP Report 548 [6].
However, the result cannot be used directly in China by the reason of different type of road and traffic condition. Juan [7] studied the influence length caused by the parking car, but the research only consisted of the part of deceleration without considering the impact of the upstream vehicles.
All the results above have provided a good reference. However, there are still some inadequate, because of the different research objects and emphases. For instance, ignoring the upstream traffic flow's speed changes based on different bus proportion and saturation, paying no attention to the differences caused by the different time headway between off-street parking car and the first vehicle on main road upstream. No consideration is given to the dynamic characteristics of influence length while the entering time and main road flow saturation vary.
This paper analyzes the characteristics of the off-street parking car and the traffic flow upstream on the main road's access. And then, changes in entering time of the car, influence time, and length of the vehicles are addressed in the discussion of impact on the vehicles upstream of the access. Furthermore, we present a model that represents the dynamic influence length under the condition of different entering time and moderate saturation.
2. The Model of the Dynamic Influence Length
While the car drives into the off-street parking access from main road, if the main road traffic is free flow, then the interference between the car and the traffic flow upstream of the access would be very small. But, when the main stream is nonfree flow or forced flow, upstream vehicles' operation is mainly limited by the constraints between the vehicles. Therefore, the two cases above are not considered and the impact on the upstream vehicles in the condition of steady flow on the main road is the primary research direction. Referring to the literature [8], the corresponding saturation values were determined as 0.46−0.87.
Considering the main road traffic characteristics, in order to reduce the complexity of research process and establish the basic research model, this paper gives the following assumptions. First, the number of the lanes about the main road in a direction is more than three and the behaviour of change lane is out of consideration; second, the composition of the main road traffic flow is cars and buses; third, the distance between off-street parking access and the downstream intersection is long enough; meanwhile traffic stream on the main road behaves in the consistent way, which would not be affected by queuing.
Focus on the analysis of the car's entering process on the influence of the main road upstream traffic, so this paper does not consider the downstream of the main road which would affect the car.
2.1. The Establishment of Basic Model
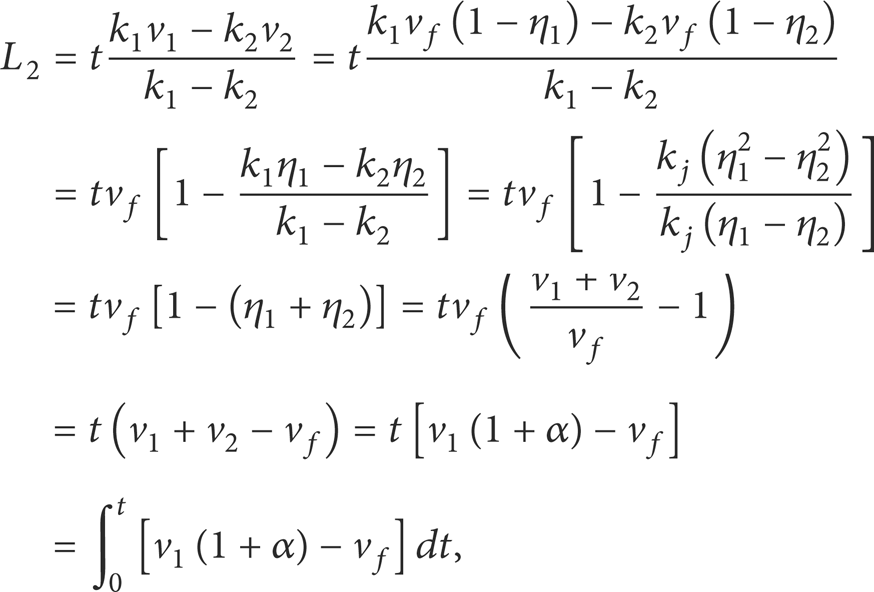
According to the three stages of the car, which are deceleration, turning around, and entering, the upstream vehicles' influence length was presented as two parts, which are the travel distance due to deceleration to the parking access L1 and the traffic wave propagation distance caused by the car following vehicles L2. Therefore the influence length L can be described as
where L1 is the affected length caused by safety braking distance, which is presented as

where v1 is the initial speed before the deceleration of car; v1′ is the speed after the deceleration of car; α is the average deceleration of the car from main road to off-street parking facility. Based on the literature [9], deceleration rate is in the range between 2 and 2.6 m/s2, and L2 is traffic wave propagation distance caused by the braking of car.
When the arrival of adjacent vehicles in the traffic stream is not discrete, independent, but affect each other back and forth, then traffic wave theory would be utilized to describe the characteristics of traffic flow [10–12]. When the entering car has an impact on the upstream traffic on the main road, the speed of the upstream vehicles would be reduced and backward propagating waves would emerge. Process of traffic wave propagation is shown in Figure 2.
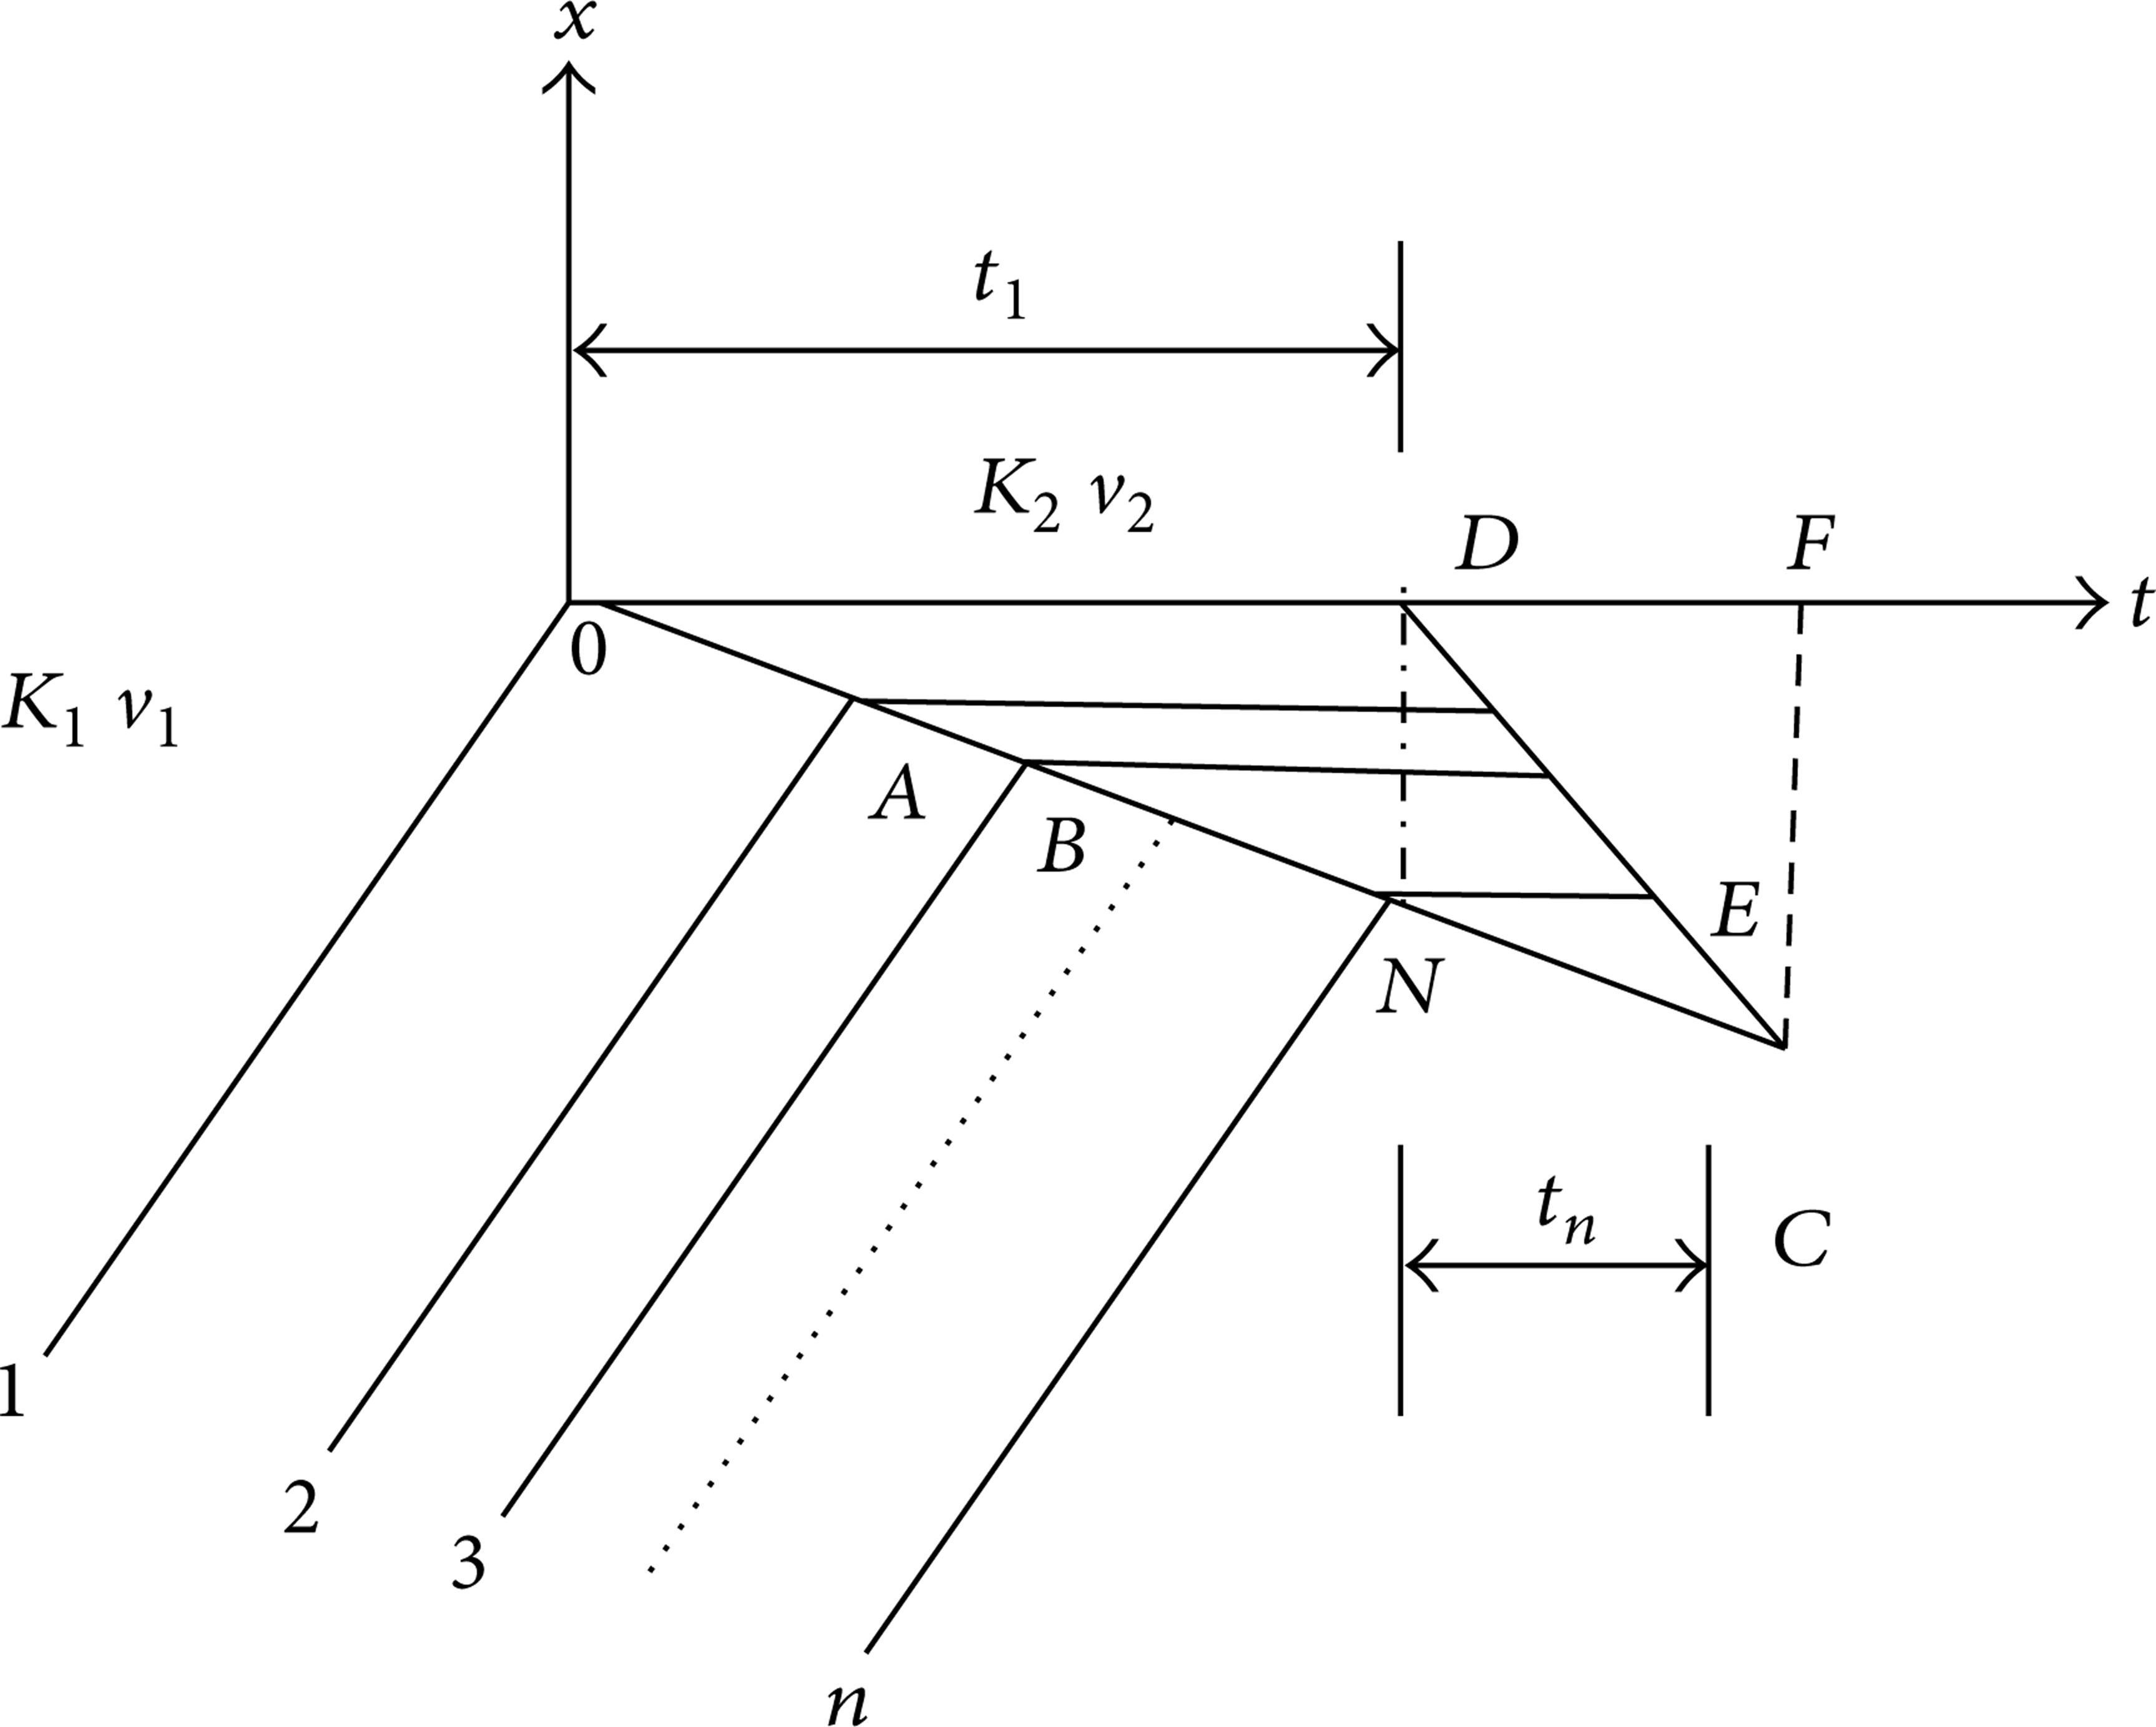
Parking wave propagation diagram.
We can assume that the density and speed before the traffic state changes are k1 and v1, while due to the influence of the car's park, density will change to k2, and the speed will be v2.
State of the vehicles can be expressed by variation regulation of its position x with the time t. x is the travel direction; set the leaving vehicles' deceleration starting moment as the zero moment; the corresponding position for zero position, namely, coordinate point 0, is the speed change point of leaving vehicles. Then the first following vehicle slows down; it begins to decelerate after the location of the 0 point, represented by A in Figure 2. Then the second car begins to slow down at the position more back, indicated by point B in Figure 2; the subsequent vehicles can be marked in turn.
Stop wave is produced in 0 position, and then spreads to the A point of the first vehicle and finally from A position spreads to B position of the second vehicle, in turn backward propagation. OD is the duration of the wave, at D moment; the suspended vehicles leave the motor vehicle lanes while the vehicles which arrive finally still need to stop for waiting.
Straight line DE shows the dynamic trajectory of starting wave, while the car has entered the access of off-street parking N is change point of the speed which the traffic wave propagation to the last car (it means that dissipation ends). Assume that t represents the impact time of leaving vehicles. The straight line OAB in Figure 2 displays the traffic wave's dynamic trajectory due to parking. Its slope is the wave velocity U w . Wave propagation distance is computed as follows:

Based on traffic flow theory, it is known that utilizing Greenshields model to fit the relationship between speed and density is more appropriate under the condition of moderate traffic density [13]. Then when
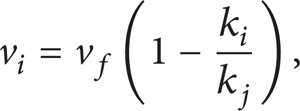
and
where t is the impact time on the main road upstream vehicles, which is caused by the deceleration, turning around, and entering behavior at the off-street lots' entrances and α is speed variation coefficient, which is shown as follows:
2.2. Analysis of Main Parameters
The model mentioned above is the basic formula, so it lacks the detail to analyze the parameters; for example, the dynamic influence length would be changed by the condition of different saturation ratio. What is more, the values of mean speed, entering influence time, and speed changing coefficient are unclear. So the model cannot be used directly. It is necessary to make further analysis of the three parameters and determine their calculation methods and applicable conditions.
2.2.1. Mean Speed of Upstream on the Main Road v1
In order to avoid the complexity of model, this paper makes an assumption that the driving states of main road upstream vehicles are consistent without consideration of the differences between individual vehicle speeds. Therefore, it can use road impedance function model to express driving speed under different main road volumes, such as classical BPR model used by United States Federal Highway Bureau [14].
It is well known that the traffic flow's average speed is affected not only by the volume of the vehicles but also by the composition type of the vehicles. So this paper considers the car and the bus as the main composition on the main road. Furthermore, different proportion of the two types of vehicles would lead to different speed, even on the same section and traffic load condition. So the proportion of bus must be taken into account when establishing BPR model. Through the analysis of observation datum on Zhongshan north road and Beijing west road in Nanjing and combining with [15] unidirectional three lanes, the BPR model is given as

where v f is free flow speed of unidirectional three lanes main road; q/c is saturation ratio; η is the proportion of bus between 0.1 and 0.5; v1 is average travel speed of unidirectional three lanes on main road when the volume is q and the proportion of bus is η.
2.2.2. Entering Time t
Entering time means the parking car's interference time on main upstream vehicles in the process of decelerating, turning and entering at the parking lots' entrance. Define the time from the entering when car begins to decelerate until it leaves the main road where entering time is Tin, and the headway between it and the main upstream first vehicle when decelerating is t1, headways of upstream following second vehicle and subsequent ones separately are t2, t3, …, t n . Because of the assumption that the driving states of main road upstream vehicles are consistent, t2 = t3 = · t n . When Tin is small and t1 is large, entering car may not affect the traffic flow of main road; when Tin is large and t1 is small, the influence may exist. Therefore, while judging whether the entering car will affect main upstream, the position of parking car, main upstream vehicles in the entering process, and the relationship between Tin and t1 are necessary to be analyzed.
(1) Position of the Upstream Vehicles and Parking Car. Based on the foregoing, both the entering car's initial speed and upstream vehicles' mean speed are v1, when the parking car starts to decelerate, at the time of moment; the positions of main road vehicles are shown in Figure 3, where d1 is distance between parking car and first vehicle of the main upstream while decelerating, m, and d2 is distance from decelerating car to parking lot's entrance centerline, m.

Positions of vehicles when entering car decelerates.
By (2), we know that while parking cars are at off-street parking lot's entrance centerline, its speed is v1′, and the following ones' mean speeds are v2. The positions of vehicles at this time are shown in Figure 4, and it is the critical moment whether the parking car will affect the vehicles upstream of the access, where d3 is distance of first following vehicle travel in t1′ time at the speed of v1, m, t1′ is the time of the first following vehicle traveling at the speed of v1 to the parking lots entrance centerline, and d4 is the safety distance between the first following vehicle and the parking lots entrance centerline; usually the value is 2.5 to 5 m.

Positions of vehicles while parking car just driving out of main road.

where d1 = v1t1, t1 ∊ (h
t
, + ∞),
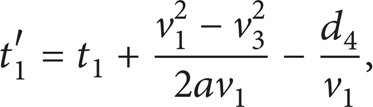
where the symbols are the same as what mentioned above. At that time, parking car just leaves the main road, and the vehicles were not affected anymore, so t1′ = tin.
(2) While t
in
is Small and t1 is Large. While t1 is large, it means that t1 > t2 · t
n
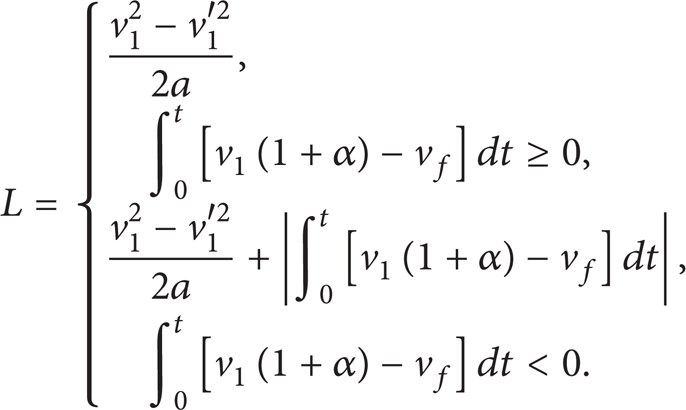
. Then d1 + d2 – d3 ≥ d4 is supposed which means the distance between main upstream first vehicle and parking lot center line is farther than expected while parking car travels out of the main road. At this time, vehicles upstream of the main road keep former driving state and parking car at the parking lot entrance has no effect on them, so v1 = v2; if influence area

When t1′ > tin,

where d4/v1 is the time vehicles driving at the speed of v1 during the expected safe distance, which is assumed to be tsafe. In ordinary conditions, it can be supposed that tsafe is the same as the average headway, which means that tsafe = h
t
. h
t
refers to average headway whose value is related to saturation;
where the symbols are the same as what mentioned above. Therefore, while
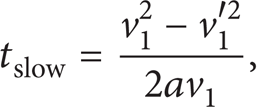
(3) While t in is Large and t1 is Small. When t1 > t2 · t n and t2 = t3 = · = t n = h t , it is assumed that d1 + d2 – d3 < d4, which means that the distance between main upstream first vehicle and parking lot center line is closer than expected while parking car leaves main road. At this moment, main vehicles upstream will be influenced by parking car and cannot keep the former state, so v1 > v2 and influence area L = L1 + L2. Then d3 = v1t1′, when t1′ < tin; from (9), we can conclude that

The condition which should be satisfied is h t < t1 < tin + h t – tslow. At this point the influence time of vehicles on main road is t = tin – t1′. The symbols are the same as mentioned previously.
When t2 = t3 = · = t n = h t and parking car decelerates, status of the vehicles following changes immediately. Now the average speed v2 < v1, so it can be concluded that the need to meet the condition is t1 = h t . At this point the influencing time of upstream main road vehicles is t = tin. t < tin is not considered in this paper.
In conclusion, the formula of the influence time and applicable conditions can be drawn as follows:

where the symbols are the same as mentioned previously.
2.2.3. Speed Variation Coefficient α
While the vehicles on main road vehicles were affected, the travel time of the vehicles during the influence area is t1; then

From (10), we can conclude that

Based on (16) analysis shows that when Tdelay → ∞, α → 0 and when Tdelay → 0, α → 1. So the value of α is (0, 1). If the entering time is longer, the change of speed will be bigger, and the influence on subsequent traffic will be greater; on the contrary, the influence will be less.
In order to research the relationship between time and speed variation coefficient, we select the Nanjing Zhongshan South Road, Xinjiekou-Huaihai sections, as the real-life case for investigation (Figure 5). The section is one-way three-lane road and the off-street parking entrances are located in the middle of the section. The frequency of parking cars' entry is high. The vehicles of main road are scarcely influenced by upstream and downstream intersections. The investigation mainly includes the entering time of each parking car, the number of the vehicles which change the speed, and the value of the variety speed in each time. It is found that there is a certain correlation between the two ones by the analysis of the data using the software SPSS 19.0, and the result is shown in Table 1.
Correlation of speed variation coefficient and entering influential time.

Significant correlation on the level of 0.01 (bilateral).

Fitting curve of α and t.
Therefore, statistic datum of α and t is fitted by using linear model, logarithmic model, quadratic model, and exponential distribution model, respectively. Statistical correlation test results are shown in Table 2. When entering influential time increases, α in linear model is monotonely decreasing.
Different model fitting.

It can be found that the fitting results of linear model, quadratic model, and exponential distribution model are better. Models are shown in Table 3.
Fitting equations of different models.
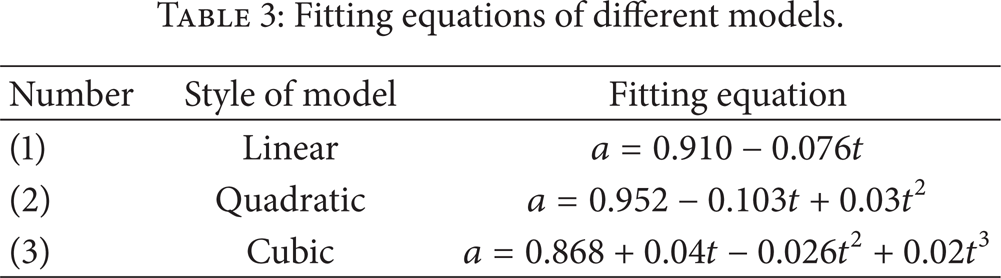
α in quadratic and cubic models presents a trend of first decrease and then increase. The analysis shows that when t increases and α decreases, which means the influential time is long, it will lead to the main road upstream vehicle following, even parking. Because this paper only considers the influence length of upstream formed by the parking process, so the influence length and the increasing speed of the vehicles on the main road caused by the dissipation of the traffic flow are out of consideration; then the linear model is suitable to be chosen. When α = 0, in the linear model, t is corresponding to threshold of influential time, which means when the value continues to increase, the speed of main upstream traffic at the start of queuing is 0, and the threshold is determined 12 s according to the observation data and the fitting model. When α is negative, its value is zero for vehicles' stopping and queuing states.
Calculate the relationship between velocity variation coefficient and entering influential time as follows:
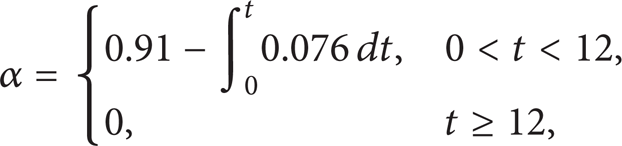
where t is the entering influential time.
2.3. Model of Dynamic Effect of the Length after Being Modified
Based on the above research, it can be found that the dynamic length calculation model in different entering influential time is

where

The symbols are the same as mentioned previously.
3. Application of the Model
A city main road is the two-way six lanes. Free travel speed is 60 km/h. There is an off-street parking lot on one side of the road. Speed of parking entrance is limited to 5 km/h. The proportion of bus is 10%. Try to analyze the influence length under the situation that the saturation is, respectively, 0.46, 0.5, 0.6, 0.7, 0.8, and 0.87, and the entrance time when the parking car enters the parking lot is, respectively, 4 s, 6 s, 7 s, 9 s, 11 s, 13 s, 15 s, 17 s, 19 s, and 21 s. Assuming that the headway between the parking car and the following first vehicle is 5 s, and traffic average headway is 4 s, the saturation is 0.46–0.87.
3.1. Basic Parameters Calibration
Confirm the value of the parameters as follows: the free flow speed v f = 60 km/h, parking car's deceleration a = 2.5 m/s2, the speed after deceleration v1′ = 5 km/h, bus ratio η = 0.10, headway between the parking car and the first vehicle of the main road upstream t1 = 5 s, and upstream average headway h t = 4 s.
3.2. Computing v1, tslow, and t1′
Results can be seen in Table 4.
v1, tdecelerate, and t1′ under different saturation.

3.3. Computing t in Different Entering Time
The influence time of entering is relevant to entering time, average headway h t , t1′, and tslow, which can be determined by (13) according to the specific conditions. The results are in Table 5.
Parking influence time based on different entering time and saturation.

3.4. Simulation of the Influence Length
Research on the theory of vehicle braking deceleration is relatively mature, so this part is not compared by simulation in this paper. The influential model of the main road upstream traffic is simulated by VISSIM5.3 software. The calculated results and the results of simulation model were compared, as shown in Figure 6. Analysis shows that the variation trend of calculation model and the simulation results are the same. Two-curve fitting degree is high, indicating that when the saturation is 0.46–0.87, the model has a certain degree of accuracy.
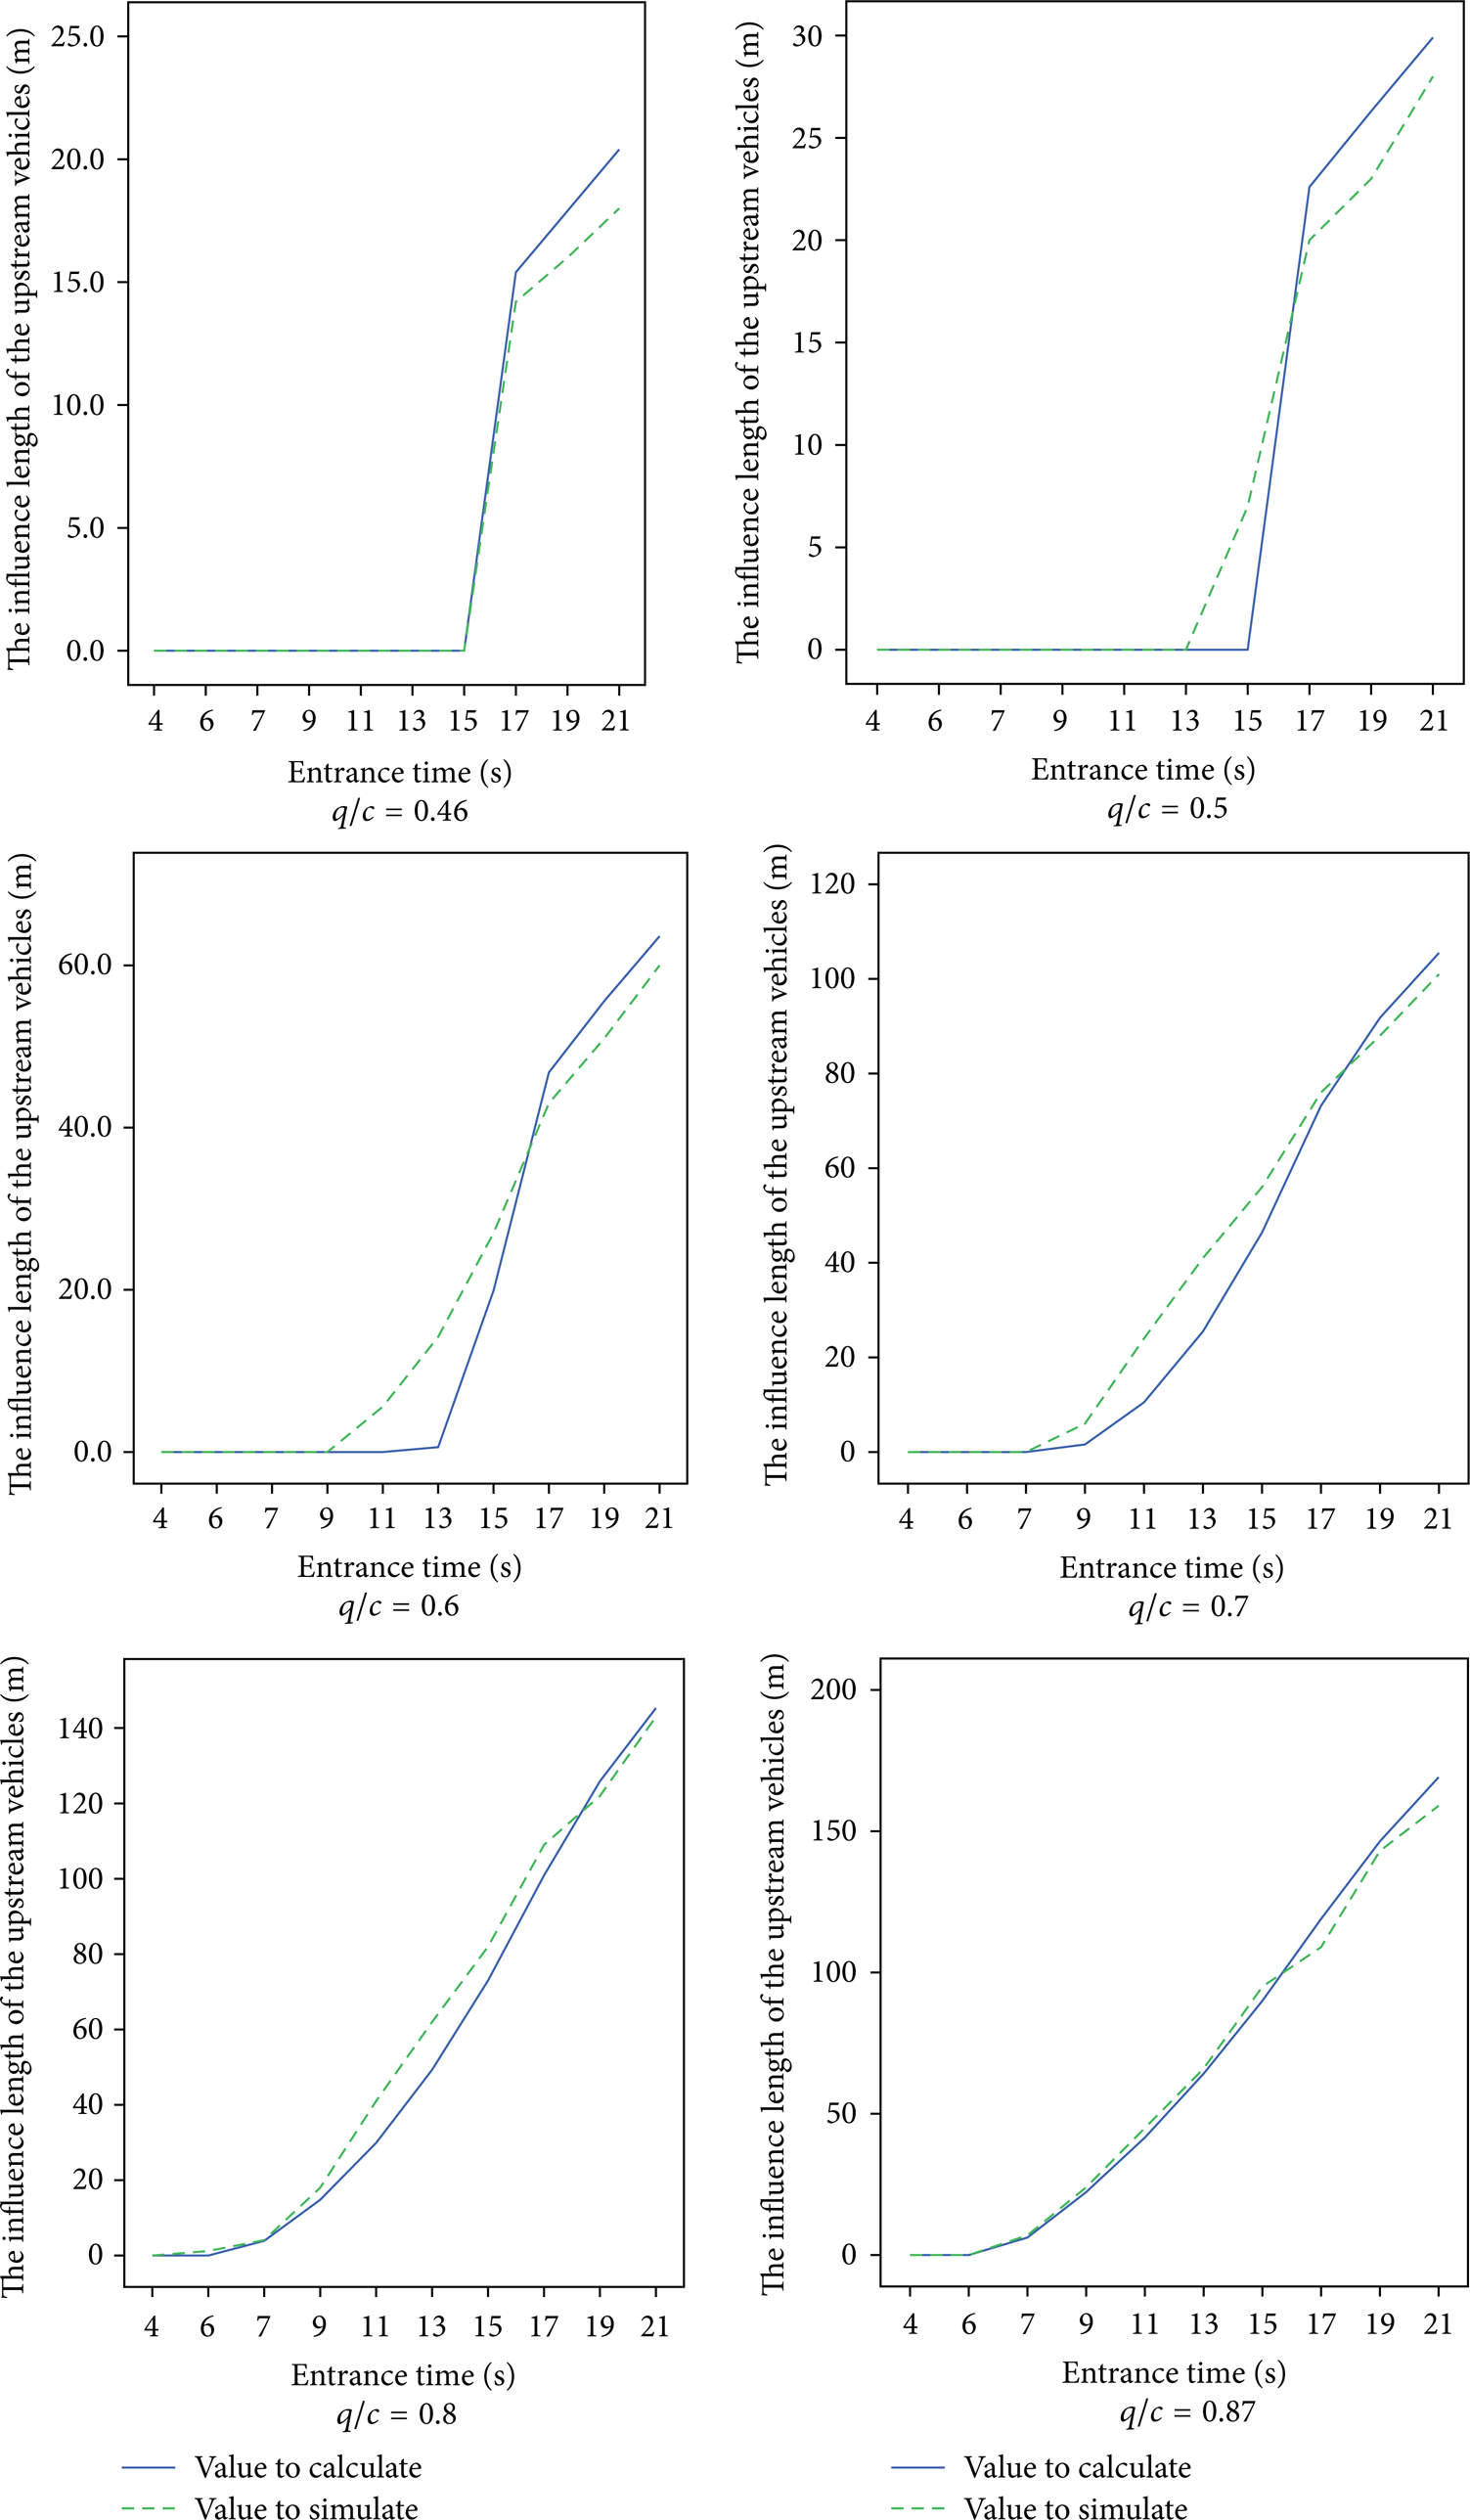
Comparison of the simulation and the calculation results of upstream vehicles' influencel length under different saturation.
3.5. Analysis of the Dynamic Influence Length
The total influence length due to entering car's deceleration and upstream vehicles at different entering time is shown in Figure 7. Some conclusion can be drawn as follows.
When 4 s ≤ Tin ≤ 8 s, saturation and influential length are reciprocal ratio relationship. Mostly because when saturation is 0.46, the deceleration braking distance is maximum, while it is minimum when saturation is 0.87. At this moment, the influential length mainly comes from the reduction of the entering vehicles.
When 8 s < Tin ≤ 21 s, saturation and influential length are in direct proportion relationship. And with time increasing, the change trend is more obvious. At this moment, the influential length mainly comes from the interference of the main upstream vehicles.

The total influence length.
The influence length of vehicles upstream on the main road resulted by parking car is shown in Figure 8. Some conclusions also can be drawn as follows. (1) When the saturations are the same, influential length and the entering time are in direct proportion. (2) When entering time is 4 s ≤ Tin ≤ 9 s, only v/c > 0.7 can have influence on upstream vehicles. (3) When 0.46 ≤ v/c ≤ 0.5 and 4 s ≤ Tin ≤ 15 s, vehicles' entering has no influence on main upstream vehicles; while 15 s < Tin ≤ 21 s, growth rate of upstream influential length led by entering vehicles is slow. (4) When v/c ≥ 0.6, the longer the entering time is, the quicker the growth rate of influential length is. Therefore when the saturation is bigger than 0.6 and the entering time is longer than 9 s, improving the leaving efficiency of vehicles is one of the most effective ways to reduce queues and traffic jams.

The influence length of vehicles upstream on the main road.
4. Conclusion
Based on the theoretical analysis and combined with the field data investigation, this paper has established a model which can calculate the dynamic influence length caused by the right-turn off-street parking car. The advantages of the model were illustrated by taking detailed data from field surveys and contrasting the simulation of VISSIM 5.3. Also, some conclusions were drawn from the applications of the model. First, when entering time was between 4 s and 8 s, saturation and the influence length were in inverse proportion; while the entering time was more than 8 s, saturation and the influence length were in direct proportion. Second, when the saturation was between 0.46 and −0.5 and entering time was between 4 s and 15 s, parking car had no effect on the vehicles. Third, when the saturation was more than 0.6 and entering time was more than 9 s, the effect of parking car on the vehicles influential length increased significantly.
Conflict of Interests
The authors declare that there is no conflict of interests regarding the publication of this paper.
Footnotes
Acknowledgment
This research is supported by the National Natural Science Fund Program (51078084 & 51238008) and the Science Foundation of Educational Committee of Jiangsu Province (Project no. 12KJD580006), China.