
Abstract
A fiber Bragg grating (FBG) tension sensor for anchor rope has been proposed and implemented in the full-scale impact test of rockfall protection barriers in this paper. According to the measurement principle of the tension sensor, the wavelength shift difference of the two FBGs which, respectively, measure the positive and negative strain in the spring element is utilized as sensing signal. Therefore, the force sensitivity is increased and the temperature cross-sensitivity is compensated. Experimental results indicate that the measurement sensitivity is 14.85 pm/kN in a range from 0 to 150 kN. The dynamic forces on anchor ropes in barriers have been clearly recorded by the designed sensors during the impact test, and the variation of the impact forces could be mainly divided into three stages. This kind of tension sensor is expected to be widely used for force's quasi-distributed measurement or remote monitoring in industrial and mechanical fields.
1. Introduction
Anchor ropes have been widely applied in industry and manufacture fields. For the traditional force transducers or tension sensors mainly based on electrical strain gauges or piezoelectric materials, there are many disadvantages which restrict their utilization in harsh environment, since they are influenced by electromagnetic interference (EMI) and difficult to realize force's remote or multipoint measurement as discussed elsewhere [1–3]. Therefore, there is a lack of an efficient and effective method to realize multipoint measurement or long-term online monitoring of the tensile forces on anchor ropes at a remote distance.
In recent years, fiber-Bragg-grating- (FBG-) based sensors have been intensively investigated and widely implemented, due to their attractive characteristics such as small size, immunity to EMI, remote sensing, environmental ruggedness, and massive multiplexing capabilities, as discussed elsewhere [4–6]. Thanks to these excellent transmission capabilities, the distance to the measuring point can be many kilometers, and a lot of measuring points can be multiplexed in a single optical fiber as discussed byLópez-Higuera et al.[7]. Given their intrinsic capability to measure a multitude of parameters such as strain, temperature, pressure, acceleration, chemical and biological agents, and many others, FBG-based sensors have been developed for a widespread variety of sensing and monitoring applications in civil engineering, aerospace, marine, oil and gas, composites, smart structures, and biomedical devices as studied elsewhere [8–11]. A load cell based on fiber Bragg grating for icing monitoring on high-voltage overhead transmission lines was presented by Ma et al. [12]. FBG sensors were encapsulated into steel strand for tension monitoring of a tendon as proposed by Kim et al. [13]. An FBG pull sensor based on loop thin-wall section beam was presented by Liu et al.[14].
In this paper, an FBG tension sensor for anchor rope has been designed and studied. Measurement principle of the tension sensor is introduced. Using the two FBGs' wavelength shift difference as sensing signal, the measurement sensitivity is improved and the temperature cross-sensitivity is avoided. The dynamic impact forces acting on the anchor ropes in the rockfall protection barrier during the full-scale impact test have been accurately monitored by the FBG tension sensors, and the variation of the impact forces could be mainly divided into three stages. This kind of FBG tension sensor could be widely used for force's quasi-distributed measurement or real-time remote monitoring in industrial and mechanical fields.
2. The FBG Tension Sensor
The structure schematic diagram of the FBG tension sensor is depicted in Figure 1. The tension sensor mainly consists of two FBGs and a spring element. The two FBGs (FBG-1, FBG-2) in one optical fiber are bonded on the surface of the spring element with epoxy adhesive as shown in Figure 1. The spring element converts linearly the force into strain, and the two FBGs are used to detect the strain distributed on the surface of the spring element.

The structure of the FBG tension sensor.
2.1. Fiber Bragg Grating
Fiber Bragg grating is a spectral filter realized by the principle of Bragg reflection. It is written by exposing the optical fiber to a periodic pattern of ultraviolet light. The Bragg wavelength shift of FBG Δλ is simultaneously modulated by strain and temperature. The wavelength variation response to axial strain change Δ∊ and temperature change ΔT could be given by [15]
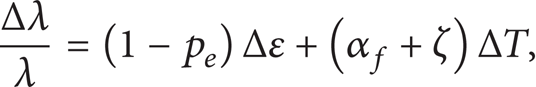
where λ is the initial wavelength of FBG p e , α f , and ζ are, respectively, the effective photoelastic coefficient, the thermal expansion coefficient, and the thermal-optic coefficient of fused silica fiber. According to (1), the influence of temperature fluctuation should be eliminated in order to obtain pure strain variation.
2.2. Measurement Principle
The spring element of the sensor is a metal plate with two circular holes in a flat oval cavity as shown in Figure 2. When an external tension F is applied, the spring element deforms and strain is produced on its surface. FBG-1 and FBG-2bondedon the surface of the springelementsense the strain (∊1, ∊2) at their placed points (point 1 and 2), respectively. The wavelength shifts of FBG-1 and FBG-2 are obtained by (1)


The schematic diagram of the spring element.
As the two FBGs in one sensor are fabricated with approximate initial wavelengths (λFBG-1 = 1556.101 nm, λFBG-2 = 1561.895 nm) and the initial wavelengths are much larger than the wavelength shifts (ΔλFBG-1, ΔλFBG-2), λFBG-1 and λFBG-2 could be replaced by an equivalence value (λ). Assuming that the two FBGs undergo the same temperature variation, the difference between the two wavelength shifts could be estimated by subtracting (2) from (3):

For an FBG of central wavelength of 1550 nm, typical strain sensitivity is approximately 1.2 pm/microstrain. Equation (4) can be adapted as

Figure 3 shows the strain values of ∊1 and ∊2 calculated by the finite element analysis (FEA) with ANSYS, when the spring element is applied by different values of force F. The material of the spring element is 1045 steel and the structure parameters of the spring element used in the calculation and simulation are as follows: Young's modulus E = 1.93 × 10¹¹ Pa, Poisson's ratio μ = 0.31, radius R = 33 mm, diameter D = 55 mm, thickness H = 30 mm, h = 10 mm, length A = 270 mm, width B = 106 mm, and distance c = 39 mm.

Strain values of ∊1 and ∊2 versus force.
It could be found from Figure 3 that there is positive strain ∊1 at point 1 and negative strain ∊2 at point 2. The linear relation between the strain (∊1, ∊2) and the applied force F can be, respectively, expressed as

Assuming that the strain transmission ratio from the spring element to FBGs is 1, regardless of the effect ofadhesive, according to (5) and (6), the relation of wavelength shift difference of the two FBGs and the applied force can be obtained:

Equation (7) shows that the difference in wavelength shifts of the two FBGs is a linear function of force and independent of temperature variation. In addition, the force sensitivity calculated is 17.472 pm/kN, and it is enhanced compared to the wavelength shift of one single FBG as sensing signal.
2.3. Calibration Experiment
The calibration experiment has been carried out on a material testing machine as shown in Figure 4. The wavelength interrogation system is used to monitor the FBGs' wavelength shifts and mainly composed of an FBG interrogator and related ancillary components such as multiplexers, switches, and software. The FBG interrogator shown in Figure 4 is based on diffractive grating and charge-coupled device (CCD) array technology with minimum wavelength resolution of 0.4 pm and maximum data acquisition rate of 8 kHz, which could suit most measurement applications of dynamic force. During the experiment, the force applied to the FBG tension sensor is controlled by the material testing machine and changed from 0 to 150 kN.
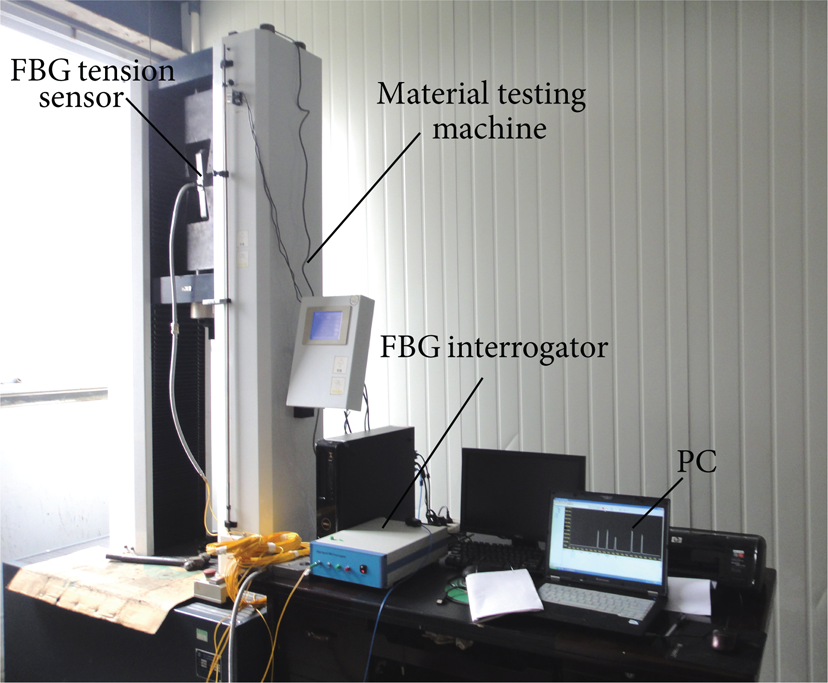
Setup of the calibration experiment.
Figure 5 shows the wavelength shifts of the two FBGs versus the applied force. The wavelength of FBG-1 presents a red shift, indicating that FBG-1 senses the positive strain, while the wavelength of FBG-2 has a blue shift which verifies that FBG-2 measures the negative strain. Both variation patterns are linear, and the slope is 5.57 and −9.28, respectively.
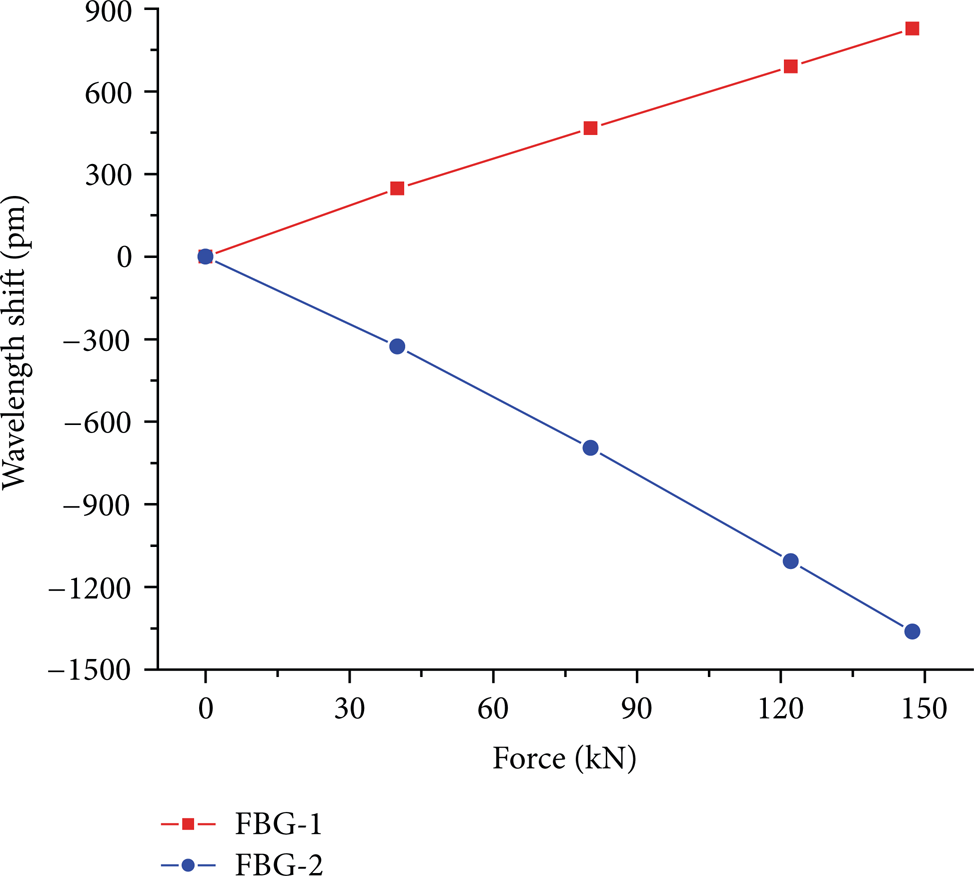
Wavelength shifts of the two FBGs versus force.
Figure 6 lists the difference values in the wavelength shifts of the two FBGs at each force value. The fitting results are also presented and the force sensitivity obtained is 14.85 pm/kN with a fitting linear correlation coefficient of 99.969%. The measured sensitivity is in agreement with the theoretical calculation value, and the difference is mainly caused by the strain transmission and simulation calculation error.

Variation of the wavelength shift difference of the two FBGs versus force.
3. Application for Dynamic Force Measurement
Rockfall protection barriers have been extensively used in civil engineering as passive countermeasures to prevent a rockfall event to reach the surrounding roads, railways, and built-up areas as discussed elsewhere [16, 17]. Full-scale impact tests are very important to evaluate the behaviour of rockfall protection barriers and design procedures that still mostly rely on the results of impact rest as discussed elsewhere [18, 19]. The FBG tension sensors presented in this paper have been utilized to measure the dynamic forces acting on the anchor ropes of the barriers in impact test.
The test site depicted in Figure 7 located in Sichuan, China, was built by Sichuan OST Slope Protection Engineering Co., Ltd, in order to verify and assess whether arockfall protection barrier is effectively able to withstand the designed impact energy. The test block, a concrete polyhedron, is lifted by a travelling crane and then released to vertically impact into the barrier in freefall motion with known kinetic energy.
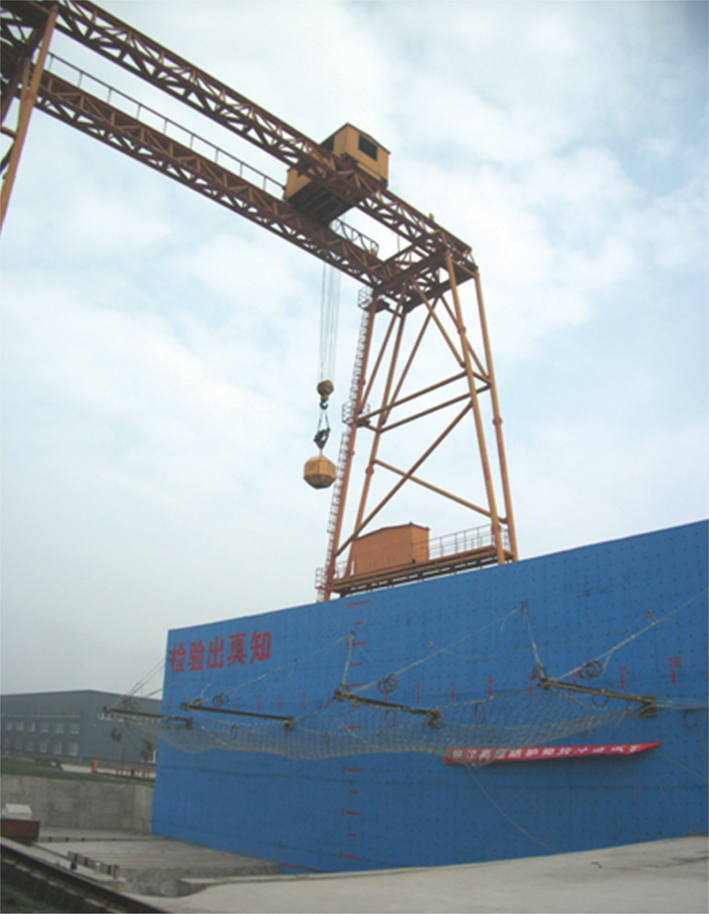
General view of the test site.
The tested barrier, a full-scale flexiblerockfallprotection barrier manufactured by the company, has a capacity to protect against rockfall impact energies of up to 1000 kJ. Figure 8(a) shows the sketch of the tested barrier, which is mainly composed of ring nets, posts, anchor ropes (support rope, retaining rope, and other ropes), clamps, studs, and so forth. The ring nets and brake rings illustrated in Figure 8(b) are the dissipating devices in a barrier.
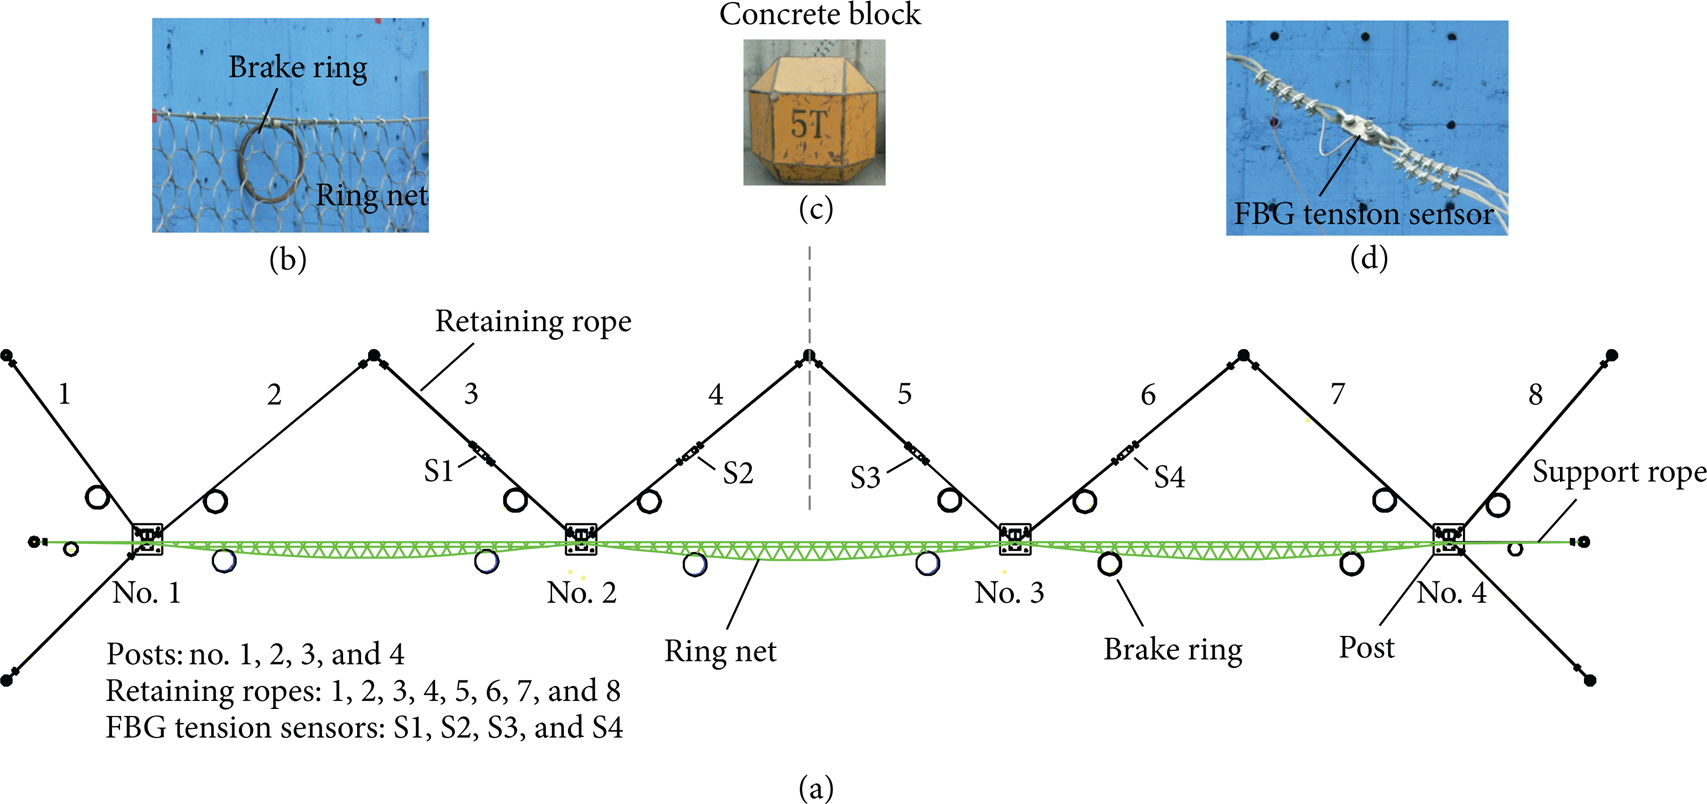
Details of the impact test: (a) sketch of the tested barrier, (b) brake ring and ring net, (c) concrete block, and (d) FBG tension sensor installed on the rope.
Four FBG tension sensors (S1, S2, S3, and S4) were installed on the main force-bearing retaining ropes (3, 4, 5, and 6) in the barrier to measure the dynamic tensile forces during the impact test as shown in Figures 8(a) and 8(d). After free falling from a height of 20 m, the 5 ton concrete block smashed into the ring net of the barriers with an impact kinetic energy of 1000 kJ, which is the maximum designed absorbing energy value of the tested barrier.
4. Results and Discussion
In the impact test, the tested barrier successfully caught the falling concrete block and effectively withstood the impact energy of 1000 kJ. The barrier after the impact with the block in the net is shown in Figure 9.
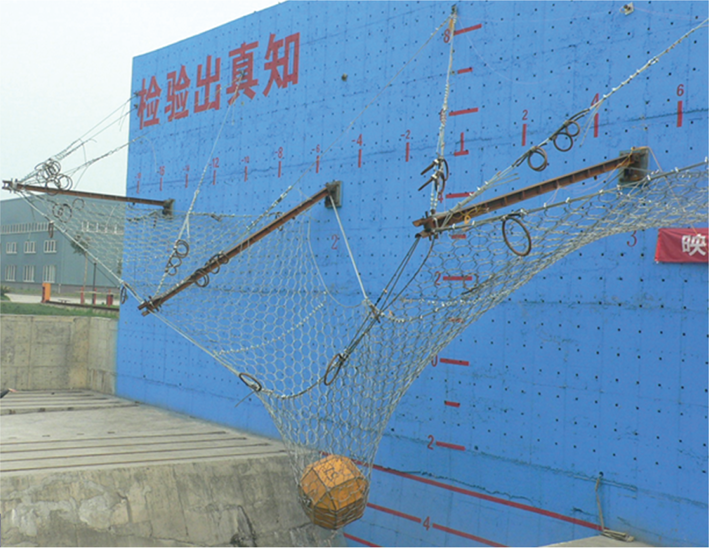
The tested barrier after the impact.
As depicted in Figure 10, the FBG tension sensors clearly recorded the impact forces acting on the retaining ropes during the test with a sampling rate of 1 kHz. The peak values of impact forces on retaining cope 3, 4, 5, and 6 were, respectively, 91.2 kN, 119.5 kN, 110.2 kN, and 82.7 kN, and the overall braking time was approximately 0.87 s. As the block was still in the net, the forces on the ropes did not return to zero after the impact as shown in Figure 10.
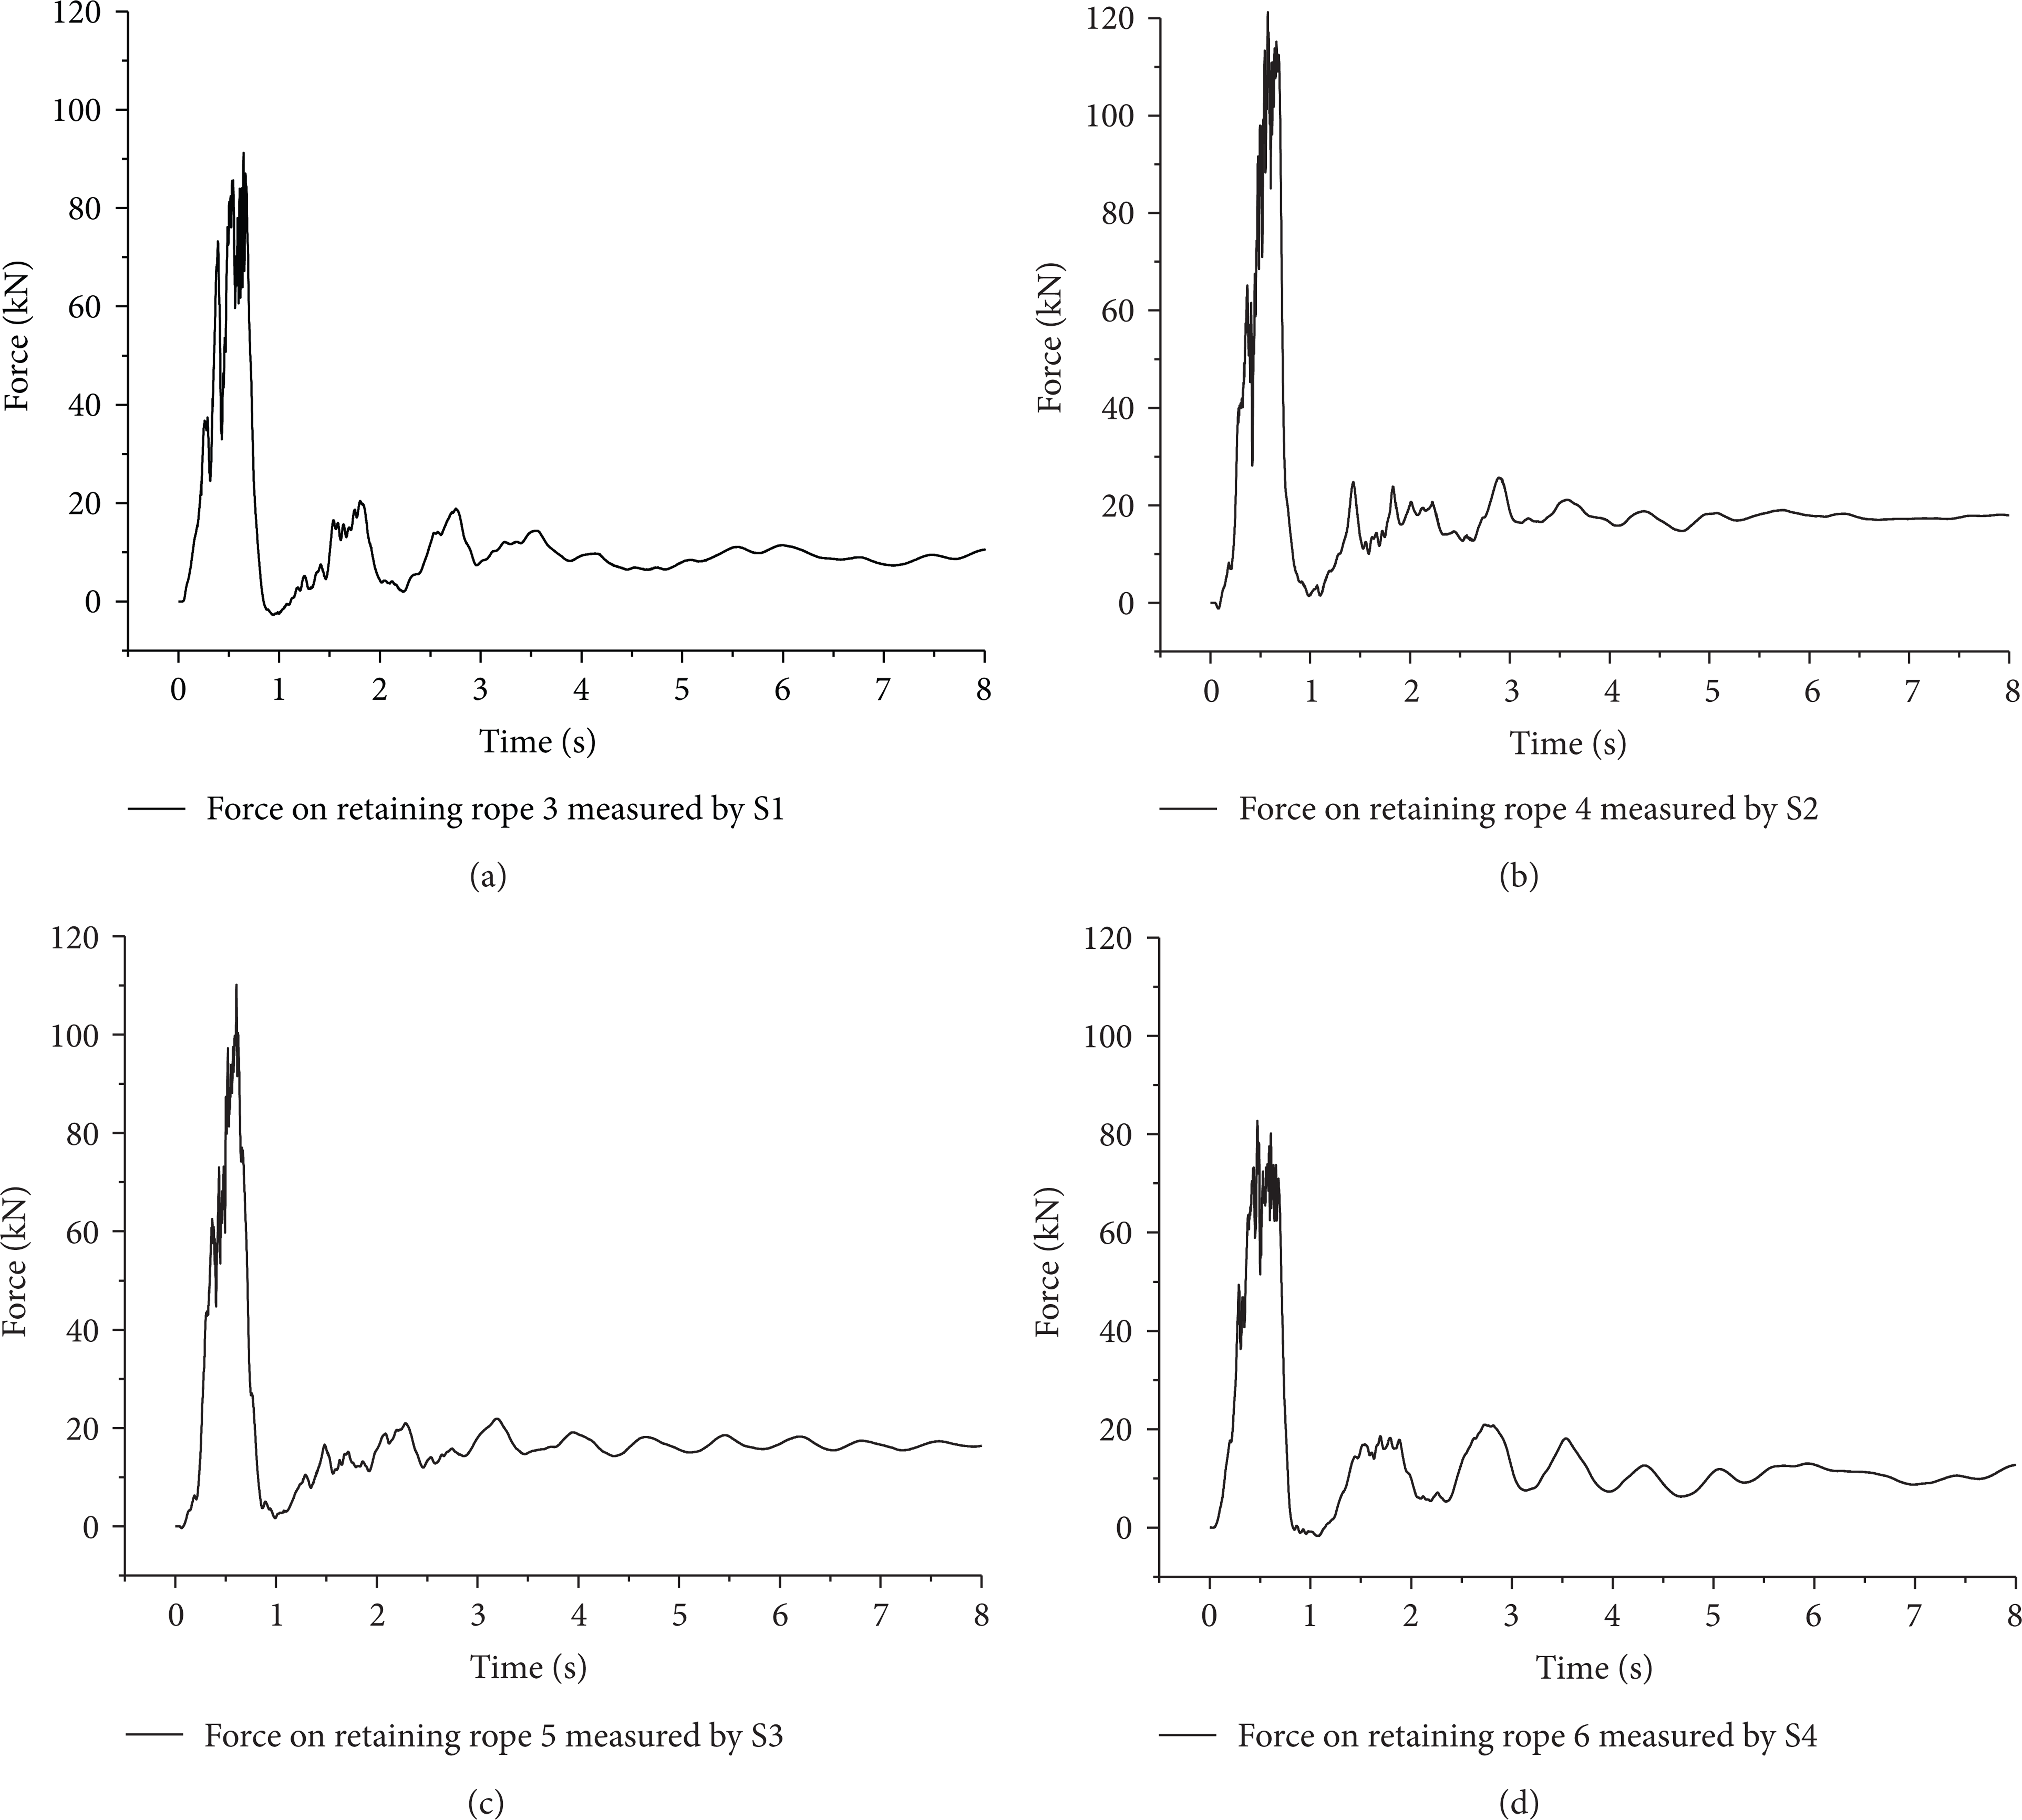
The impact forces measured by the FBG tension sensors.
The impact forces recorded in the initialfirstsecond as shown in Figure 11 indicate that the variation of the impact forces on the retaining ropes could be mainly divided into three stages: smooth increasing to a value, seesaw rising until reaching the peak value, and rapidly decreasing. This impact process measured by the FBG tension sensors has a good agreement with the results obtained by Gottardi and Govoniusing traditional load cells [20].
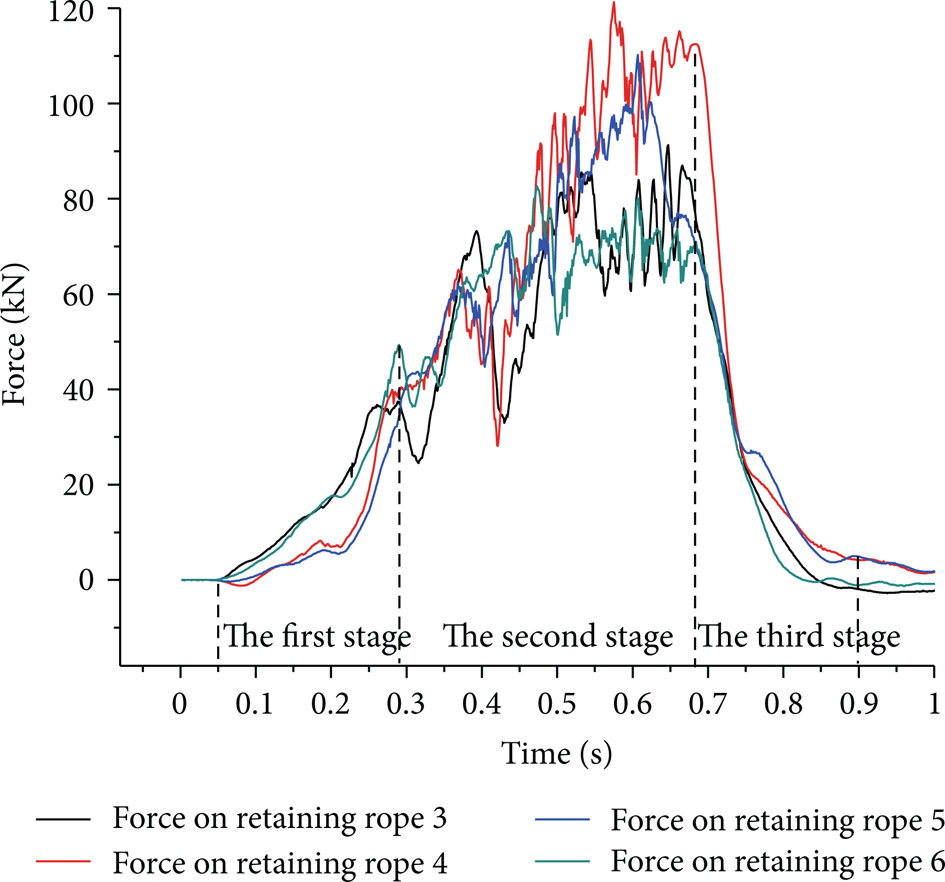
The impact forces recorded in the initial first second.
Considering the barrier's structure characteristics and the measurement results, it could be found that
in the first stage, the tensile forces on the retaining ropes are lower than the start thresholds of the brake rings on the ropes, and the impact kinetic energy is at first absorbed through plastic deformation of the ring bundles of the ring nets;
in the second stage, the tensile forces on the ropes reach and exceed the start thresholds, and the brake rings are added to dissipating the kinetic energy;
finally in the third stage, the impact energy has been absorbed by the energy dissipating devices.
The presented FBG tension sensors are extremely useful in the impact tests to provide accurate and reliable experimental data for investigating the behaviour of therockfallprotection barriers. Furthermore, due to the characteristics of remote sensing, environmental ruggedness, and massive multiplexing capabilities, they could be applied to monitor the security conditions of the barriers at a remote distance.
5. Conclusions
An FBG tension sensor for anchor rope has been presented and applied to measure the dynamic forces on anchor ropes in impact test. The temperature cross-sensitivity is effectively avoided by using the wavelength shift difference between the two FBGs adhered on the spring element as the force sensitivity parameter. The experiment results indicate that the force sensitivity is 14.85 pm/kN in a range from 0 to 150 kN. The dynamic forces on anchor ropes in the full-scale impact test of arockfallprotection barrier have been clearly recorded by the FBG tension sensors. The measurement range and sensitivity of the tension sensor can be easily adjusted by optimizing the size and material of the spring element to adapt different measure demands, and multiplexing could be realized by adding the FBGs in a single optical fiber. This kind of force sensor is supposed to have many potential applications for quasi-distributed force measurement and remote online monitoring in industrial and mechanical fields.
Footnotes
Acknowledgments
This work was supported by the National Science and Technology Major Project of China under Grant no. 2012ZX04001-012-05 and the Key Project of National Natural Science Foundation of China under Grant no. 50935005. The authors are very grateful to Sichuan OST Slope Protection Engineering Co., Ltd. for the use of test site.