
Abstract
Activities in laboratories, workshops, and offices can be significantly affected by their ambiance and environmental conditions, such as lighting, humidity, and temperature. This research focuses on laboratories and aims to improve people's performance of activities inside them. To this end, we have developed a cyber-physical system (CPS) for a smart/intelligent laboratory environment which is able to dynamically and automatically interpret and regulate environmental conditions. In this paper, we present the CPS development framework. The proposed CPS can measure, analyze, and regulate the thermal comfort. In order to prolong the lifetime of the system, mechanisms for low-volume communication, distributed computation, and habit-based adaptive control are proposed. Evaluations of an on-site deployment verify the functionality of the proposed CPS. Although our focus is on laboratories, this research can be applied to other similar environments, which are intended to support human performance and productivity, and has implications for the creation of smart cities.
1. Introduction
Cyber-physical systems (CPSs) contain numerous distributed, linked, and autonomously operated sensor and actuator nodes [1–5]. Generally, CPS can be used to gather adequate information about the physical environment via sensors and eventually provide useful and prompt services for people via actuators and computers. From the system perspective, computation, communication, and control are integrated in CPS, in order to manipulate cyber/physical devices in response to data fed from sensors. Results showed that CPS can be used for indoor applications [6–8]. Despite this, CPSs have seldom been seeing used in improving and maintaining performance of activities in schools and laboratories.
Activities carried out in laboratories have become increasingly sophisticated and highly complicated. Different technologies have been proposed to integrate tools and services for the management of laboratories [9–11]. However, existing technologies are mainly about facilitating analytic activities (e.g., data collection, measurement, and interpretation) and postanalytic activities (e.g., reporting of results). As with any performance-based environment, the ambiance and environmental conditions of a laboratory can significantly affect the result of experiments and other activities carried out with it. For examples, people have to work with different hazardous chemical substances (i.e., solvents, catalysts, reagents, and products) and environment-sensitive equipment. Variations in the laboratory environmental conditions can significantly impact, and at times deteriorate, the performance of laboratory activities. Therefore, a proper preanalytic interpretation and regulation of environmental conditions in laboratories can lead to a better environment for transforming measured data into more accurate and meaningful results. In other words, a “smart/intelligent laboratory” is essential for automatic moderation and regulation of the environment, such that the laboratory is reliable, efficient, and effective for activities anywhere and anytime. This issue does not seem to have been explored in great detail by researchers; yet, it is significant not only to laboratories but also to many similar environments, including offices, hospital rooms, and factory workshops. Preliminary, a wireless sensor network (WSN) had been proposed for collecting information of environmental conditions in a laboratory [12]. However, the WSN cannot convert measured data into meaningful knowledge through statistical analysis, and it also cannot provide services to regulate the environment dynamically and automatically because of the absence of actuators and control algorithms in the system.
In this paper, we describe how a smart laboratory can be constructed via a CPS, for gathering and acting on relevant information in laboratories. In the proposed system, thermal comfort is used as an example of the environmental factor for regulation. The major contributions of our paper are as follows.
We have created a complete development framework of a smart laboratory via a CPS, based on both theoretical analyses and practical experience. In particular, we identified various possible services for staff and facilities and their relevant physical quantities (or environmental conditions) that can and perhaps should be regulated. We have deployed the CPS in a realistic environment. In particular, we have developed hardware prototypes and necessary operation mechanisms for the system. We have partially distributed computations to sensor nodes for low-power operations and prompt responses. We have developed habit-based adaptive control and low-volume communication mechanisms for low-power operation in nodes.
This paper is structured as follows. After the introduction of smart laboratories in Section 2, requirements of a smart laboratory environment as well as the discussion of computation, control, and communication in the CPS are presented in Section 3. The performance evaluation of the implemented CPS is shown in Section 4.
2. Regulating Thermal Comfort in a Smart Laboratory
2.1. Roles of a Smart Laboratory
The main purpose of a smart laboratory is to enhance the efficiency of working activities in laboratories by providing an environment that is comfortable and suits the needs of people. In particular, a smart laboratory should be able to
optimize work efficiency; protect people from recognized hazards, such as fires and accidental spill of chemical and bacteria; minimize the risk of injury and occupational illness as well as damage of equipment and the environment; track the existence of people and equipment for maintaining safety and security; reduce consumption of power and other resources without deteriorating efficiency of research activities.
In order to achieve the aforementioned outcomes, different physical quantities should be measured and regulated in dynamic and automated manner. Examples of design concerns and relevant physical quantities are shown in Table 1.
Examples of CPS functions in a smart laboratory.

2.2. Regulating Thermal Comfort in Laboratories
In the monitoring of a laboratory, one of the major relevant physical quantities is thermal comfort. Factors determining thermal comfort include air temperature, radiant temperature, air speed, and relative humidity (RH). A poor thermal comfort condition can lead to dissatisfaction and discomfort and eventually a reduction in concentration and work performance [13, 14]. For example, people become uncomfortable when the RH of the environment is lower than 25% or higher than 60%. A range of operative temperature and RH that meet the thermal comfort criteria can be found in [15].
In order to standardize the analysis process, according to the ISO 7730 standard, the predicted mean vote (PMV) can be used as a quantitative indicator to forecast the mean value of votes for a large group of people on the seven-/eleven-point thermal sensation scale (as shown in Table 2) [16] in an environment. In addition, the Percentage of Persons Dissatisfied (PPD) is a related index that establishes a quantitative prediction of the percentage of thermally dissatisfied people who feel too cold or too hot (i.e., uncomfortable).
Eleven-/seven-point general/indoor thermal sensation scale.

Meanwhile, reliability of equipment can also be affected by temperature and RH (i.e., thermal comfort). For example, low RH may cause problems with static electricity, which may cause damages to static-sensitive equipment and materials. Similarly, it may cause fires and explosions when working with flammable liquids and gases. On the other hand, when the RH is high (e.g. >70%), there may be condensations on surfaces of instruments, which leads to corrosions and moisture-related deteriorations. Therefore, these quantities should be moderated automatically and dynamically.
2.3. Challenges of Deploying CPS in Laboratories
There are a few challenges in the deployment of CPS in general environments, such as power supply for the system, processing of measured data, and communications between nodes. In laboratories, there are a few specific requirements for the deployment of CPS.
Nodes should be placed seamlessly, such that nodes can measure realistic environments and provide effective services and prevent destructions by the impact of equipment and human activities. Most power plugs are assumed to be used by existing, or future, equipment; therefore only the base station (BS) can be powered by a power plug. Nodes are usually powered by portable battery packs. Wireless communication may be blocked by physical obstacles (e.g., wall structures) and electromagnetic obstacles (e.g., instruments and computers).
3. Development of a Smart Laboratory via a CPS
3.1. Deployed Environment
The proposed CPS has been tested in an engineering project laboratory in a medium size university located in a developed city. In the studied semester, about 150 students had to use microprocessor boards as well as peripheral sensors and actuators to design engineering machines [17, 18]. The floor plan of the laboratory and positions of deployed nodes are shown in Figure 1. Since many students had to work at the same time before the demonstration and main vents in the laboratory were not distributed evenly, there were areas with poor ventilations and thermal comfort. Therefore, a CPS was deployed for regulating the thermal comfort of the laboratory. In particular, in order to ensure a complete coverage of surveillance and avoid power-expensive multihop wireless communication, the BS was placed in the middle of the laboratory, with nodes distributed throughout the laboratory.

The deployment of the CPS in the laboratory. The black square, black circles, black triangles, grey squares, and white rectangles denote the BS, sensor nodes, actuator nodes, wall structures, and laboratory benches, respectively.
The number of base stations, sensor nodes, and actuator nodes (Figure 2) is mainly based on the applied node placement strategy and specifications of hardware. For example, if the maximum coverage radius of sensor nodes is 3.9 meters, 35 sensor nodes are able to serve about 93% of the laboratory area. Fewer nodes are needed if only a few important regions instead of the entire laboratory are supervised. Meanwhile, only one base station is needed to control all nodes, since the base station is placed near the centre of the laboratory, and the communication range of nodes is long enough for communications.

Block diagram of nodes: (a) sensor node and (b) actuator node.
3.2. Hardware of Nodes
In the proposed CPS, an Arduino-compatible and transceiver-embedded microcontroller platform Zigduino is used as the backbone of nodes and the BS. Implemented sensor node and actuator node are shown in Figure 3. Sensors are installed on sensor nodes for measuring humidity, temperature, luminosity, and presence of people. In particular, a human infrared motion sensor is used as an occupancy sensor. In other words, when a person is tracked by the sensor, the system starts to assume that there are human laboratory activities.
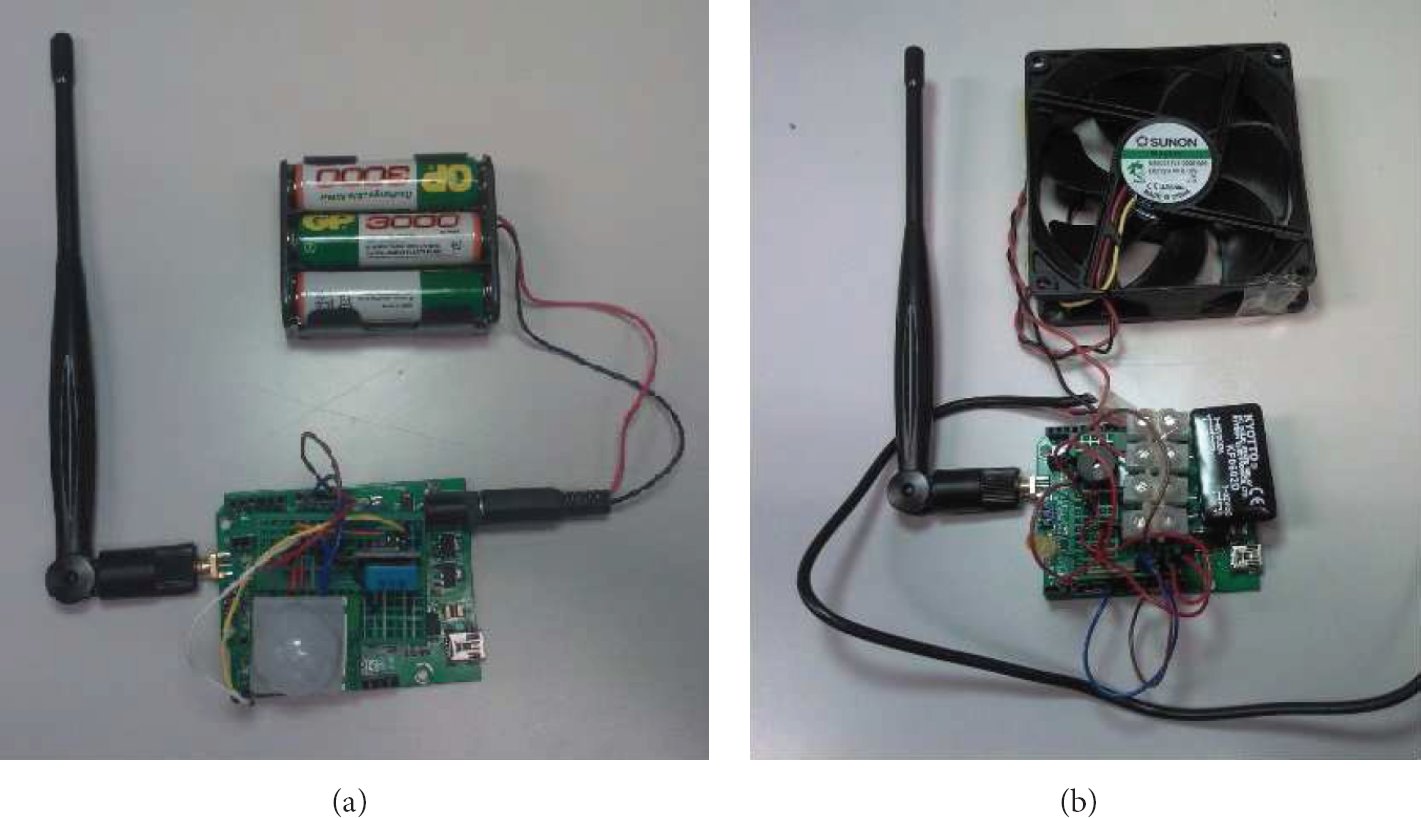
Implemented prototypes of nodes: (a) sensor node and (b) actuator node.
Meanwhile, electrical fans, electrical buzzers, and light emitting diodes are installed on actuator nodes for notifying and introducing motions. Furthermore, since the fan consumes a large power for operations, it is powered by a separated battery pack.
3.3. Distributed Computations for Regulating the Thermal Comfort
The PMV model predicts human comfort as a function of four environmental variables (i.e., air temperature, radiant temperature, air speed, and humidity) and two personal variables (clothing and physical activity). In particular, the PMV model and PPD are described as follows [16]:


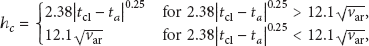


where M is the metabolic rate, W is the effective mechanical power,
Empirical relationship between PPD with a thermal environment as a function of the PMV is shown in Figure 4. Furthermore, Figure 5 shows an empirical relationship between the thermal environment as a function of the PMV with ambient air temperature, relative air velocity, and relative humidity. In this example,

An empirical relationship between PPD with PMV.
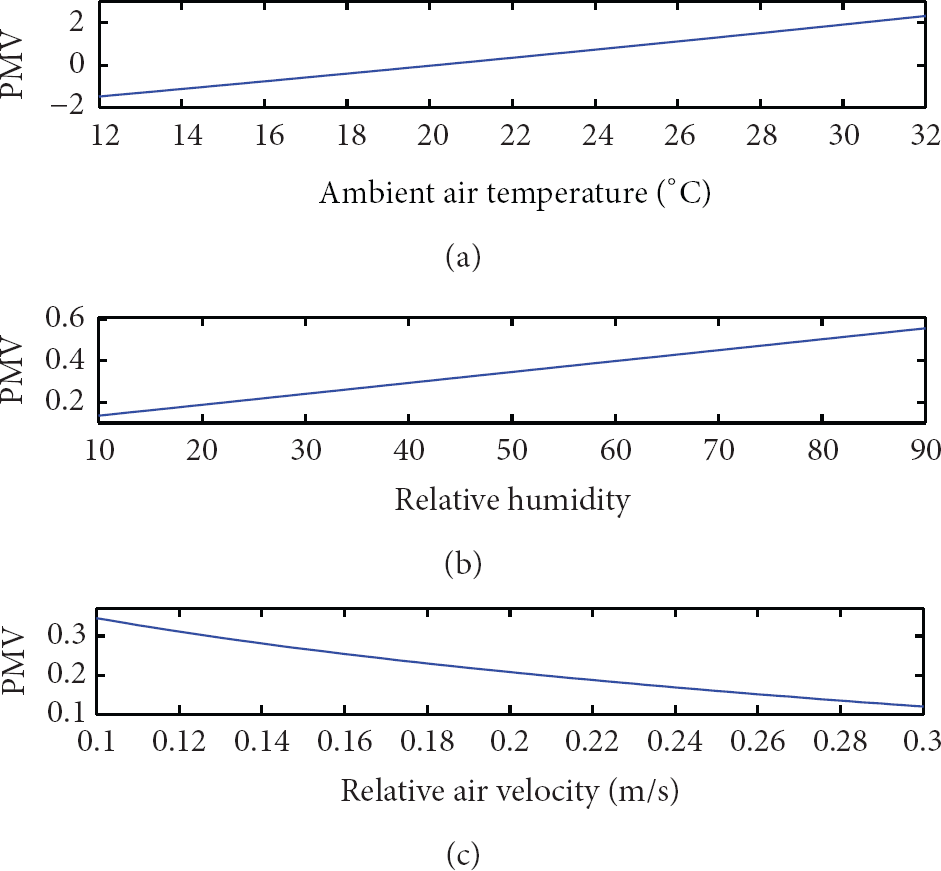
An empirical relationship between PMV and various PMV parameters: (a) ambient air temperature, (b) relative humidity, and (c) relative air velocity.
In the implemented system, given the predetermined parameters, we can calculate “Hazard” messages will be sent from the sensor node to its neighbor actuator node and the BS if (i) its current Activating messages will be sent from the BS to all actuator nodes if (i) average
Communication mechanisms in situations with different temperature and RH are similar and are not discussed here.
3.4. Distributed Computations for Analyzing the Environment
Values of temperature and RH are sent from sensor nodes to the BS. Since characteristics (e.g., reliability and redundancy) of machine-generated data are different from human-generated data, processing algorithms have been used in sensor nodes, such that noise spikes of measured data can be detected by sensor nodes directly, without processing through the BS. This can simplify the notification process and reduce the traffic of redundant data communication.
In parallel, computation algorithms have been installed in the BS (Zigduino board) to perform system-level analysis, generate histograms and relevant statistics (i.e., minimum, maximum, (running) average, and standard deviation (SD)), and eventually provide meaningful regulatory services for the laboratory. For example, short-term regulations are needed if measurements from various nodes are significantly diverse or have an abnormal maximum/minimum/average. Meanwhile, rearrangement of permanent ventilation is needed if long-term measurements have an abnormal average or a high SD.
Based on long-term measurement, the system can introduce occupancy prediction algorithms to make control decisions before condition of the environment changes. For example, ventilation can be enhanced for a while just before working hours. However, this is beyond the scope of this paper and it is part of our future research.
3.5. Communications between Nodes
Sensor messages (i.e., messages from sensor nodes) and actuator messages (i.e., messages to actuator nodes) are sent through the wireless network. Explanations of messages in the system are shown in Table 3. Generally, a sensor message contains its sensor node number, measurement readings, and a checksum. Meanwhile, urgent messages contain reserved action codes to indicate abnormal conditions, such as sensor failures. An actuator message contains the recipient actuator node number, action code, and a checksum.
Explanation of a node message {A, B, C, D}.

For reliable communications, a message acknowledgement mechanism and a disconnection alarm have been introduced, such that the system can notify technicians for diagnosis if the node is not working. For example, if a sensor node cannot successfully transmit messages to the BS, the sensor node will be self-classified as “disconnected.” In addition, if the quality of transmission is continuously low (e.g. link quality indicator (LQI) < 200), the sensor node is classified as “poorly connected.” At the same time, the BS also monitors the traffic of communications between nodes.
3.6. Habit-Based Mechanisms for Power-Aware Control
Sensor nodes and actuator nodes are mainly powered by 7.2 V 3 Ah battery packs that cannot be replaced frequently. In addition, by changing the node into “sleeping mode” in unnecessary situations, current consumption of the Zigduino board can be reduced by >99%. (In other words, power consumption can be significantly reduced.) Therefore, power-aware control operations are the major concern in practice.
In the proposed system, habit-based operation control mechanisms are introduced to sensor nodes and actuator nodes. A summary of the configuration of duty cycle for sensor nodes is shown in Table 4. To be specific, the control mechanism of sensor nodes adjusts the duty cycle, based on
long-term habits of laboratory activities, existences of current laboratory activities, existences of current abnormal environment condition, the status of current node operation.
Adjustments of sensor nodes' duty cycle.

For example, if the environment does not change, the duty cycle can be prolonged gradually until the duty cycle reaches a predetermined maximum duty cycle. The maximum duty cycle can be relaxed if there are no activities or abnormal conditions in the laboratory. On the other hand, besides the wireless transmitter, most parts in actuator nodes are usually deactivated. Actuator nodes are only activated when an interrupt is received from sensor nodes or the BS.
Besides the aforementioned control mechanisms, different techniques have also been used in the proposed CPS to avoid unnecessary power consumption, including the following.
Sensors are switched on only when an interrupt from the microcontroller is received. Measurement data from sensors are verified in the sensor node via checksum verification before transmission, such that sensor nodes only transmit meaningful information to the network. A message acknowledgement mechanism and a disconnection alarm are introduced to avoid nonmeaningful and irrelevant communications in the wireless network.
4. Evaluation of the System Performance
4.1. Detecting and Regulating Abnormal Environment Conditions in the Laboratory
Sensor readings had been analyzed to detect the onset of thermal comfort deterioration and restore the laboratory environment to a comfortable level, in a real-time manner. Measured readings and calculated indicators (i.e., PMV and PPD) in an abnormal condition are shown in Figures 6 and 7. In the study, a water vapor source had been placed at Time (I) near the sensor, in order to imitate a hot and humid environment. The source is then removed at Time (III). Based on received messages, the BS noticed the urgent abnormal condition at Time (II) because PMV > 1.5. Therefore, the electrical fan of the actuator node had switched on to provide adequate air ventilation for regulation. After five seconds, PMV had been decreased from 2.15 (“warm”) to 1.25 (“slightly warm”) and thus the environment had been regulated. Compared to the original environment, the regulated environment had a similar temperature, as well as a slightly higher RH and PMV. On the other hand, if the ventilation was not introduced by the CPS, temperature and PMV would have been raised to 43°C and 5.33 (“extremely hot”), respectively. These parameters showed that the conditions of the environment deteriorated and significantly affected the performance of human activities, which could eventually impact negatively the safety of people in the laboratory. This example shows that the proposed CPS can effectively detect and restore deteriorations of thermal comfort (and other physical quantities).

Obtained readings in an abnormal situation, with an actuator and without an actuator: (a) temperature and (b) relative humidity.

Obtained readings in an abnormal situation, with an actuator and without an actuator: (a) PMV and (b) PPD.
In the second example, the CPS with five sensor nodes and three actuator nodes has been used for analysis. Positions of deployed nodes are shown in Figure 1. In this case, a hot water vapor source had been placed between node 1 and node 2 to imitate a warm and humid environment. Measured data are shown in Figure 8. This information had been analyzed by the BS instantly. Based on the analyzed information, the system discovered that (i) measurements from nodes were diverse and (ii) although the condition did not create any instant danger, the room condition had been deteriorated gradually. Therefore, actuators were switched on, and a notification was sent to relevant personnel.

Readings of temperature and relative humidity obtained from sensor nodes in abnormal conditions.
4.2. Large-Scale Network Performance Analysis
The system collected 27.78-hour communication traffic for the evaluation of network performance. In the evaluation, a sensor node, an actuator node, and a BS had been deployed. In the study, 31412 messages had been collected. Results are shown in Table 5, in terms of system reliability (proportion of valid communication) and quality of received packets (link quality indicators (LQI)). Results indicate the system had successfully delivered a high proportion of valid transmissions in spite of dynamic channel conditions. Furthermore, all received messages have been verified by the checksum; therefore, all messages for processing are valid and meaningful.
System reliability and network reliability in the CPS.

4.3. Power Consumption of the Sensor Node with the Habit-Based Control Mechanism
The habit-based control mechanism had been evaluated by an example shown in Figure 9. In each cycle, the sensor node as well as the actuator node switched on and off based on the determined duty cycle. In the 1.8-hour surveillance example, there were (i) laboratory activities from 0 seconds to 200 seconds and the last 180 seconds (periods (a) and (b)) and (ii) abnormal conditions in the laboratory from 170 seconds to 770 seconds (periods (b) and (c)). The sensor node with the adaptive sensing configuration switched on 63 times and consumed 945 J for operations with a short delay in the detection of events. Meanwhile, in the fixed-schedule sensing configuration (i.e., sensing for every five seconds and sleeping otherwise), the sensor node switched on 1296 times and consumed 19290 J. The node without any sleeping operations consumes 50154 J. The excessive power consumption is caused by unnecessary measurements in low-risk situations (e.g., periods with no human laboratory activities). On the other hand, the actuator nodes had been switched on between periods (b) and (c). During the operation, 64.8 J and 533.68 J had been consumed by the actuator node (without the actuator) and the actuator, respectively. This example shows that the proposed mechanism can effectively prolong the lifetime of nodes and the system. Thus, the system can be placed in areas without continuous power supply.

The duty cycle of a sensor node with an adaptive sensing mechanism. (a), (b), (c), and (d) indicate normal conditions with laboratory activities, abnormal conditions with laboratory activities, abnormal conditions with no laboratory activities, and normal conditions with no laboratory, activities, respectively.
The regulation is not affected by the slow-changing environment, because (i) performance of sensor node measurement is not affected by the environment and (ii) computation algorithms in Section 3.3 are processed based on absolute readings. Furthermore, the control mechanism in Section 3.6 can be adjusted based on long-term habits of laboratory activities and environments. In summary, the system can perform accurately in slow-changing environments.
5. Conclusion
This paper presents a deployment framework of CPS for providing intelligent laboratory services in schools. Techniques have been proposed for addressing issues of power-aware adaptive control, distributed computations between nodes and BS, and low-volume and reliable data communication. Evaluations showed that the deployed CPS can regulate the thermal comfort. The developed system can also be used to regulate other relevant physical quantities shown in Table 1, for a comprehensive smart laboratory environment.
We believe that this research is confined not only to laboratories and schools but also to many similar environments such as offices, hospital rooms, and factory workshops. These environments are important to any urban city. If we are to develop smart cities, we need to look at both small and large-scale systems that are easily deployable, noninvasive, economical, effective, and energy efficient. Our smart CPS for small environments shows we can satisfy all these conditions. In the future we want to pursue our study in following directions:
introducing energy management and harvesting technologies for long-term self-powered operations, introducing prediction algorithms to make control decisions before condition of the environment changes, building a comprehensive smart environment for learning in schools and manufacturing in industries.
Footnotes
Acknowledgments
This work was partially supported by Xi'an Jiaotong-Liverpool University (Suzhou, China) Research Development Fund, under Grants RDF10-01-27 and RDF10-02-03, and Transcend Epoch International Co., Ltd., Hong Kong.