
Abstract
This paper designs and implements the high-speed FBG demodulation system which can demodulate multiple FBG sensors (up to 64 sensors in series per channel) of 4 channels synchronously. The system is based on the method of tunable F-P filter. Both the nonlinear effect and the temperature drift effect of the F-P filter are eliminated by applying the triangular-like drive signal and reference channels. In addition, a high-speed adaptive algorithm for peak-find is designed for the system. The experiment results show that, for the whole system, the stability is 2 pm, the resolution is 1 pm, the linearity is 0.999, the measurement precision is 20 pm, and the demodulation frequency is 4 kHz. Consequently, the system is very suitable for distributed dynamic monitoring of complicated mechanical equipment.
1. Introduction
In industrial applications, we need to ensure the normal operation of machinery manufacturing equipment through the dynamic monitoring of the system. The Information of these equipment such as temperature, deformation, and vibration parameters is acquired timely to feedback the system condition. Requirements for the monitoring of equipment condition increase since machinery manufacturing equipment become more automatic, intelligent, and precise. Sensor technology based on electrometric method is widely used in the field, but a single sensor in most of these cases can only measure a single signal. So it is hard to even not realize the condition monitoring for distributed multiparameters online. This high-speed FBG demodulation system has solved the problem perfectly.
FBG (Fiber Bragg grating) has many characteristics such as small volume and selective wavelength. It is suitable for WDM and will not disturb signal transmission. So it can be packaged into various sensors which are widely used in the monitoring of structural health, large mechanical equipment, physical quantity of severe environment, and so forth [1]. As technology evolves, FBG demodulation systems are required to measure the change of FBG reflection wavelength with higher speed and resolution in a wider optical spectrum range [2]. There are many methods in the research of demodulation, such as matching grating [3], the polarization interference [4], CCD (Charge-coupled Device) detection [5], and tunable F-P (Fabry-Perot) filter [6]. The optical spectrum of the matching grating method is usually within the range of a few nanometers, and the demodulation frequency is very low. Even when adopting some improvements, such as using an optical switch to widen the spectrum [7], the spectral range is also limited. The interference method is susceptible to the changes of environments which would lead to the bad stability of the demodulation results. The demodulation accuracy of the CCD detection method is relatively low. Tunable F-P filter method has significant advantages with the comprehensive comparison of factors like demodulation speed, spectral range, resolution, and capacity. This system is based on the tunable F-P filter method.
At present, there already exist many commercial demodulation systems at home and abroad. For example, Micro Optics, an American company, has presented many commercial systems like SM220 and Si425. In comparison with those systems, many methods have been applied to this system to improve the performance. Experiments have shown that this demodulation system has higher demodulation speed (4 kHz) and higher stability (2 pm) with the resolution of 1 pm than other demodulation systems.
2. High-Speed FBG Demodulation System
As illustrated in Figure 1, this system is composed of 6 parts: SOA (semiconductor optical amplifier) part, tunable F-P filter part, detection channels part, reference channels part, and signal acquisition and processing part. The SOA is driven by the constant-current source. The SOA thermostat circuit is specially designed to eliminate the influence of the temperature. The F-P filter is driven to scan fast around the center wavelength of 1310 nm with the spectral range of 40 nm at the frequency of 4 kHZ. The SOA, F-P filter, and other optical equipment form a loop structure and produce scanning laser light. The optical signals are converted to electric signals by photoelectric diode and then sampled by the high-speed AD converters. Finally, the algorithm in the FPGA analyzes the sample data and detects the FBG reflection wavelength.
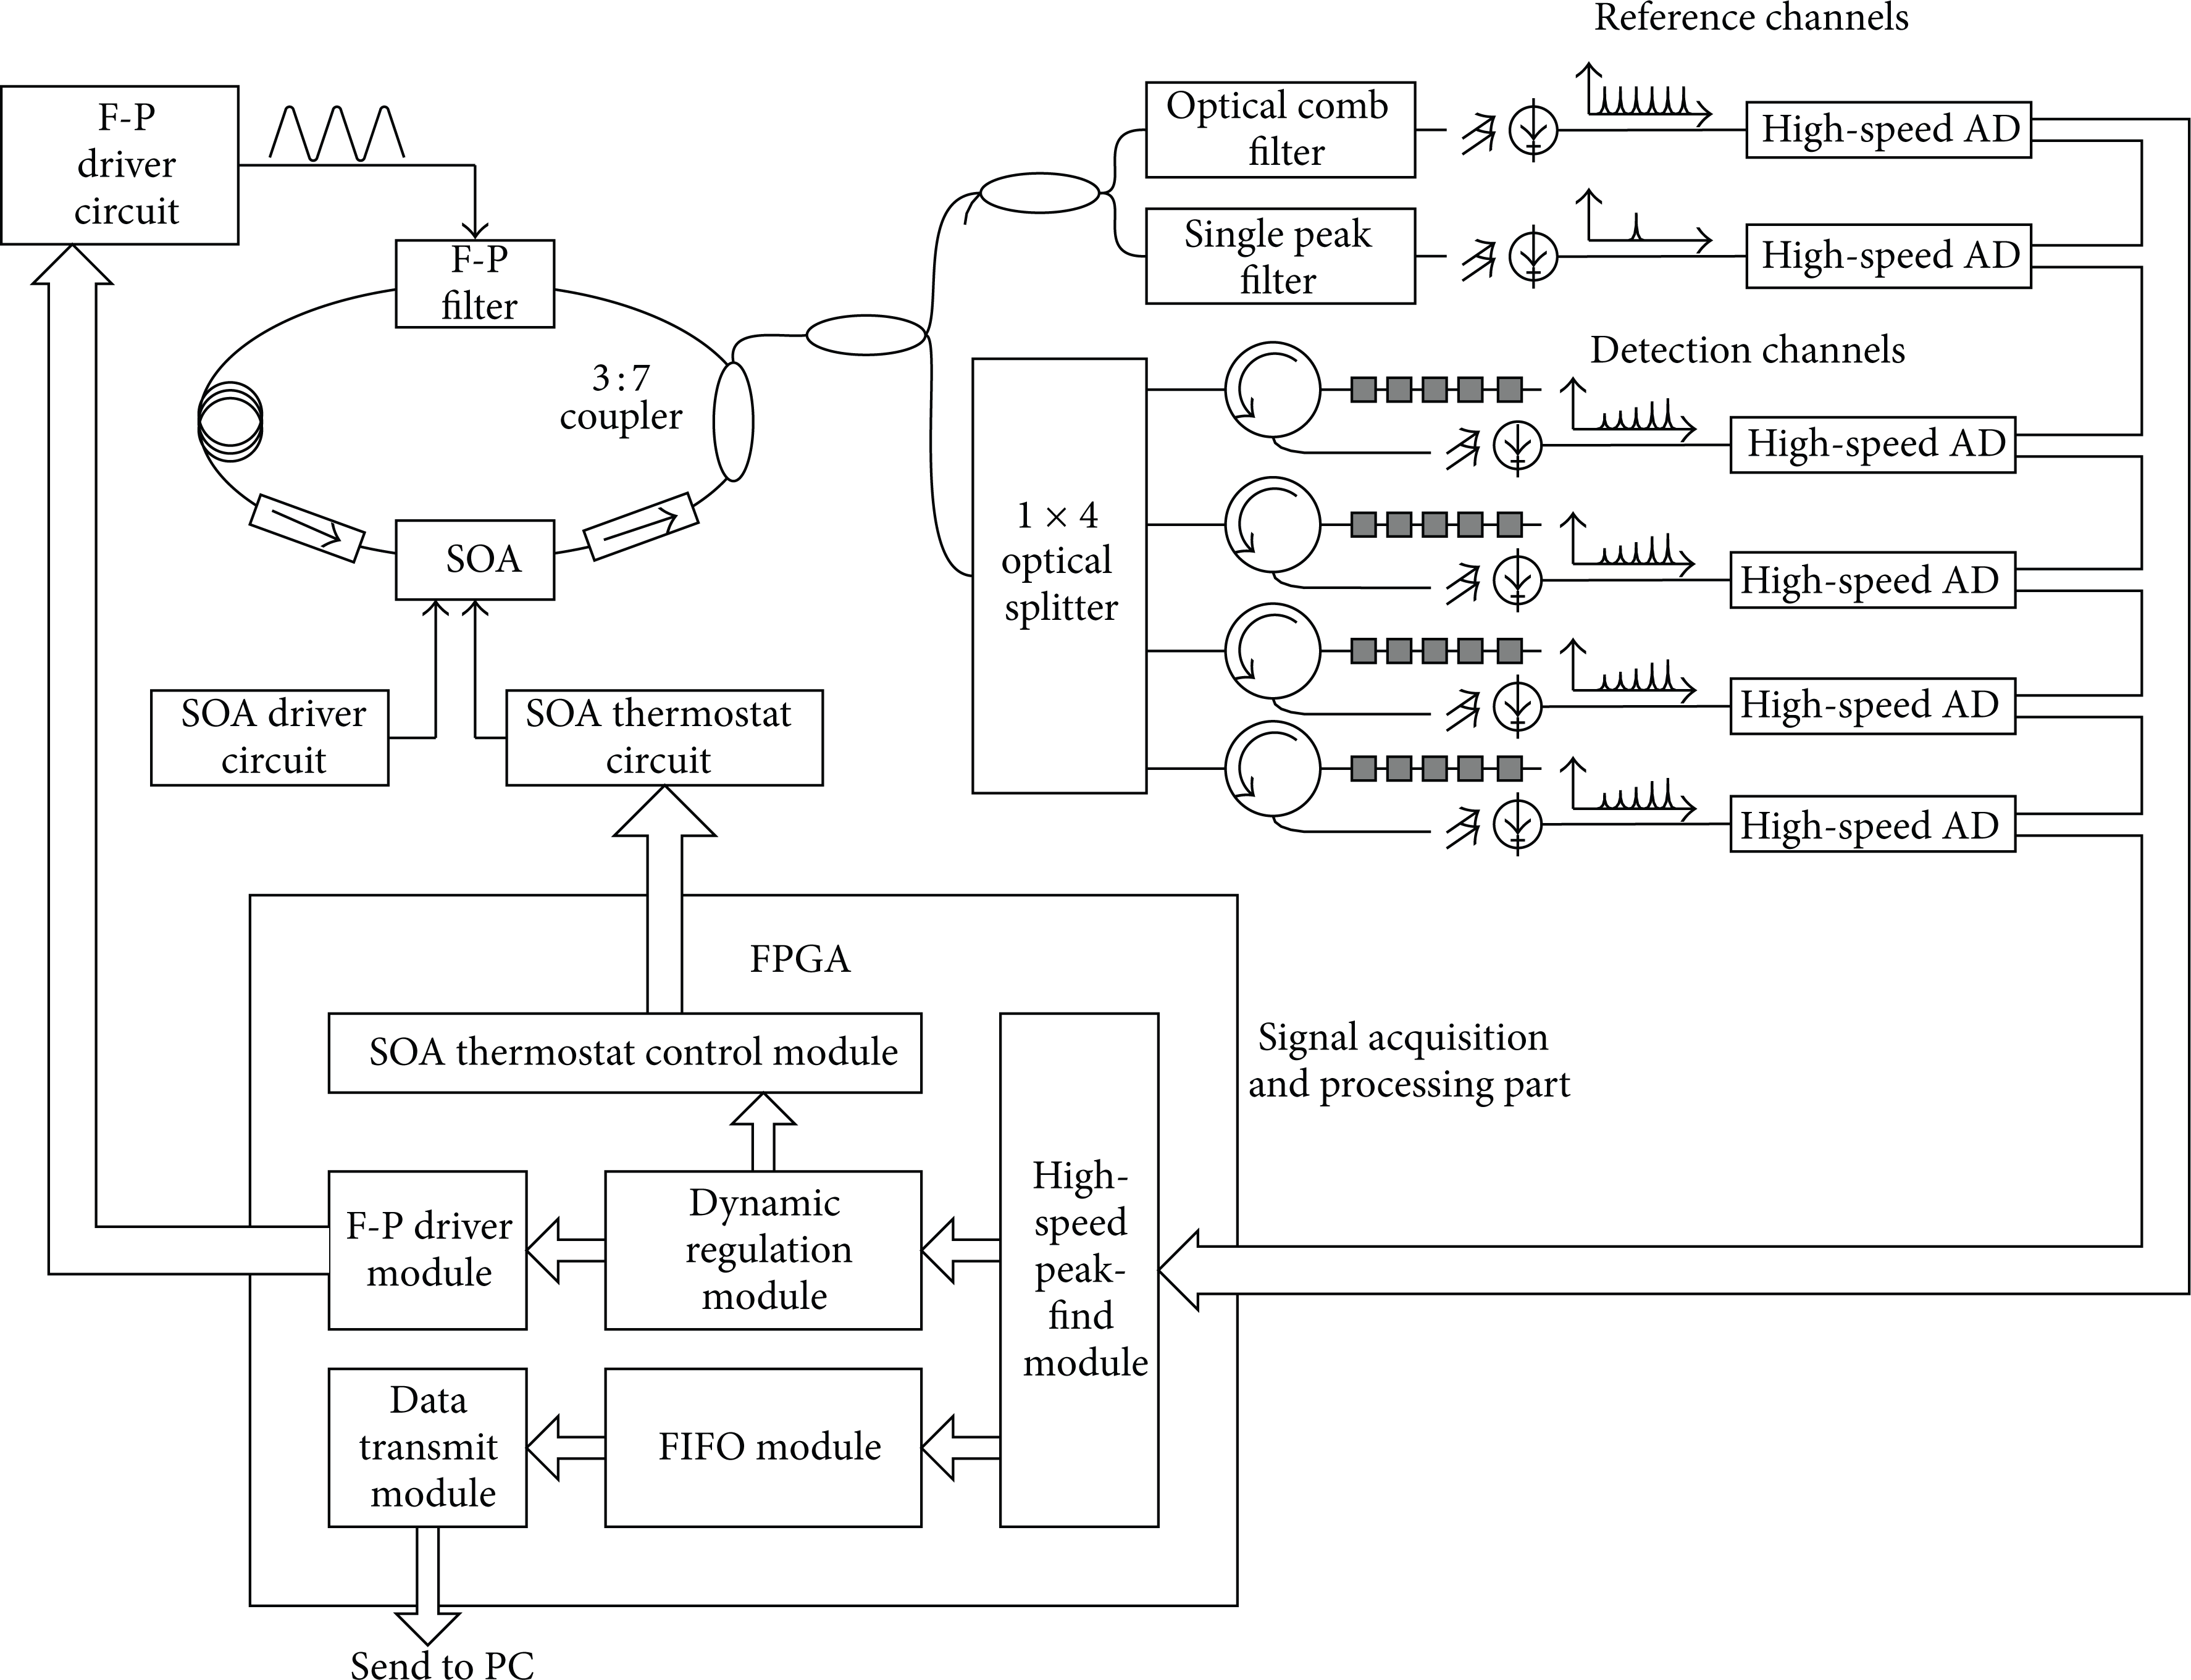
High-speed FBG demodulation system diagram.
PZT (piezoelectric ceramics) in the tunable F-P filter is a large capacitive load and has hysteresis effect, so both triangular wave and sine wave do not have good performances at high frequencies. This paper puts forward the triangular-like signal to solve this problem. The peaks and troughs of this signal are a smooth curve, while the slope is a linear line. As illustrated in Figure 2, the comb filter signal is observed when the F-P filter is driven by the triangular, sine, and triangular-like signal separately at the frequency of 4 kHZ. As shown in Figure 2(a), the comb filter signal is chaotic when the drive signal is the triangular wave. It is caused by the unevenness of the cavity length change of the F-P filter. It is uneven because the triangle wave is a superposition of sine waves with different frequency. The situation improves when using the sine wave, as shown in Figure 2(b). However, both sides of the output signal are sparse, while the middle dense as the sine wave is nonlinear. As shown in Figure 2(c), the output signals are equally spaced within the 50 nm optical spectrum. The triangular-like signal contains less frequency components. Therefore, it can reduce the nonlinear effect of the F-P filter perfectly.
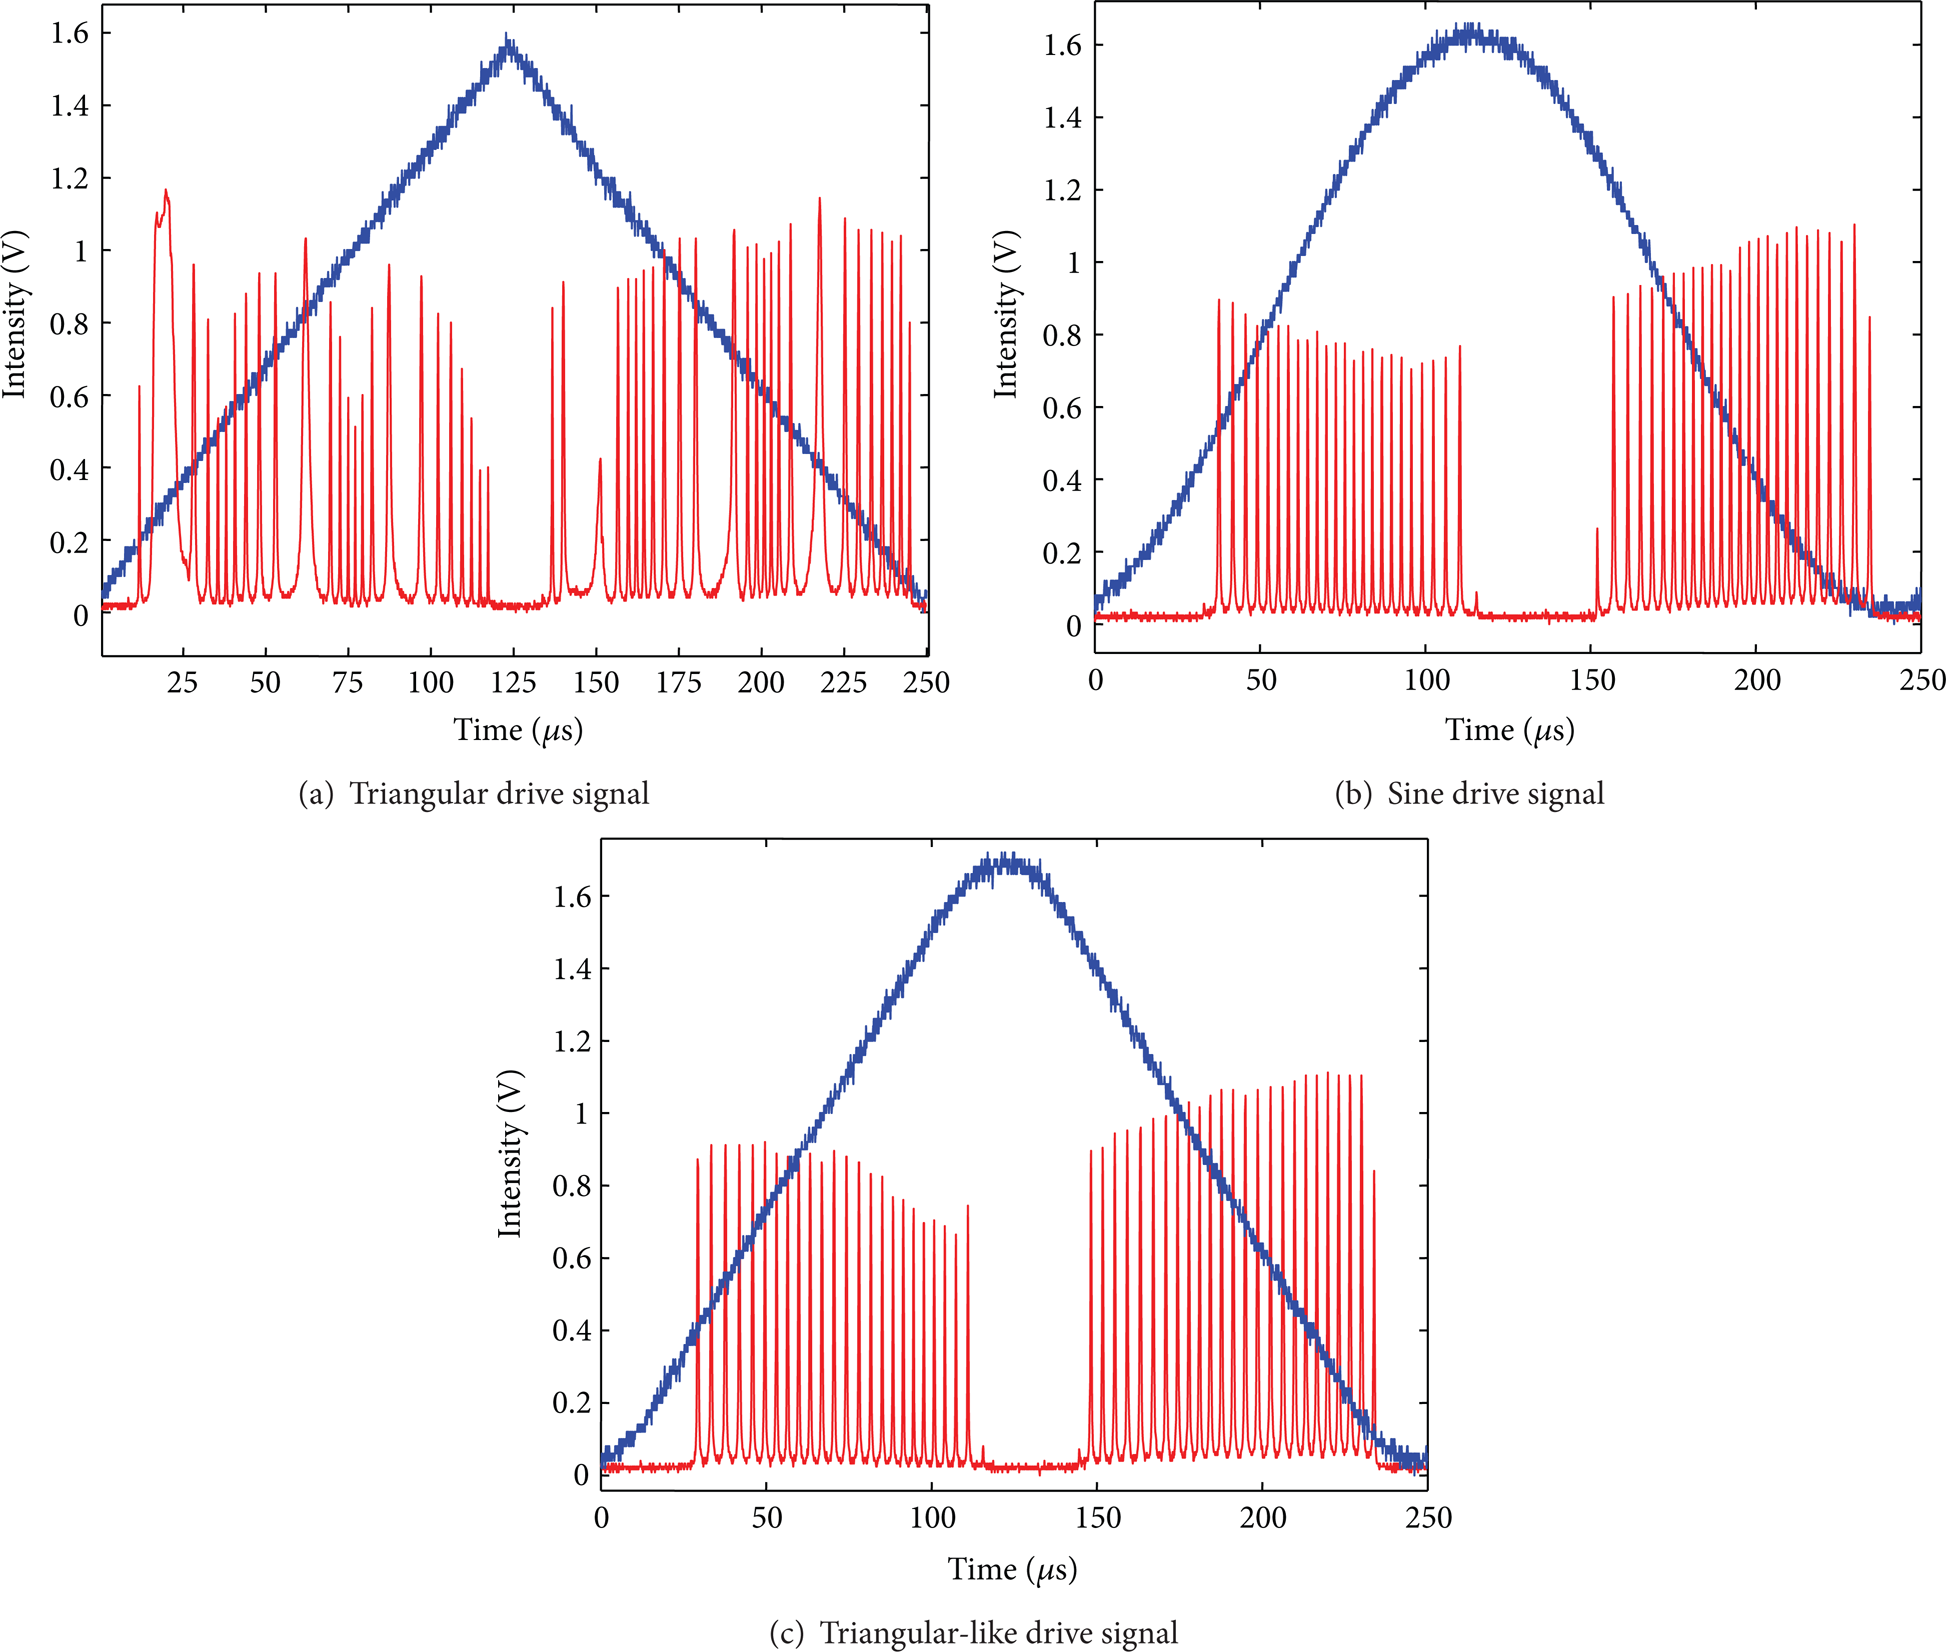
The output waveform of the optical comb filter at 3 kinds of the F-P drive signal.
Reference channels are applied to eliminate the nonlinear effect and the temperature drift effect of the F-P filter. The tunable F-P filter changes the output wavelength through the adjustment of PZT, but PZT regulation has nonlinear effect at high speed. Furthermore, the initial cavity length of the F-P filter [8]would change with the environmental temperature, which leads to the temperature drift effect of the F-P filter. Reference channels are composed of an optical comb filter and a single peak filter, both of which are etalon and made of the glass with zero temperature coefficients. So the reference channels are hardly affected by the changes of temperature. The output spectrum cycle of the optical comb filter is 2 nm, and the extinction ratio is 20 dB. So there will be 25 interference fringes in the spectral range of 50 nm, as illustrated in Figure 3 (CH2). The detected wavelength will be seriously affected if the drift is greater than 1 spectrum cycle of the comb filter. The single peak channel is specially added in reference channels to solve this problem. The single peak filter outputs only one peak signal (Figure 3, CH1, 1310 nm) in the spectral range of 50 nm. Since the reference channels are almost not affected by temperature, the wavelength of interference fringes and the single peak is definite. The detected reflection grating wavelength is corrected referring to the definite wavelength of interference fringes. This data correction eliminates the nonlinear effect of scanning laser light. Sampling points of the single peak signal will change according to the temperature drift effect of the F-P filter. This effect can be eliminated by regulating DC bias of the F-P drive signal according to this change and controlling the sampling point of the single peak signal in a certain range.

Signals of reference channels and detection channels.
Detection channels are composed of a 1 × 4 optical splitter, optical circulators, and FBG sensors. The light which enters detection channels flows into 4 channels by a 1 × 4 optical splitter and optical circulators. The light which is reflected back by FBG sensors is converted to electric signals by photoelectric diode (Figure 3, CH3 shows the signal of one detected channel) and then sent to FPGA for analysis.
The high-speed peak-find module in FPGA gets peaks position of 6 channels including the comb filter and the single peak filter. The maximum capacity of each channel is 64 FBG sensors through WDM technology. The dynamic control module finely tunes the F-P drive module and the SOA temperature control module according to the peak position of the comb filter and the single peak filter to ensure that the system is in the best working state. The high-speed peak-find module stores peak position data with FIFO module and then sends data to PC through the data transfer module by the Ethernet interface. The PC can show and store the wavelength of each FBG sensor of the 4 channels in real time.
3. High-Speed Adaptive Algorithm for Peak-Find
3.1. Algorithm Principle
The existing FBG demodulation systems usually collect a cycle of data in the process of peak-find [9]and process this data under the instruction of Gaussian transformation [10]. This method needs enough memory to store a cycle of collected data and consume a lot of instruction cycles, and thus not only affects the speed of peak-find but also limits the speed of the FBG demodulation system.
Therefore, a high-speed adaptive algorithm for peak-find is designed for the system. The algorithm locates the system states based on the current data and the last data (sampling value by AD converters) and detects the peak wavelength according to the system state. The state machine of this algorithm is designed as shown in Figure 3(a). Because the task of data collection and the task of data analysis can be done almost synchronously, the whole algorithm has a high speed of demodulation.
3.2. Algorithm Description
As illustrated in Figure 4(a), the algorithm module in FPGA has 6 states and transforms among these states based on the current data and the last data. Usually, the algorithm is on ready state and turns to rise state when the waveform data comes. If the current data is higher than the last data and also higher than the threshold for the first time, the algorithm will record the start position of the waveform. If the algorithm is on down state and the current data is lower than the threshold for the first time, the algorithm will record the end position of the waveform. Through these transformations, the algorithm can identify and save the data which contains the FBG peak information and discard the irrelevant or interfering data. Particularly, a “data valid confirmation” flag is set up. The algorithm can turn to the completion state or error state quickly by the analysis of the flag and the current state of the system. The error state is often caused by the system interference or the sample error of AD converter. As illustrated in Figure 4(b), when achieving the completion state, the algorithm analyzes the saved waveform data and detects the peak value finally. At first, the algorithm calculates the expectation value and quantile value (e.g., 75% quantile: take a value from a set of data, that is, 75% of all the data less than or equal to the value) of the saved waveform data. The degree of quantile can be chosen according to the actual demand, and generally we choose 75%. Yavr (the centroid value of the peak waveform) can be obtained by taking an average of the expectation value and 75% quantile value. Secondly, we get two values (X m and X n ) whose corresponding y-axis value is equal to Yavr. Thirdly, Xavr(the peak value) can be obtained by taking an average of X m and X n . And then the FBG reflection wavelength can be obtained by the calculation of Xavr values of FBG and reference channels.

(a) State machine of high-speed adaptive algorithm. (b) The sketch map of completion state.
The peak-find algorithm with high repeatability detects the peak position from the whole instead of the single sample point. Therefore, it can reduce the effects of system interference or sample errors of AD converters. Furthermore, the state of the algorithm is synchronized with the sample waveform, which can greatly save the storage space and the analysis time of waveforms. Experiment results have shown that the algorithm meets the requirements of the demodulation system.
4. Experiment Results and Analysis
4.1. Demodulation Accuracy and Linearity Experiment
22 cascade FBG sensors with different wavelengths are put in the hygrothermostat, and the high-speed FBG demodulation system is applied to demodulate these sensors at different temperatures. At the same time, a spectrometer is applied to monitor the wavelength changes of FBG sensors in real time. We can analyze the demodulation accuracy and linearity of the system according to the experiment results.
We change the temperature of the hygrothermostat from −5°C to 105°C and collect data every 10°C. Figure 5 shows the wavelength change of 22 FBG sensors at −5°C, 15°C, 35°C, 55°C, and 75°C.

Reflection wavelength of 22 FBG sensors at different temperatures.
We observe the wavelength change of one FBG sensor singly. Figure 6 shows the wavelength of the FBG sensor from 10000 times of measurements at 25°C. The x-axis represents sampling points and y-axis represents wavelength value. As we can see, demodulating value focuses on 1313.857 nm ± 2 pm, and the mean square error of 10000 times of the measurement is 0.9975 pm. Therefore, the stability of the FBG demodulation system is 2 pm and the resolution is 1 pm.
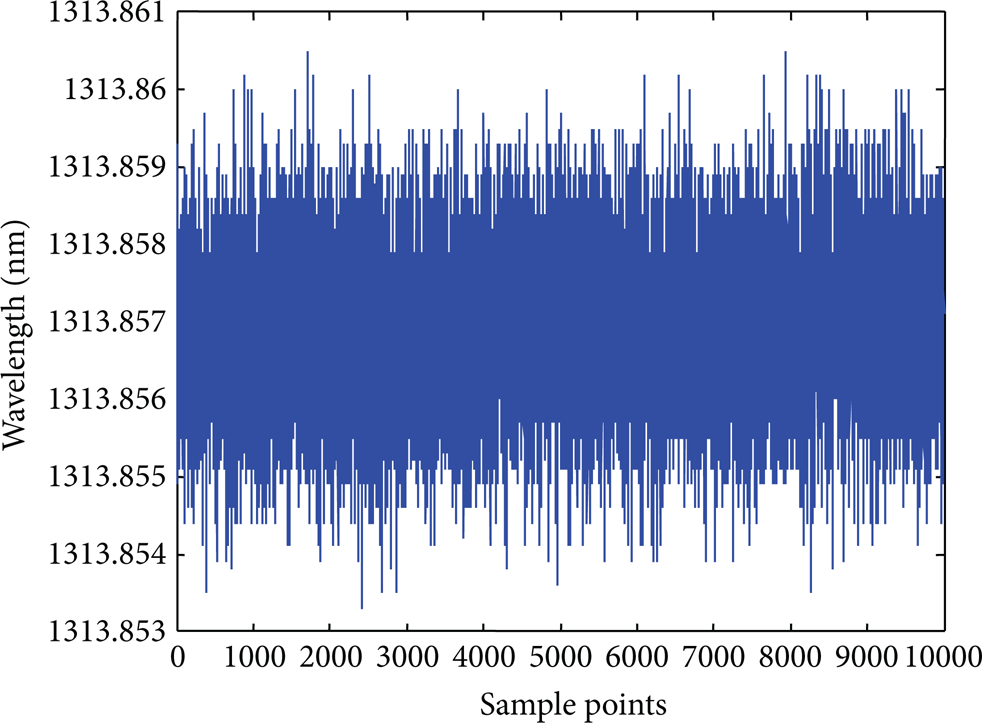
Wavelength of one FBG sensor at 25°C.
We observe the demodulation wavelength changes of this FBG sensor at different temperatures. As illustrated in Figure 7, demodulating wavelength increases about 335 pm when the temperature rises every 10°C. The R-square of the linear fitting of the 13 measuring points is 0.999, which shows that the demodulation system has a good linearity.

FBG sensor wavelength at different temperatures.
The reflection wavelength of the 22 cascade FBG sensors is acquired by the FBG demodulation system and the spectrometer at the same time. Figure 8 shows the comparison of both values. The x-axis represents wavelength measured by the spectrometer and y represents the FBG demodulation system. We do linear fitting of the 22 points. Its R-square is 0.99957. The RMSE is 0.0206 nm. So the demodulation system has a good linearity in the range of 40 nm, and its measurement accuracy is about 20 pm.
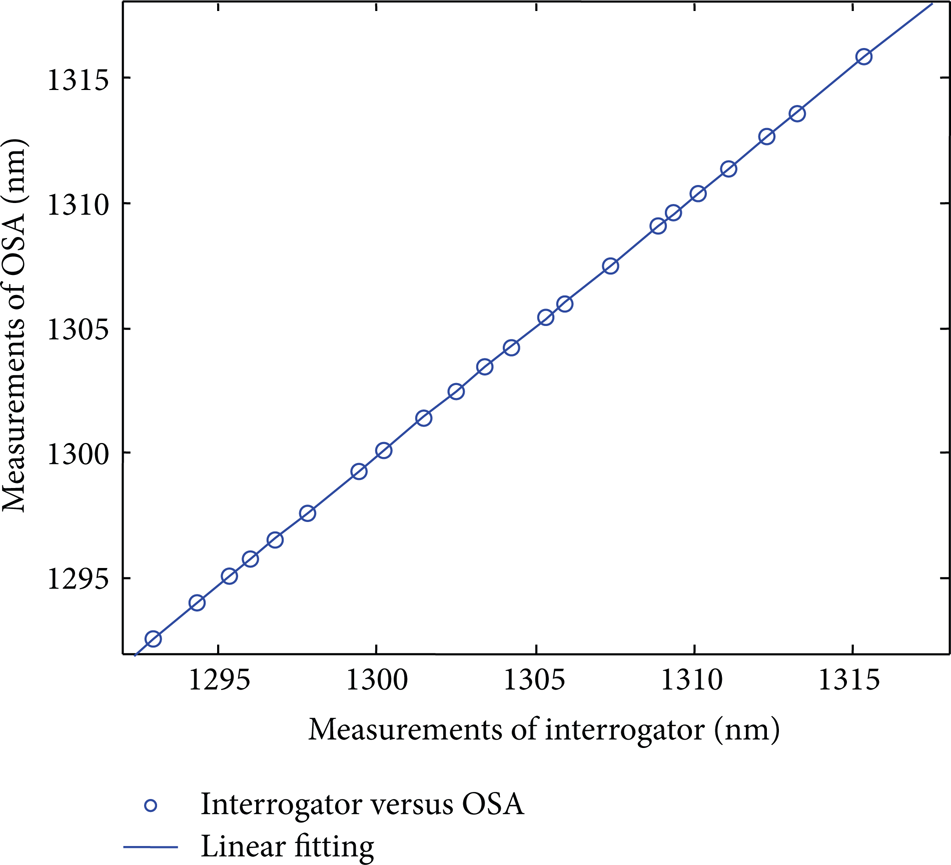
Comparison of demodulation results.
4.2. Demodulation Frequency Experiment
The demodulation frequency of the system is experimented by using the vibration experiment table (Denmark B&K Company). Figure 9 shows the FBG array model. Numbers 1 to 22 are the labels of FBG sensors. Dots A, B, C, and D are the fixed points of the vibration experiment table and dot E is the center of the vibration.
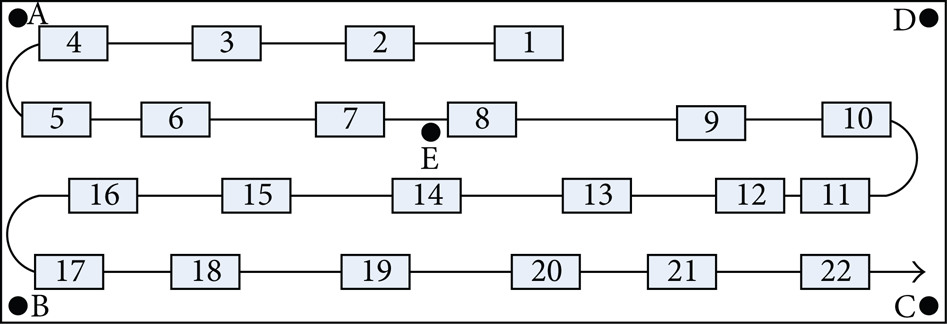
FBG array model.
The wavelength of these FBG sensors is demodulated by the high-speed FBG demodulation system at the frequency of 10 Hz, 100 Hz, 1000 Hz, 1500 Hz, and 1990 Hz. We can analyze the spectrum of the vibration signal by doing FFT of the wavelength. Figure 10 shows the stereoeffect of the vibration for the FBG array at the frequency of 100 Hz. In the figure, the x-y plane is the FBG array plane just shown in Figure 9, and the z-axis represents the vibration intensity of each FBG sensor. Apparently, the vibration intensity of number 8 FBG is the largest because this FBG sensor is the closest to the vibration center. The vibration intensity declines from the vibration center to the edge.

The stereoeffect of vibration for the FBG array.
Figure 11(a) shows the results of one FBG sensor at the frequency of 10 Hz. The previous waveform is the reflection wavelength of the vibration sensor, and x-axis represents sample points while y represents wavelength; the waveform in the middle is the spectral distribution which is acquired by making FFT of the wavelength, and x-axis represents frequency while y represents amplitude; the next waveform is the spectral distribution near the basic frequency from which the spectral distribution can be observed more clearly. As we can see, the frequencies acquired by the FBG demodulation system are 10 Hz, 1000 Hz, 1500 Hz, and 1990 Hz, and all of them are consistent with the experiment frequencies we have set. Experiments demonstrate that the demodulation system can analyze vibration signal in the range of 2 kHZ. Therefore, the demodulation frequency of the system is 4 kHZ.

The wavelength and spectrum of FBG sensors at 4 vibration frequencies.
5. Conclusion
This paper designs and realizes the high-speed large capacity FBG demodulation system which can demodulate 4 channels of FBG sensors at the same time. The system is very suitable for the dynamic monitoring of complicated mechanical equipment. It has solved the monitoring and diagnosis problems of many mechanical equipment which cannot be solved by traditional methods. The demodulation system has excellent stability and linearity by adding the reference channels, using the particular triangular-like drive signal for the F-P filter and applying the high-speed adaptive peak-find algorithm. The experiment results show that, in the optical spectrum range of 40 nm, the stability of the FBG demodulation system is 2 pm, the resolution is 1 pm, the linearity is 0.999, the measurement precision is 20 pm, and the demodulation frequency is 4 kHZ.
Footnotes
Acknowledgment
This paper is supported by the National High Technology Research and Development Program (863 plan) of China (no. 2012AA041203).