
Abstract
The paper focuses on the performance of floating buoys of a wave power generating jack-up platform called Haiyuan 1, in order to work out the optimum designed draft and hydraulic pressure. The performance of the buoy, especially its delivered power, is an important issue in designing oscillating buoy wave energy converter. In this case, major factors affect the performance including incident wave, designed draft, and hydraulic pressure on the buoy. To find out the relationship among design draft, hydraulic pressure, and delivered power, the key point is to precisely estimate wave induced motion of the buoy. Three-dimensional theory and time domain method based on potential theory were adopted in the paper. Unlike ship and other floating structures, motion of wave energy converter (WEC) buoy in wave will be weakened because of energy take-off, which will cause significant draft changing with time. Thus, draft changing should be taken into consideration as well. In addition, green water problem occurs more frequently than that in ship and other floating structures and also might the reduce delivered power. Therefore, green water problem will also be taken into account when choosing the optimum designed draft and hydraulic pressure. The calculation indicates that the optimum designed draft is 0.935 m, while the optimum designed hydraulic pressure is 30 kN.
1. Introduction
The ocean reserves extremely huge wave energy, which is as high as 103 to 104 GW [1]. In addition, because energy density of wave is about 4 to 30 times larger than wind, smaller area is required in wave farm under the condition of the same generated power. Therefore, wave energy utilization has a promising prospect [2]. At present, great progress has been reached in the field of wave energy utilization; even some wave power generating stations had become commercialized. However, the cost of electricity from wave power is still very high, about 5∼10 times higher than the price of traditional electricity. Therefore, in order to fulfill commercialized operation of wave power generating, further research is still required.
Oscillating buoy wave energy converter is one of the main types of wave energy converter; its wave energy absorbing system, the buoy, enables the transformation of wave energy into its kinetic energy and gravity potential energy by heaving in wave. Typical equipments such as Wavestar platform and Powerbuoy have shown competitive potential. The Wavestar, which is a wave generating platform built in Hanstholm, Denmark, had normally operated over two years. This Wavestar platform has two buoys, each of which has radius of 2.5 m, and its peak output power is 39 kW. Powerbuoy was invented by the Ocean Power Technologies (abbreviate as OPTs). OPTs built PB40 for a Spanish wave farm in 2008, which had jointed into the national grid of Spain. The wave farm is able to provide about 1.39 MW electric powers. This kind of WEC has the advantages of high generating efficiency and possesses commendable flexibility of scale of power generation. Hence, it will have a promising future.
The delivered power performance of the buoy is an important issue in designing an oscillating buoy wave energy converter. The delivered power of a WEC buoy refers to the work which the buoy has done to overcome the force produced by the system (such as hydraulic system) that connected to the buoy. In other words, it can be explained as the work the buoy transfers to the system. Obviously, its magnitude depends on the motion of the buoy and the force mentioned before.
Apparently, the motion of the buoy is induced by wave. In order to predict the wave induced motions, many methods and theories based on potential theory have been developed, such as two-dimensional strip theory, frequency and time domain method, and three-dimension theory [3–8]. Some are developed at first to solve the problem of ship or ocean platform motion in waves, then they are introduced to tackle with the wave energy extracting problem [9, 10]. Most authors usually deal with problems of motion of WEC buoy using time domain method because of the need of control, or because of strong nonlinear character of these problems. Although frequency domain method possesses advantages of simplicity and quickness, it cannot be adopted. In addition, 3D theory is more frequently adopted than 2D theory because most WEC buoys are designed to be rotators rather than slender bodies. For example, Ulvin et al. used time domain method and three-dimension theory to analyze power extraction capability of the BOLT [11]. Falcão et al. simulated the hydrodynamics of an oscillating buoy absorbing energy from sea waves also by using time domain method and three-dimension theory [12]. Generally, it seems that most of the authors calculated the related hydrodynamic coefficients at the mean draft and assumed that buoyance is always equal to gravity, instead of taking the effect of draft changing into consideration. However, draft changing might have an unnegligible effect on wave energy extracting problem. Because of energy delivered, the motion of the WEC buoy might greatly be attenuated, which will induce the draft of the buoy changing greatly, so the result is that hydrodynamic coefficients changing with time and unbalance of buoyance and gravity.
After motion of the buoy is calculated, deliver power of the WEC buoy can be obtained easily. However, because the problem of green water happens frequently in the process of energy extracting, green water need to be taken into consideration in order to judge the performance of the buoy.
The paper focuses on the performance of the buoy of a wave generating jack-up platform called Haiyuan 1, which was designed by Zhejiang Ocean University. Three-dimension theory, time domain method will be used in the paper, and besides, energy delivery induced draft changing will be taken into consideration as well. Following the Introduction, the platform will be introduced in Section 2. Section 3 is devoted to theoretical aspects about analyzing the performance of the buoy. Force on the buoy is analyzed; then the simplified force model is described, along with the motion equation of the buoy and computational formulas of wave forces. The numerical method to solve the motion equation is also presented. Finally, the results of computation and some conclusions are going to be revealed in Sections 4 and 5.
2. The Wave Power Generating Platform and the Buoys
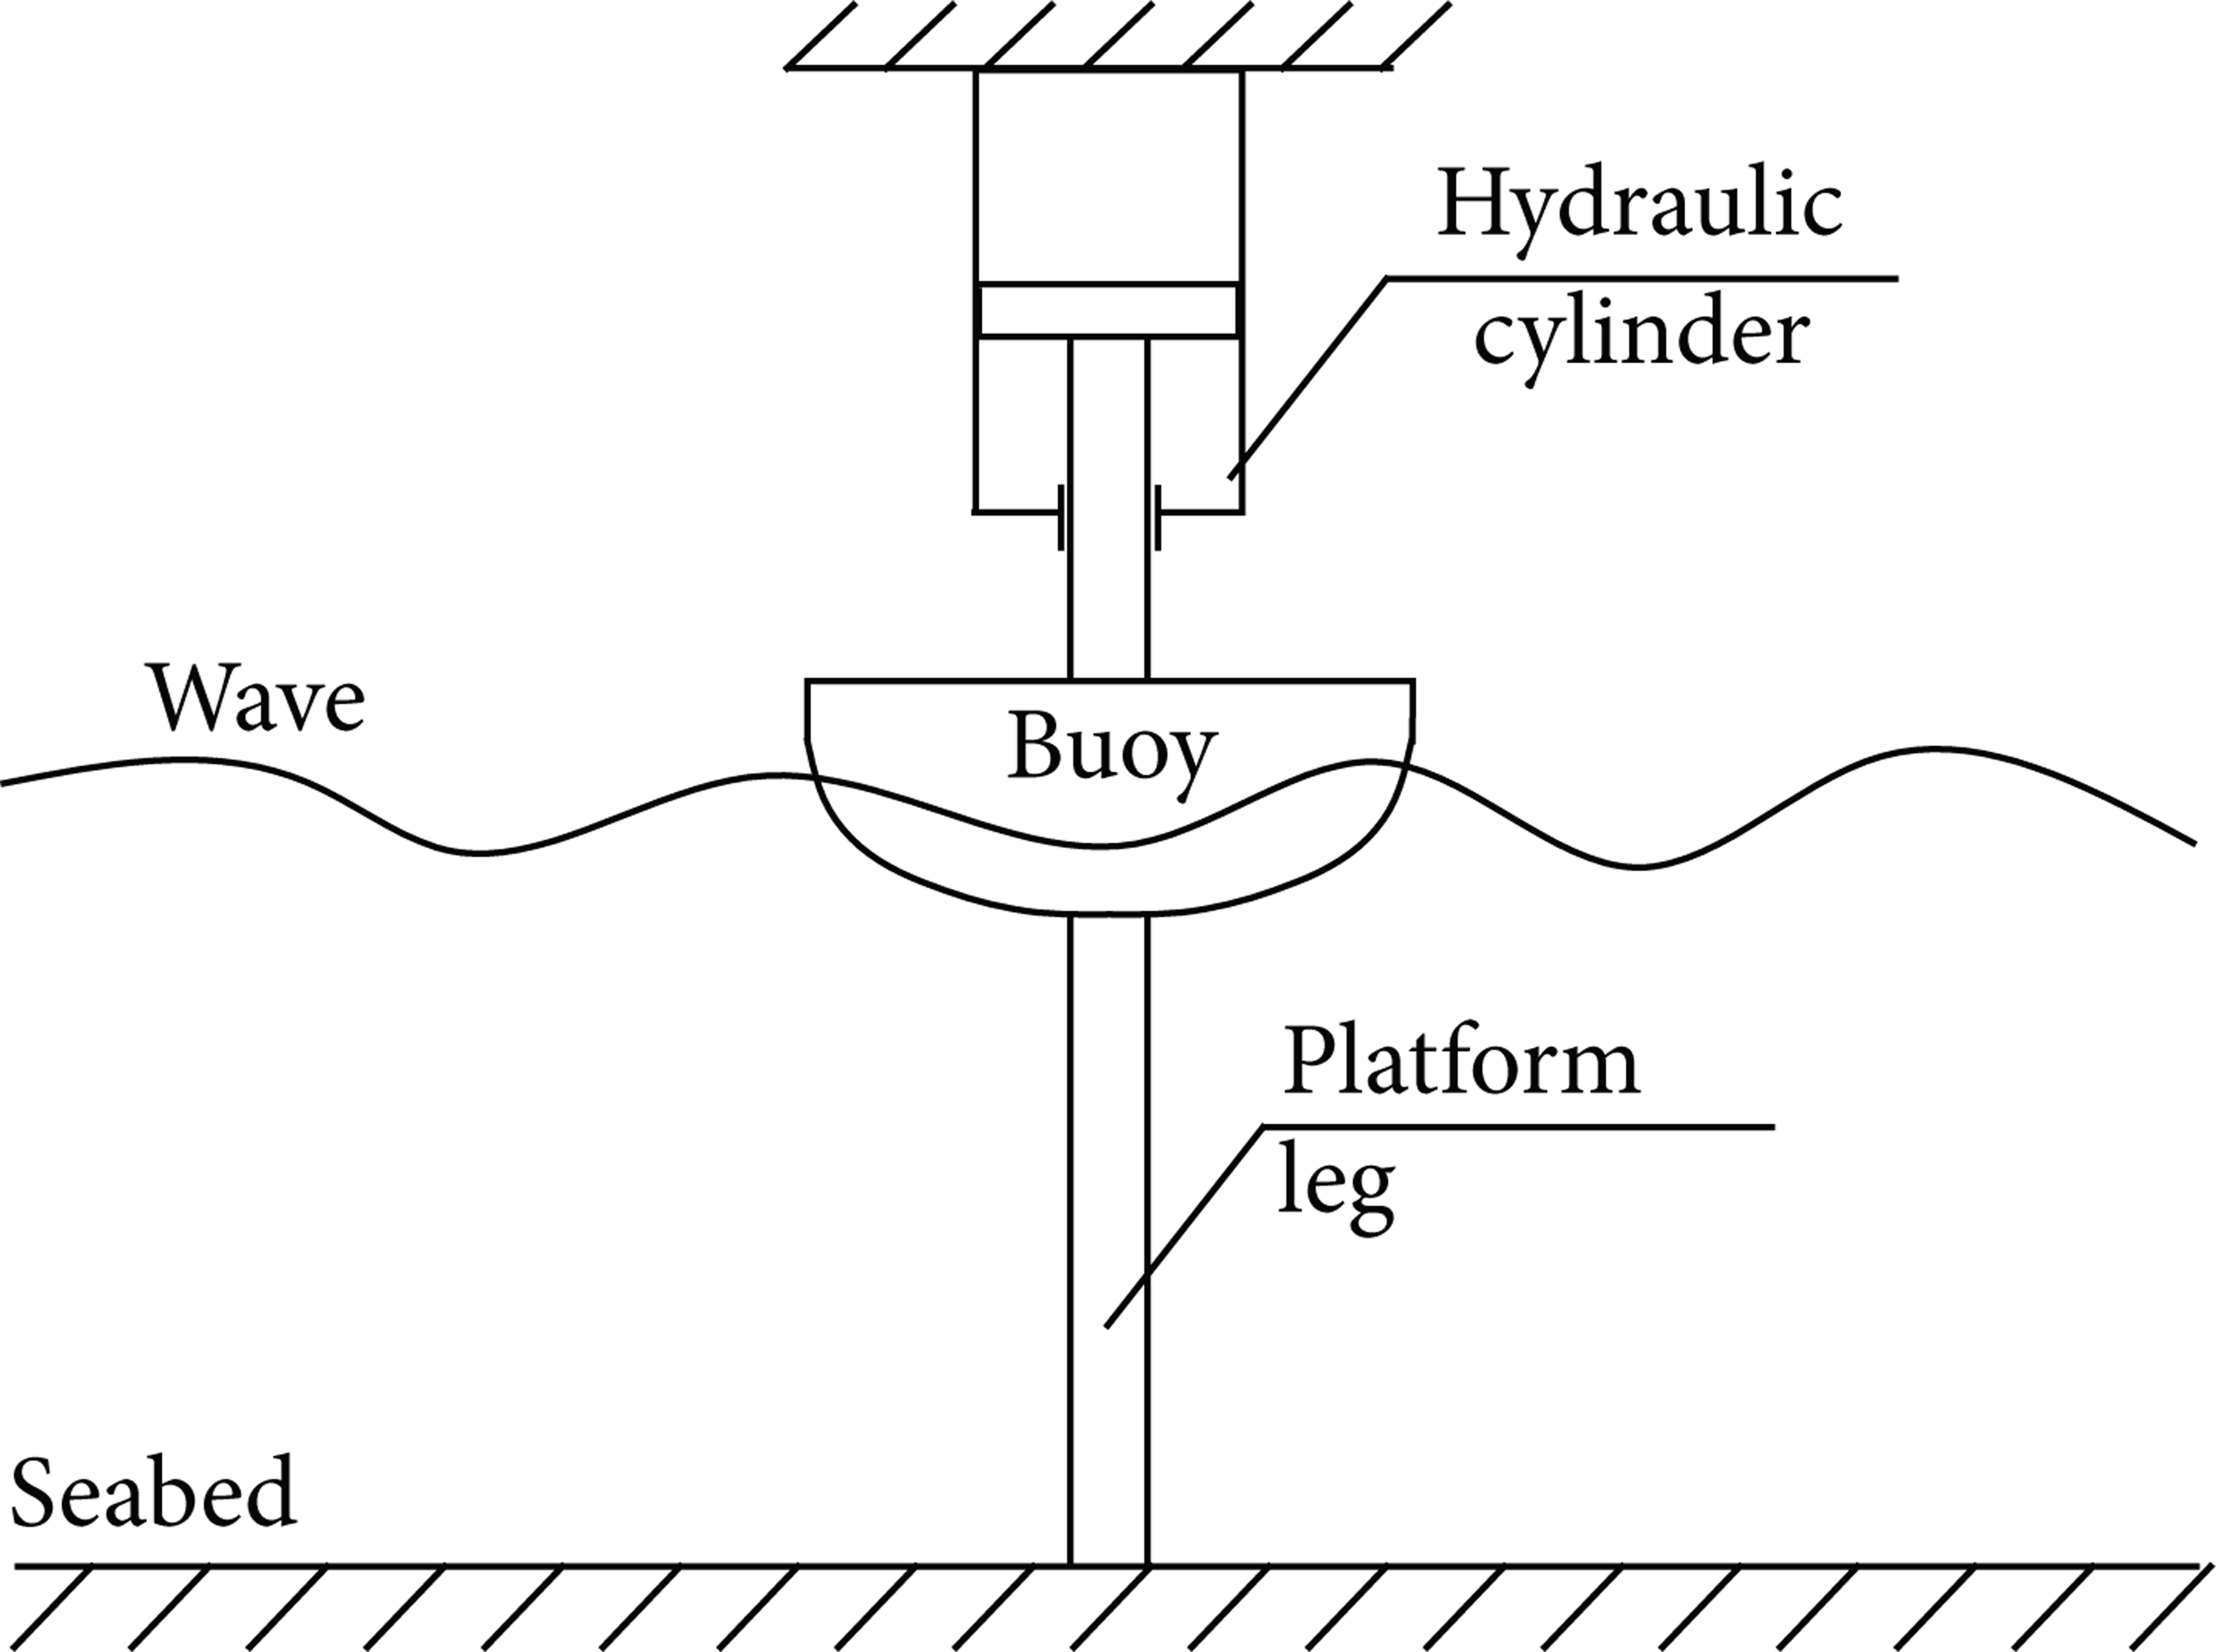
The building of the wave power generating platform has been finished; now it is placed at Dongsha in Zhoushan, China. The Haiyuan 1 prototype in Dongsha is shown in Figure 1. It mainly consists of a supporting jack-up platform, three wave energy collecting modules, hydraulic system, and electricity take-off system. The supporting jack-up platform is made up of a platform body, three platform legs, and three pile shoes. It has the function of supporting, load bearing, and keeping core equipment away from seawater and preventing them from corrosion and damage. In addition, the platform legs can also be viewed as guiding poles, which can guide the floating buoys during vertical motion along the legs. The three floating buoys are settled on platform legs, each buoy conjoins with two tooth profile columns, which connect with a group of hydraulic cylinders. The buoys and the tooth profile columns compose the wave energy collecting modules (see Figure 2). The design can ensure the equipment working normally regardless of the sea level changes. The motion of the wave energy collecting modules drives the hydraulic system to work, finally propels the electric generator outputting electricity. The hydraulic system uses bidirectional hydraulic transmission form, which enables the buoys to drive the hydraulic system continuously by moving up or down. So, electricity can be continuously taken-off. Besides, hydraulic energy accumulators are stalled in the hydraulic system, which can store hydraulic energy and stabilize the fluctuate energy.

Haiyuan 1 wave power generating jack-up platform.

Wave energy collecting module.
Designed wave of the WEC is a regular wave, which has wave height of 1.53 m and period of 6.2 s. The shape of the buoy is one of the important factors in designing. The buoy used in the Haiyuan 1 is a rotator. Its projection on plane XOZ is shown in Figure 3. Its maximum diameter is 3.2 m, and its moulded depth is 1.465 m. Surface of the buoy consists of two parts, the upper part is a cylindrical surface, and the other part is a rotated curve surface where the projection on plane XOZ can be described as the following function:
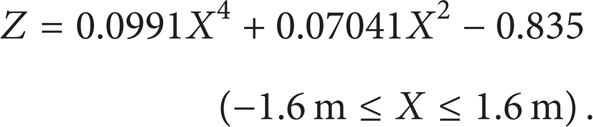

Shape and dimensions of the buoy.
3. Theoretical Analysis
In order to work out the optimum design draft and hydraulic pressure, wave induced motion of the buoy under different design drafts and different hydraulic pressures should be calculated first, and then delivered power of the buoy can be worked out; consequently, relationship among design draft, hydraulic pressure, and delivered power will be obtained. On the basis of the relationship, the optimum design parameters can be easily found out.
Cartesian coordinates x, y, and z are used with z = 0 and the plane of the equilibrium free surface and the +z-axis directed upwards.
3.1. Simplified Force Model
The interaction effect between the buoys is ignored; in this case, only the performance of a single buoy under the designed wave is concerned. A simplified model is used for describing the buoy and the surrounding conditions (as Figure 4 shows).
Simplified model for research
The forces acting on the buoy include vertical wave force, horizontal wave force, buoyance, supporting force by platform, and friction between buoy and platform leg, as well as hydraulic pressure (see as Figure 5). Because the forces are complex, a simplified force model for research is necessary. Obviously, the horizontal wave force and the supporting force have the same magnitude but in opposite direction; hence, these two forces can be canceled out. The friction between buoy and platform leg is rolling friction, so the friction coefficient is equal to 0.05, which plus the horizontal wave force usually will obtain a small value; thus, the friction between platform leg and the buoy can be ignored. Therefore, the remaining forces on the buoy are hydraulic pressure, buoyance, gravity, and vertical wave force. So, the simplified force model of the buoy can be described as Figure 6 shows.

Forces acting on the buoy.
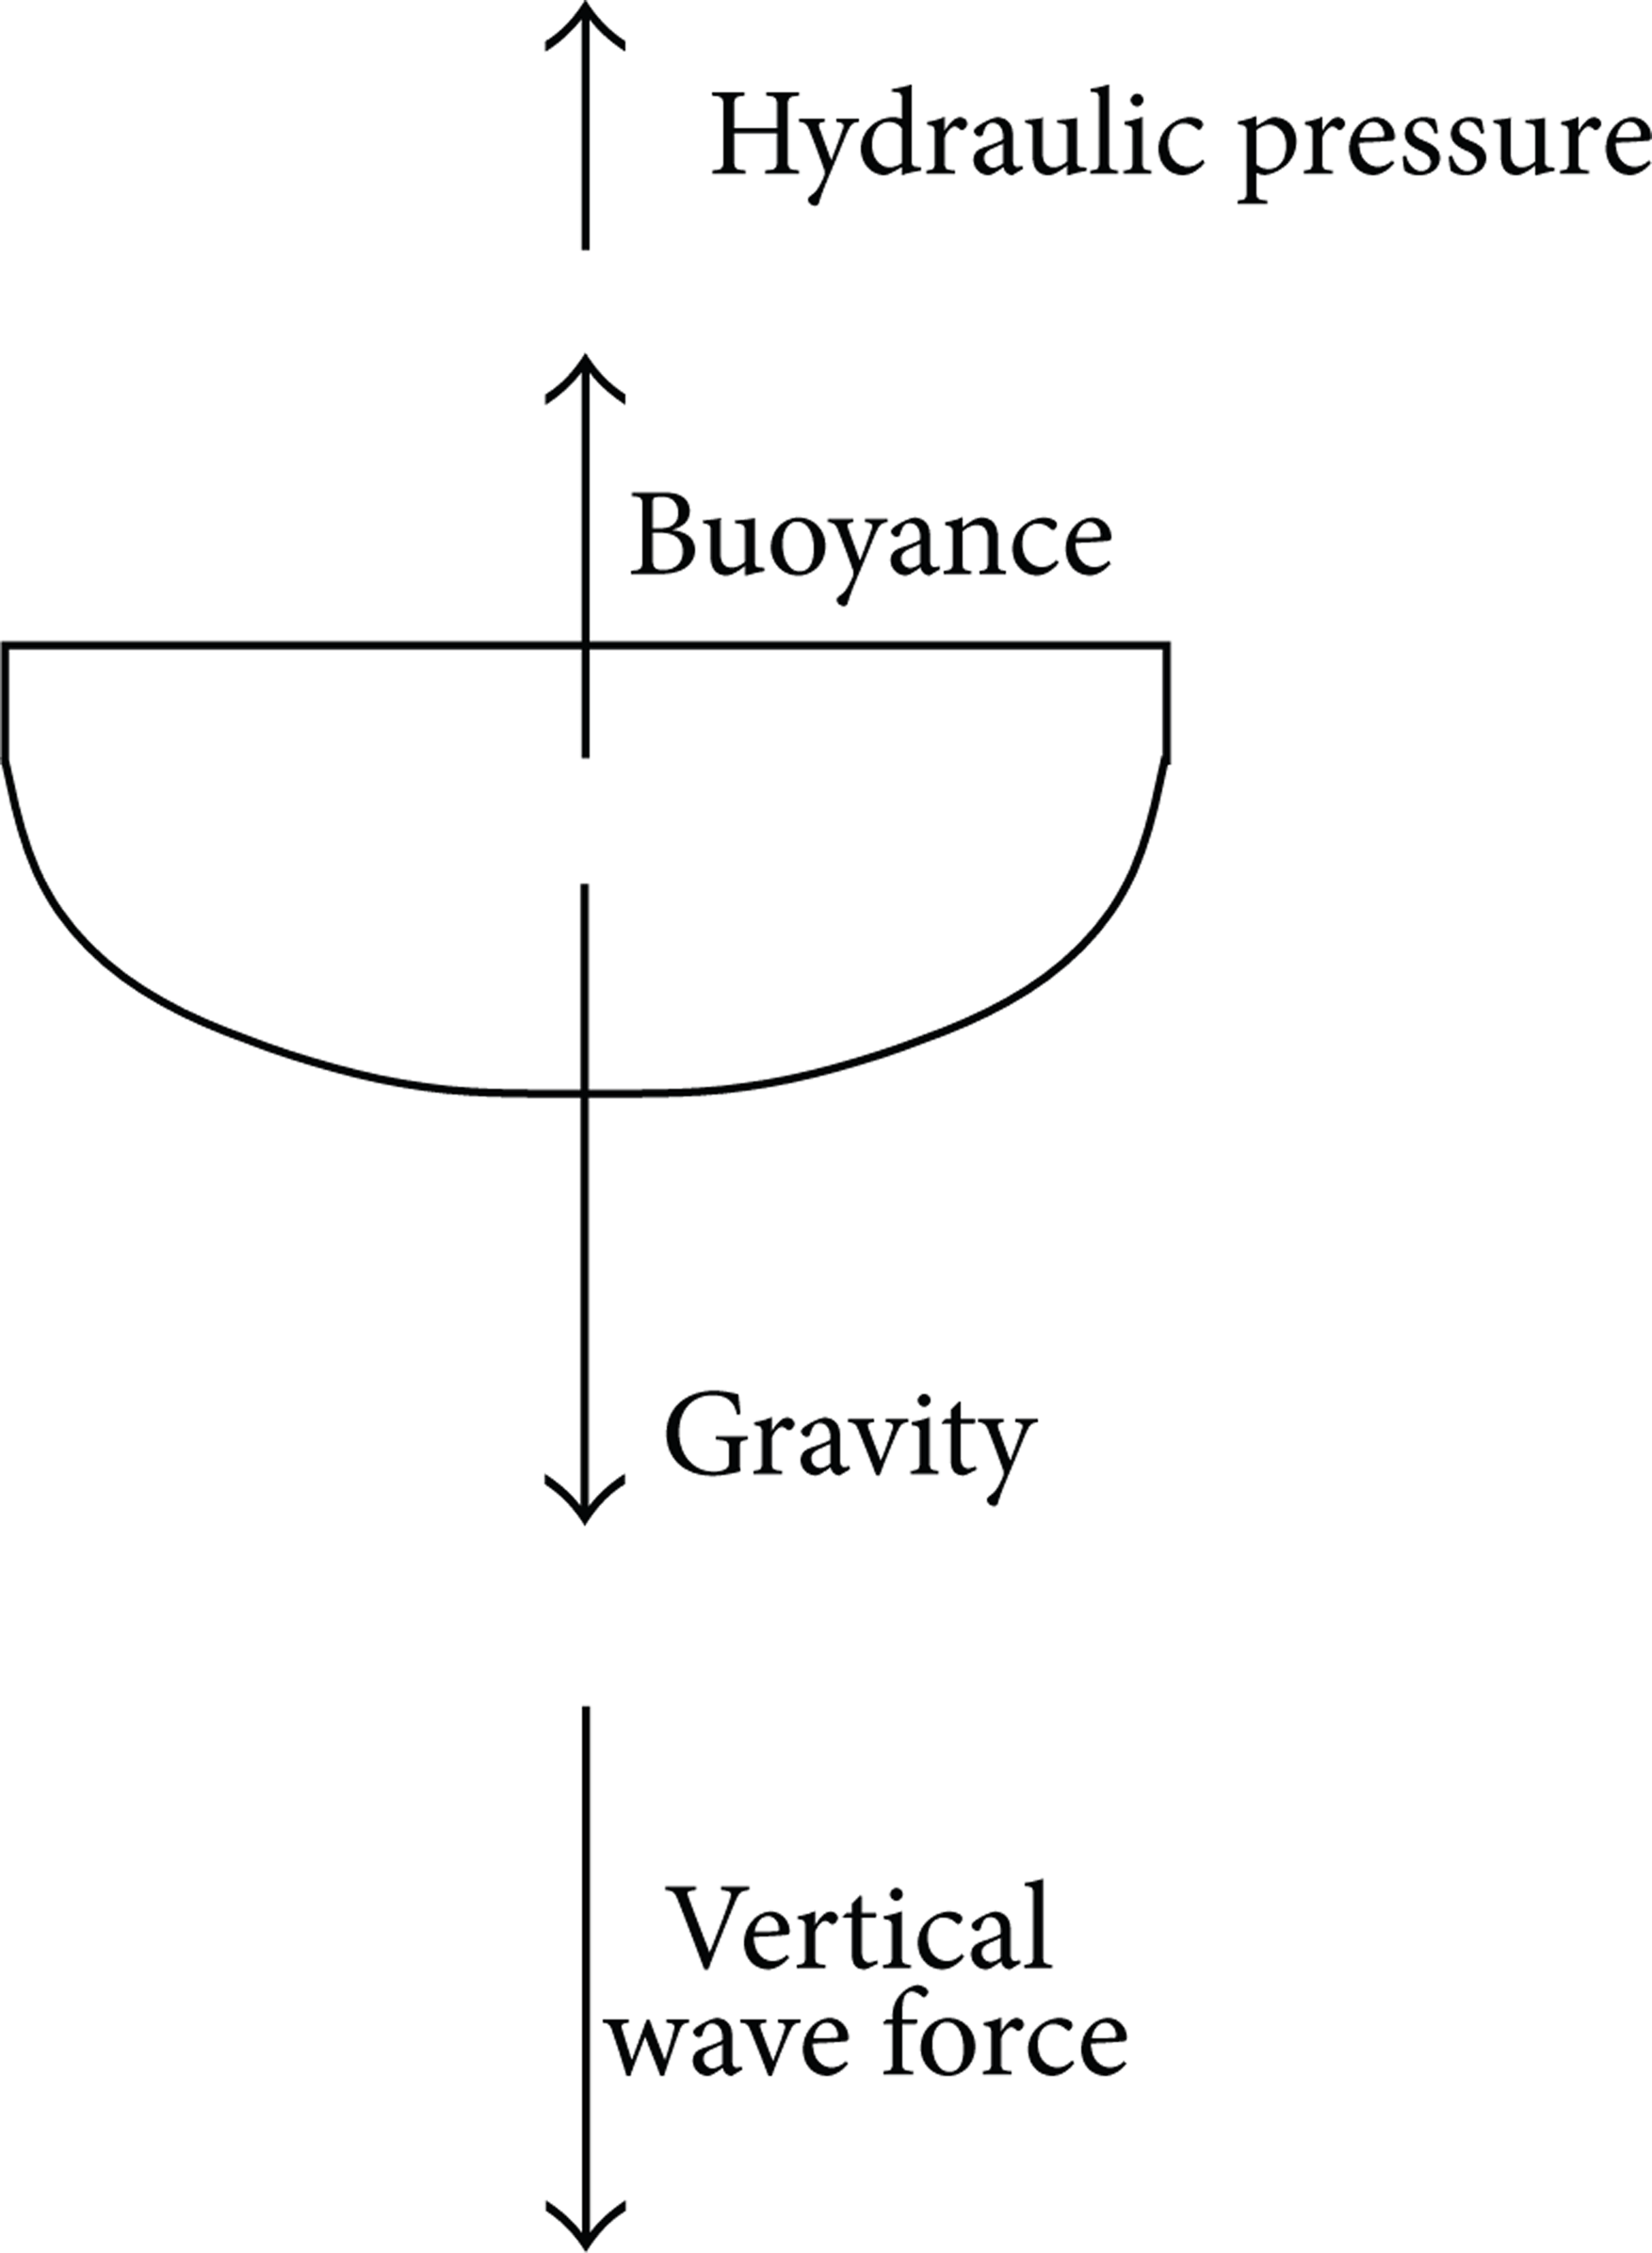
Simplified force model.
3.2. General Motion Equation
To analyze the performance of the buoy, wave induced motion should be reckoned out first. Usually, to analyze the motion of a ship, buoyance and gravity are regarded as an equal [13, 14]. Therefore, in most situations, the motion equation do not contain the term of buoyance and gravity. However, unlike the motion of a ship or an ocean platform in wave, the motion of the buoy would be greatly weakened by hydraulic pressure when the Haiyuan 1 is generated. On this occasion, buoyance and gravity contribute greatly to the motion; more importantly, they are always in the state of imbalance, so the buoyance and gravity of the buoy should be taken into consideration in the motion equation. In addition, hydrodynamic coefficients also vary with draft. A recent paper from Fang et al. provides a reasonable method considering the hydrodynamic coefficients changing with time when discussing the effect of added resistance from bow flare [15]. Because the effect of imbalance of buoyance and gravity in ship motion is unapparent, the authors did not take it into account. In this paper, the method of Fang is improved, and the unbalance of buoyance and gravity is taken into consideration as well. Therefore, the following motion equation is used:

In the above equation, M, g, and F f represent mass of the buoy, acceleration of gravity, and buoyance, respectively. Hydrodynamic coefficients such as added mass m, radiation damping coefficient B, and restoring spring coefficient C varied with time t because draft changes with the motion at any instant. FHP denotes the hydraulic pressure on the buoy.
Assuming incident waves are unidirection regular waves, then wave elevation ξ can be described as the following cosine function:

where ξ a , ω, and k are the wave amplitude, wave frequency, and wave number, respectively.
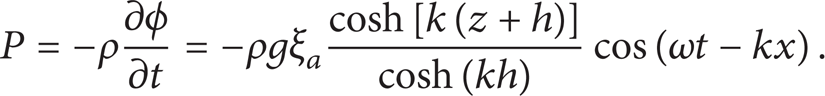
Supposing sea water flow as a potential flow, incident velocity potential ϕ can be presented as follows [16]:

where h refers to water depth.
Dynamic pressure P on the buoy is appropriated for the linearized Bernoulli equation according to [17]
Exciting force F e can be approximated by the combination of incident wave force and diffraction force. If D/λ < 0.2 (where D is the characteristic dimension and λ refers to wave length), diffracted component can be neglected, only incident wave force will be concerned [18, 19]. This is known as Froude-Krylov Approximation. Based on Froude-Krylov Approximation, F e can be express as

in which n is an outward normal vector on surface dS. S(t) is instantaneous wet surface at time t; it depends on the instantaneous draft of the buoy d(t). The instantaneous draft of the buoy d(t) can be described as
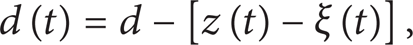
where d represents the initial draft, which is a designed draft. And z(t) represents the vertical displacement of the buoy.
Restoring spring coefficient is determined by the equation of C(t) = ρgAwp(t), where Awp is the waterline plane area at instant t. Added mass and radiation damping coefficient can be solved by the source distribution method, and the concrete method can be obtained from [20, 21].
The buoyance of the buoy can be calculated by the following equation:

Because of the hydraulic accumulators, the magnitude of hydraulic pressure acting on the buoy by hydraulic cylinder is approximately constant when the buoy is moving. Besides, its direction is always opposite to the velocity of the buoy. Thus, hydraulic pressure can be presented as follows:

where K is a constant.
3.3. Numerical Method for Solving the Motion Equation
Because of the complexity of the forces and the variation of hydrodynamic coefficients, we cannot get the analytical solution of the equation. To solve this motion equation, numerical method is necessary. Method of time marching process and explicit improved Euler method are adopted. The progress of time marching process has been used in solving the motion equation as Figure 7 shows.

Progress of time marching process used in solving the motion equation.
3.4. Average Delivered Power of the Buoy
Direction of FHP is always reverse to the velocity of the buoy, so the average delivered power of the buoy can be presented as follows:

where T is period of the incident wave.
If the magnitude of FHP is a constant, and the motion of buoy is inline with Figure 8, then the average delivered power can be presented as follows:


Periodic motion of sinusoidal form.
4. Result of Computation
First part of this section concerns the validation of the computation data by comparing to the real sea test. The other parts release the computation data under the condition of design wave.
4.1. Validation of the Computation Data
In order to verify the computation data, a comparison to test data from real sea state has been made. Figure 9 is the result from computation and Figure 10 is from the test. Both results are obtained under the conditions of wave height of 0.9 m, initial draft of 0.835 m, and FHP of 24 kN. Both of the two figures have similar shape, and both have residence time on top and bottom of the curves. By comparing it to computation result, the test curve has less residence time on top and more on bottom. It is because the real incident wave is not sine-shaped; it is similar to the profile of Figure 11. The shape of the computational curve can also be verified by comparing it to reference [22]; both have similar shape as well. In addition, both have approximate amplitude. The amplitude of computation result is approximately 0.28 m and the amplitude of the test is 0.23 m. In general, though some differences exists, the approach to calculate the wave induced motion of the buoy is reliable.

Computation result under the conditions of wave height of 0.9 m, initial draft of 0.835 m, and FHP of 24 kN.

Test result under the conditions of wave height of 0.9 m, initial draft of 0.835 m, and FHP of 24 kN.

Shape of sea wave.
4.2. Motion Characteristic of the Buoy
The situation when FHP is larger than the gravity of the buoy is not taken into consideration. Because in this situation, the buoy could not move down; it would stop moving when incident waves could not have enough force to push it up.
Vertical displacement relative to the equilibrium free surface could be obtained after the motion equation being solved. Two groups of curves are presented when d = 0.835 and d = 1.035 m, and each group describes the changing vertical displacement of the buoy under different FHP, as seen in Figures 12 and 13. Obviously, these groups of curves have distinct similarity. They share the following laws:
period of motion is same as that of incident wave;
phase lag increases with the rising FHP, as well as residence time of the buoy at the place of maximum and minimum vertical displacement.

Vertical displacement of the buoy when d = 0.835 m.

Vertical displacement of the buoy when d = 1.035 m.
For comprehensive and richly detailed analysis, Figures 14, 15, and 16 were drawn according to the vertical displacement curves.
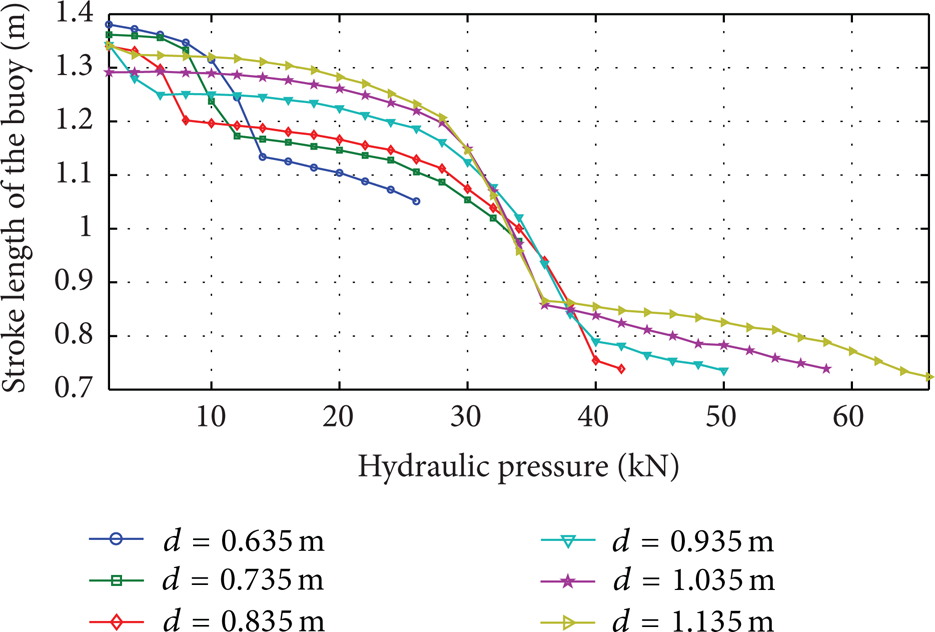
Stroke length of the buoy.

Maximum draft of the buoy.

Minimum draft of the buoy.
Figure 14 reflects the relationship between stroke length of the buoy and hydraulic pressure FHP under different designed drafts. Stroke length of the buoy refers to the maximum vertical displacement minus the minimum vertical displacement of the buoy in a period. It is clearly shown in Figure 14 that the overall trend of the motion is attenuated with the increase of hydraulic pressure FHP. The trend is nonlinearity. Take the curve of d = 1.035 as an example; stroke length decreases slowly from 1.3 m in 2 kN to 1.2 m in 28 kN, and then it drops sharply to 0.86 m in 36 kN. This is followed by a slowly attenuation trend until the end of the curve.
Figure 15 provides the relationship among maximum dynamic draft, designed draft, and FHP. And Figure 16 provides the relationship among minimum dynamic draft, designed draft and FHP. Maximum draft increases with the rising FHP, while minimum draft decreases. The trend of these two groups of curves is almost near linear. In addition, slopes of curves in each group are approximately equal to each other. Every 10 kN increases of hydraulic pressure correspond to 0.1 m increases of maximum draft, while every 10 kN increases of hydraulic pressure correspond to 0.1 m decreases of minimum draft.
4.3. Rate of Work and Capture Width of the Buoy
Figure 17 shows the relationship between hydraulic pressure and delivered power of the buoy in different drafts. It is clearly shown in Figure 17 that delivered power increase with the rising designed draft when hydraulic pressure is lower than 30 kN. When designed draft is no more than 0.735 m, the delivered power of the buoy increases with the rising hydraulic pressure; while when designed draft is no less than 0.835 m, each curve will first climb to a peak value then will decrease little, after that it will continue increasing.

Delivered power of the buoy.
5. Conclusion
In the premise that the delivered power of the buoy ensured a high value, hydraulic pressure should be as small as possible. On one hand, if hydraulic pressure is too large, the buoy might hardly be driven when income wave is small. In this situation, the wave energy could not be absorbed. On the other hand, large designed hydraulic pressure would reduce the reliability of the hydraulic system and increase the cost and the building difficulty of the hydraulic system. Figure 17 shows that 30 kN is considered to be a suitable hydraulic pressure, because many curves reach a peak point near this value.
After hydraulic pressure is chosen to be equal to 30 kN, Table 1 can be obtained from Figure 17.
Delivered power and maximum draft under different designed drafts when FHP = 30 kN.

The moulded depth of the buoy should be larger than that of the maximum draft; otherwise, green water problem will occur, which will lead to practical delivered power less than the computational result. Therefore, because the moulded depth is 1.465 m, maximum draft should be smaller than 1.465 m. When hydraulic pressure is equal to 30 kN, delivered power and maximum draft increase with the rising designed draft (as seen in Table 1). When designed draft is no less than 1.035 m, the maximum draft of the buoy is larger than its moulded depth; thus, the best designed draft should be 0.935 m.
A conclusion that can be drawn from the above analysis is that the optimum designed draft is 0.935 m, while the optimum designed hydraulic pressure is 30 kN.
Footnotes
Acknowledgments
The authors would like to thank the State Oceanic Administration of China for financially supporting this research under Contract no. ZJME2011BL04. This work was also supported by the Research Foundation of the State Key Ocean Engineering Laboratory of Shanghai Jiao Tong University under Contract no. 1205 and the Zhejiang Provincial Natural Science Foundation of China under Contract no. Y5100180.