
Abstract
Fault tolerance is the key technology in wireless sensor networks which attracts many research interests. Aiming at the issue that the nodes' failures affect the network's stability and service quality, a vascular-network-based fault-tolerant routing algorithm is presented by nonuniform hierarchical clustering. According to the distribution characteristics of the vascular network and inspirations to the fault tolerance for wireless sensor networks, a mathematical model and network topology are, respectively, established. It applies the improved particle swarm optimization (IPSO) to the nonuniform hierarchical clustering, and multipaths are established between the neighbor hierarchical nodes based on the best-worst ant system (BWAS). It introduces the normalized values of the pheromone generated by the ants as the selection probabilities of transmitting paths to establish the hierarchical routing. Theoretical analysis and simulations show that the algorithm has higher packet receiving rates, lower average transmission delay, and balanced energy consumption. It has the good performance in fault tolerance and stability of data transmitting, and it avoids the hot issue in energy consumption and achieves the network load balance.
1. Introduction
Due to the characteristics of dynamic variation of the topology, no center ad hoc network and the constraints of the resources in wireless sensor networks (WSNs), as well as the unpredictability of the working scenario, such as the vibration and electromagnetic interference, it is prone to unbalance of energy consumption, poor quality of data transmission, and routing instability [1, 2]. So they have great influence on the key technologies, including average transmission delay, packet receiving rate, and average energy consumption, which closely correlate with the network's stability, accuracy, and reliability. They also weaken the reserved function and bring greater challenges to the existing network technologies, especially for the application in the complex scenario and necessity for strict performance, just like condition monitoring for key facilities and poisonous gas, emergency, and disaster releasing.
The network with good performance should have the integrity of the fault features, the accuracy of fault diagnosis, and fault recovery efficiency. It can perform well in the robustness of nodes’ interconnection, accuracy of data transmission, and against the fast energy consumption as well as the malicious invasion. It also can make a timely diagnosis, find a reasonable control decision, and continue to provide high-credibility computational services by adaptively handling the anomalies of the network. Fault tolerance is the key technology in wireless sensor networks which has attracted great attention and becomes a hot issue that needs further study [3].
Fault tolerance in wireless sensor networks is a complex system problem which includes fault prevention, detection, isolation, diagnosis, and recovery [3]. It mainly includes the optimization of each layer's protocols or algorithms and joints optimal control among multilayer and hardware fault tolerance [4–6]. Fault tolerance in the network layer [7] and collaborative optimization among the layers are to be the important direction. Fault tolerance in the network layer is to explore the mechanism of multirouting data transmission [7], network coding [8], and so on. The mechanism of multirouting data transmission is to reestablish a path or select one from the multirouting table established in advance to realize the fault tolerance when the source node confirms that the fault exists in the transmitting routing, namely, the redundancy routing fault tolerance [9–11]. Network coding is to transmit the encoded data along multipaths and realize the fault tolerance by decoding and reconstructing the data at sink node, that is, the redundant data fault tolerance [12–14]. The combination of a variety of fault-tolerant methods or collaborative optimization with other layers will achieve the good result [7, 15]. The mechanism of multipath data transmission and network coding improves the stability of data transmission and network load balance. However, it increases the computational complexity, transmission delay, and energy consumption.
Fault tolerance based on the principle of bionics and modern intelligent bionic algorithms has recently been attracting growing research interests in the study of wireless sensor networks. They include biological immune system mechanism, the fuzzy diagnosis, the expert system, the artificial neural network, the particle swarm optimization, ant colony algorithm, and genetic immune algorithm. They provide good ideas and methods to the fault-tolerance and show better fault tolerant effect in wireless sensor networks. For example, the ant colony algorithm with the advantage of swarm intelligence is introduced into the routing establishment in the network layer; the particle swarm algorithm is introduced into the topology establishment with its characteristics of fast clustering convergence to improve the efficiency of clustering; artificial neural network or its combination with the fuzzy algorithm is applied to forecast the perception data to realize fault tolerance in the application layer; genetic algorithm can be applied to the data unit coding to improve fault tolerance of the data transmission in the link layer or network layer.
It has already shown the good performance and advantages when introducing the mechanism of biological immune system into the fault tolerance in wireless sensor networks [16–23]. Some basic research works have been done in this aspect. Bokareva et al. have presented a fault-tolerant architecture SASHA based on the biological immune system, in which the lymph mechanism is used to produce the detector for fault detection, and the thymus mechanism is used to complete the fault diagnosis. This structure cannot only identify the known fault model, but also provide a good adaptive ability of learning and evolving to the unknown fault model [16]. Jabbari and Lang apply the mechanisms of biological immune system to the security detection and fault tolerance by simulating the mechanisms of self-learning, self-organization, and memory and information processing in the biological immune system or the nerve immune system [17]. Atakan and Akan propose the new distributed node and rate selection method (DNRS), which is based on the principles of natural immune system to select the minimum number of sensor nodes based on the B-cell stimulation in immune system to transmit the data to the sink and select the appropriate reporting frequency of sensor nodes to achieve the minimum energy consumption [18]. Rui et al. propose an immune system inspired approach to locally discover and recover from losses of query messages at sensor nodes, similar to antibodies in an immune system [19]. Chen et al. propose a neighborhood node selection algorithm to decide if a sensor node is activated or not according to the B-cell and T-cell models of immune systems by comparing the similarity between artificial immune system and wireless sensor networks [20]. Hu et al. present a hybrid routing scheme and an immune cooperative PSO algorithm for fault-tolerant routing problem [21]. In [22], uniform immunization and temporary immunization are conducted on small worlds of tree-based wireless sensor networks to combat the sensor viruses. Salmon et al. propose an intrusion detection system (IDS) framework inspired by the human immune system to monitor their neighborhood and to identify an intruder [23]. Mechanism of biological immune system or immune algorithms can also be applied in routing optimization, intrusion detection, nodes’ deployment, target coverage, and performance optimization.
This paper will explore establishing the nonuniform hierarchical clustering based fault-tolerant routing algorithm by the bionic intelligent algorithms according to the characteristics of vascular network and inspiration to fault tolerance based on the preliminary studies. It will carry out the fault tolerance studies by combining the routing establishment with the topology design to improve the network's performance of stability and reliability. The main work and contribution of this paper is: (1) to study the structure and characteristics of the vascular network and the inspirations to the fault tolerance and to establish the mathematical model and network topology; (2) to study the IPSO and BWAS, making these intelligent algorithms more optimal and more suitable for resource-restrained network; (3) to study the nonuniform hierarchical static clustering by applying the IPSO; (4) to study the routing establishment by applying the BWAS.
It innovatively establishes the hierarchical fault-tolerant topology based on the vascular network and uses the normalized values of the ants’ pheromone as the selection probability of the transmission paths to establish the fault-tolerant routing by improved intelligent algorithms. Deference with previous studies in the methods of fault tolerance in the network layer is not to simultaneously establish multipaths or backup paths for each relay node, but to temporarily select the path with maximum normalized values of the pheromone between the two neighbor hierarchical nodes to establish the optimal transmission route. If this node fails, then it selects the other node as the substitute, in which the path is with the second maximum normalized values of the pheromone as the backup transmission path to realize the fault tolerance. The new reestablished transmission path is not from the source node to sink node but from the node ahead of the fault node to the sink node by the selection probability. Furthermore, the intelligent algorithms are improved to fit for the source-restrained network.
The rest of this paper is organized as follows. Section 2 studies the mathematical model of the vascular network and topology. Section 3 presents the nonuniform hierarchical clustering algorithm based on the improved particle swarm optimization (IPSO) and the fault-tolerant routing algorithm by the best-worst ant system (BWAS). Section 4 carries out the simulations and analysis to evaluate the performance. Finally, Section 5 concludes the paper and discusses the future work.
2. Mathematical Model and Network Topology
2.1. Mathematical Model
The vascular network is the fractal tree-like branching network. It has the complex structure with the characteristics of the fractal [24]. Great differences exist among the different sections of the vascular in the structures, physical characteristics, and functions. Different sections have different blood flowing rate. It has the properties of stability, flexibility, connectivity, and multiconnectivity. Blood flows in the directed way according to the pressure difference that exists between any two points. Blood flow has quantitative relationship with current velocity, cross-section, and the pressure.
The characteristics of the vascular network give an important inspiration to the establishment of fault-tolerant routing in WSN. The nodes are hierarchically marked to have the hierarchy differences according to distance to sink node to ensure the directed data transmission. Different clustering probabilities are adopted in different hierarchical areas. Finally, it forms the distribution with different density and scale of the clusters in different hierarchical areas, which has a similar topology with the vascular network model. The vascular-network-based topology has multipaths connectivity and uses the pheromone normalized values generated by ants in ant colony algorithm as the path selection probability to establish the optimal transmission routing to realize the fault tolerance.
The vascular-network-based mathematical model has the following characteristics. (1) Pressure differential network. Each node in WSN has the differential pressure value

where
2.2. Network Topology
Definition 1.
Hierarchy: nodes in WSN are marked with different hierarchies according to the distance from the average node to sink node. The nodes belonging to the same hierarchical area are marked with the equal hierarchy value, that is,

where
2.2.1. Nonuniform Hierarchical Clustering Topology
The topology is established based on the theory and characteristics of vascular network. (1) The nodes in the network are divided into two categories: the average nodes and clustering nodes. Average nodes are responsible for data collection and transmission. Besides this, clustering nodes have the functions of data receiving, forwarding, and routing addressing. The network routing is established among the clustering nodes. (2) The network is divided into different hierarchies by the distance to the sink node. The nodes in the same hierarchical area have the same hierarchy value, and the routing is established among the clustering nodes with different hierarchies. (3) It is the directed weighted graph with connectivity between any two nodes in the network. Each link has different weight; the data propagation and message broadcasting have directions according to the nodes’ pressure gradient. (4) Different quantity and scale of the clusters are presented in different hierarchical areas. Larger quantity and smaller scale of the clusters are presented in the areas with smaller hierarchy values and so does the opposition in the areas with higher hierarchy values. (5) Multipaths will be established between the nodes that are the neighbor hierarchical within their transmission power coverage. The normalized values of the pheromone are used as the probabilities to select the transmitting path. The link with maximum probability is to be selected as the transmitting path. The established physical topology of network is shown in Figure 1.
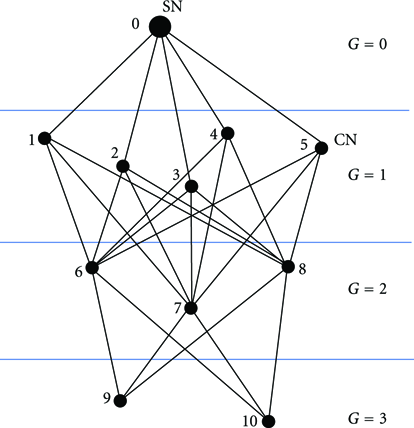
Physical topology of the network.
Figure 1 shows the network's topology based on the vascular network. It is divided into 3 hierarchies. Node 0 is the sink node, and nodes 1–10 are the clustering nodes. The nodes 1–5 in hierarchy 1 are responsible for the data fusion, receiving the data from the nodes in hierarchy 2 and retransmitting the data to the sink node. Nodes 6–8 in hierarchy 2 are responsible for data fusion in their respective clusters and retransmitting the data from nodes in hierarchy 3 to nodes in hierarchy 1. Nodes 9 and 10 in hierarchy 3 are only responsible for the data fusion and transmitting the data to the nodes in hierarchy 2. For example, node 7 in hierarchy 2 will establish the transmission path with nodes 1–5 in hierarchy 1 and nodes 9-10 in hierarchy 3 within its transmission power coverage excluding the nodes 6 and 8 which belong to the same hierarchy. And the value
The fault tolerance of the topology is owing to the normalized value of the ants’ pheromone used as the selection probability of the transmission path, and it selects the path with the maximum probability as the transmission path. For example, the pheromone on the links connecting the node 7 in hierarchy 2 with the nodes 1–5 in hierarchy 1 is different, that is,
2.2.2. Establishing Rules
The topology will be established based on clustering model. The nodes are functionally divided into average nodes (ANs) and clustering nodes (CNs). The routing is established among the hierarchical clustering nodes. The clustering node is to establish the transmission paths only with neighbor hierarchical nodes, not the same hierarchical ones. It establishes the transmission path with all the neighbor hierarchical nodes within the transmitting power coverage. Only one path is to be selected as the actual transmission one, and the rest are the backup transmission paths. The establishing rule is shown in Algorithm 1.
Suppose
If
If
else
end
end
Where hierarchy of node k. transmission path.
2.2.3. To Determine the Clustering Probability
Different clustering probabilities are adopted in different hierarchical areas to form the different scale and quantity of the clusters, which means nonuniform clustering. Clustering node is dynamically selected according to the residual energy to balance the energy consumption in one cluster [25, 26].
The network is separated into different annular sections with the sink node as the center and

Nonuniform hierarchical static clustering.
This topology based on the vascular network model can balance the energy consumption and avoid the hot issue. However, how to determine the clustering probability in each hierarchical area becomes the key issue. The energy consumption model refers to [27], the radius of each area is
The energy consumption of the nodes excluding the clustering nodes is as follows:

The whole energy consumption in one cluster is as follows:
In order to minimize the energy consumption, from
3. Nonuniform Hierarchical Clustering Routing
3.1. Nonuniform Hierarchical Clustering Strategy
Particles, with equal quantity of the nodes, are randomly deployed in the active hierarchical area. It does the initial
3.1.1. PSO Prototype
PSO is an optimization algorithm based on swarm intelligence which imitates birds’ behavior. Swarm intelligent optimization searching is carried out by the cooperation and competition of the particles. Each solution of the generation has the characteristics of learning the optimum of itself and the group. Each particle is determined by its position and velocity vector. Each particle confirms them by the established direction as well as experiences from the optimal direction of itself and the swarm's. The velocity and location is updated by the following formulae:


where the inertia weight coefficient
3.1.2. IPSO
Modify the PSO formula with inertia weight. The particles

It updates the particles’ position and velocity by the formulae (7) and (8) in each iteration.
Modify particles’ flying rules. The particles no longer follow the rule that the particles’ velocities and locations are updated by their own and swarms’ optimum. In the improved way, when the particle moves to the location coinciding with the sensor nodes, the particle's location becomes fixed and the velocity turns to zero. The rest particles continue to fly by established rules until the whole particles’ locations coincide with sensor nodes. It forms the optimal clustering distribution, and then the clustering is to be carried out in the next hierarchical area.
3.1.3. Steps of the Algorithm
Step 1.
Divide the network into different hierarchies by the distance from the nodes to sink node. It uses different clustering probabilities for different hierarchical areas. It selects the nodes in hierarchy 1 as the active nodes and makes others as dormant ones in order to avoid the particles flying into other hierarchical areas.
Step 2.
Randomly generate the number of the particles
Step 3.
Determine the number of the clusters
Step 4.
Set the target function to evaluate the fitness of the particles and the clustering quality by Euclidean distance:

where the dist is the normative Euclidean distance between two objects, K is the number of the clusters, x is the particle, and
Step 5.
Calculate the particle's self-optimal position
Step 6.
Judge the particles’ positions. When the particle moves to the sensor nodes’ position, set
Step 7.
Update the rest particles’ positions and velocities by formulae (7) and (8).
Step 8.
Repeat Steps 3 to 7 until the last particle coincides with the last sensor node. The clustering is over in this hierarchy, and the nodes turn to the dormant state.
Step 9.
Wake up the nodes in the hierarchical area
3.2. Routing Establishment Based on BWAS
BWAS is the improvement of the ant colony algorithm. It introduces the rewards-punishment mechanism to magnify the pheromone between the best and worst ants. It improves the ability of the optimal path searching and the convergence rate. And pheromone generated by ants is an important parameter reflecting the path's optimization. It considers the nodes’ energy, inspiration of the nodes’ distance, and the advantages of swarm intelligence.
Now suppose some artificial ants are set at each clustering node and they will die when finishing searching the paths from the clustering nodes to the sink node. The ants have the memory of the pheromone on the paths passed by.
Step 1.
Initialize the parameters; to determine the clustering nodes, set ants’ quantity at each clustering node and define their property.
Step 2.
Select the path for each ant by formulae (10) and (11):


where
Step 3.
Update the pheromone on the generated paths by formula (14) after each ant finishes the task:


where
Step 4.
Execute Step 2 and Step 3 until each ant generates a path and evaluate the best and worst ants according to the length of the paths passed by.
Step 5.
Globally update the pheromone on the paths passed by the best ants by formula (16):


Step 6.
Globally update the pheromone on the paths passed by the worst ants by the following formula:
where ε is a parameter,
Step 7.
Execute Steps 2 to 7 for ants in the rest clustering nodes until all the ants finishes task and record the pheromone values on the paths.
After the hierarchical dividing and static clustering, it uses the normalized pheromone as the selection probability to establish the fault-tolerant routing. When the energy consumption of the clustering nodes reaches the threshold value, they report the information along the established route in order to reduce the energy consumption. When the transmission cycle is over, it selects the nodes with higher energy as the clustering nodes in the clusters. Then, the whole network calculates the new pheromone values of the paths based on BWAS to establish a new routing.
4. Simulation and Analysis
4.1. Simulation on Nonuniform Hierarchical Clustering
4.1.1. The Distribution of Hierarchical Nodes
Assumptions: (1) the nodes in the network are stationary. (2) The locations of the nodes are known. (3) All nodes have the same status and parameters. (4) Each node works at full-duplex operation mode. (5) The nodes distribute uniformly in the rectangular areas, and the sink node is outside.
The simulation is based on PC with processor i3-2100, RAM with 4 G. 150 nodes are deployed in the area
Figure 3 shows that 150 sensor nodes are deployed randomly in

Nonhierarchical nodes in WSN.

Hierarchical nodes in WSN.
4.1.2. Nonuniform Hierarchical Clustering
The nodes are hierarchically clustered by the IPSO; different clustering probabilities are adopted in different hierarchical areas. Finally, it forms the cluster distribution with different scales and quantities, as shown in Figures 5 and 6.

Equal-probability hierarchical clustering.
Nonequal-probability hierarchical clustering.
Figure 5 shows the equal probability hierarchical clustering by IPSO with 3 hierarchies. 150 nodes are clustered by the same probability. The scales of clusters are the same, and there are about 2–4 nodes in each cluster. Figure 6 shows the nonequal probability hierarchical clustering by IPSO with 3 hierarchies. So it forms the distribution that different scales and quantity of clusters are in different hierarchical areas. It, at last, forms the distribution with smaller scales and larger amount of the clusters in the lower hierarchical level where it is near to sink node. And so does the opposition in hierarchy 3 where it has the larger scales of clusters and fewer nodes in each one. It reaches the expected clustering structure.
Table 1 shows the statistics of the nonuniform hierarchical clustering by IPSO. From it, the number of the nodes in hierarchy 1 is 38, the clustering probability is 0.237, and the number of the clustering is 9. According to the energy balance method presented above, we can calculate the probabilities of the second and third hierarchies; they are, respectively, 0.100 and 0.070. The simulation results show the corresponding values are 0.103 and 0.074. From the clustering probabilities, the number of the clusters, and member nodes, we can get the conclusion that the distribution of the clusters is the same with the topology previously supposed.
Statistics of the nonuniform hierarchical clustering.

4.2. Simulation on Nonuniform Hierarchical Clustering Routing
4.2.1. Parameters Setting
After the hierarchical division and nonequal probability static clustering, to place the ants at each clustering node with the number
4.2.2. Process of Routing Establishment
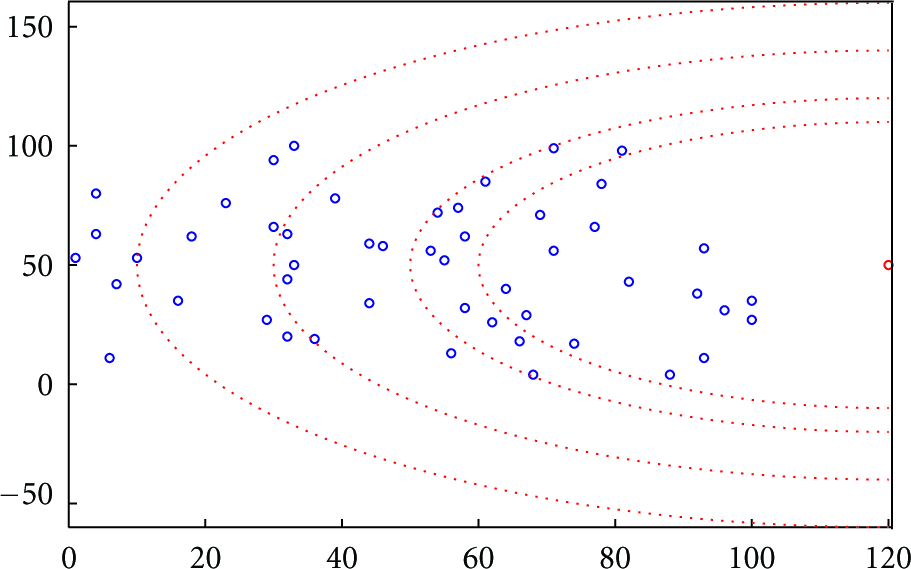
Now we use A to E to identify hierarchies 1 to 5.
Normalized values of the ants’ pheromone.

Node's coordinates on the paths.
From all the normalized values of the ants’ pheromone on the paths from the node (7,42) in E to the nodes in D,

Transmission route from node (7,42) to sink node.
4.2.3. Simulation on the Routing Establishment
Simulation is completed when all the ants reach the sink node by BWAS. The pheromone on each path stops evaporating and is recorded. Node visited by ants is not hierarchical, only by this can pheromone reflect the links’ quality.
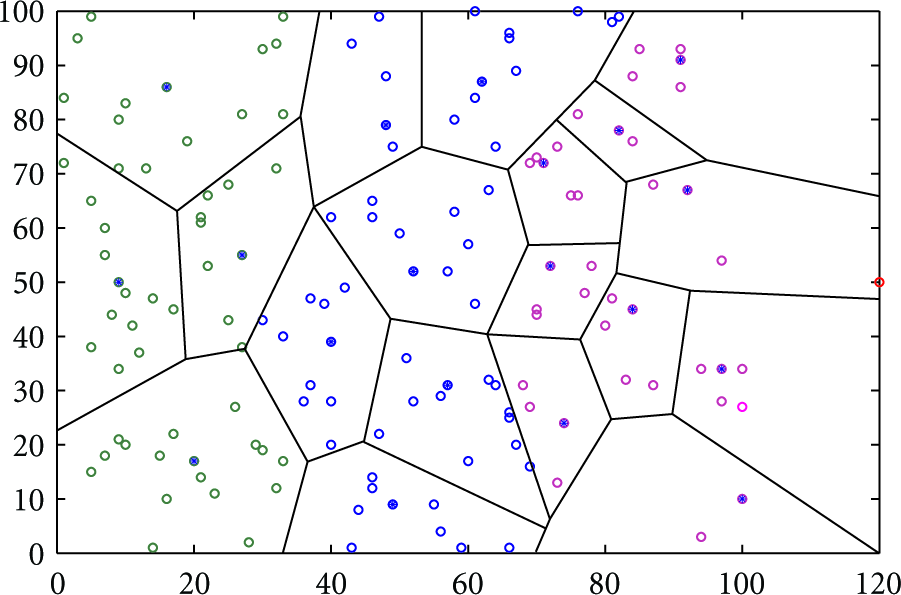
Figure 8 shows the distribution of the clustering nodes in three hierarchies. According to the nonequal probability clustering method, 19 clustering nodes are elected from total 150 nodes and marked with three different colors as for three hierarchies. Simulations in Figure 9 illustrate that all the possible transmission paths are established among the clustering nodes. Paths in different hierarchy are marked with different colors for distinction. The paths established in Figure 9 show the hierarchical characteristic clearly.

Clustering nodes in three hierarchies.

Paths among the clustering nodes in three hierarchies.
For fewer clustering nodes in WSN, we can more clearly understand the establishment of the transmission paths. However, better performance can be reflected for the large-scale network, as shown in Figures 10 and 11.
Clustering nodes in five hierarchies.

Paths among the clustering nodes in five hierarchies.
Figure 10 shows the distribution of 50 clustering nodes in five hierarchies. Figure 11 shows all the possible transmission paths among the clustering nodes. We also mark the hierarchical transmission paths with five different colors for distinction. There are five hierarchies for the established paths; the node only establishes the links to the nodes in the neighbor hierarchies. It has an important significance to the quick establishment and optimization of the transmission routing for large-scale network.
4.3. Performance and Complexity Analysis of the Fault Tolerance
4.3.1. Performance Analysis of the Fault Tolerance
(1) Pheromone, generated by ants during the process of searching the optimal path, is an important parameter reflecting the path's quality. The higher τ is, the greater probability the path is selected as transmitting path. (2) It uses the normalized pheromone values as the selectionprobabilities of the paths and selects one with maximum probability as the actual data transmitting path. Any clustering node will establish the possible paths to the nodes in neighbor hierarchies within its transmission power coverage. But only the path with maximum probability is to be selected as actual data transmitting path. If it fails, the path with second maximum probability is to be selected to realize the fault tolerance. Node 7 in Figure 1, for example, has established the paths
4.3.2. Complexity Analysis of the Algorithm
The computational overhead of the nonuniform hierarchical clustering based fault tolerant routing algorithms is in terms of nonuniform hierarchical clustering by IPSO and computing the pheromone of each path by BWAS. k particle swarms are generated in the process of nonuniform hierarchical clustering by IPSO, and each particle swarm contains
It has
4.4. Analysis of Receiving Rate and Average Packet Delay
It is important to select the high-quality communication link to improve the reliability of network data transmission. Two criterions, receiving rate and average delay, can best reflect the quality of links and performance of fault tolerance. The receiving rate of the packet is defined as the ratio of packets received at sink node and packets sent to source nodes. The closer to 1 the packet receiving rate is, the higher qualities of the links are. The average delay of the packet transmission is defined as average delay of all the packets received at sink node from the source nodes.
The fault nodes in network are supposed to be the ones in which the energy consumption reaches the initial threshold value, and the network is based on the model of timing acquisition transmission. CPEQ presented in [15] is the representative of the fault tolerance in multilayer joint optimization and shows the better performance by the comparison with DD (directed diffusion) routing algorithm. Therefore, we will make a comparison of the algorithm presented in this paper with CPEQ in [15] in receiving rate and average packet delay, as shown in Figures 12 and 13.

Comparison of packet receiving rate.

Comparison of average packet transmission delay.
Figure 12 shows the comparison of the presented algorithm and CPEQ in the packets receiving rate. Fewer fault nodes have arisen before 300 times of the network operation. It cannot show the apparent influence on the performance of the network by them; so we choose the sampling data during the 300–800 times. Along with the increase of operation times, the fault nodes’ number also increases. The proposed algorithm has a better performance in packet receiving rate and reflects the good stability in data transmission. Figure 13 shows the comparison of the average packet transmission delay during the operation 300–800 times between the presented algorithm and CPEQ. The newly established transmission route reestablishes the route not from the source node to sink node but from the node ahead of fault node to the sink node by the selection probability. Simulation shows the better performance in average data transmission delay than CPEQ.
4.5. Analysis of Energy Consumption
The routing has been established based on BWAS according to two different clustering models. The first clustering model is equal probability clustering based on IPSO among the nodes with same hierarchy property. The second clustering model is the nonequal probability clustering based on the same BWAS in three hierarchies that different clustering probability is adopted in different hierarchy. Now we do the comparative analysis of energy consumption of the nodes, as shown in Figures 14 and 15.
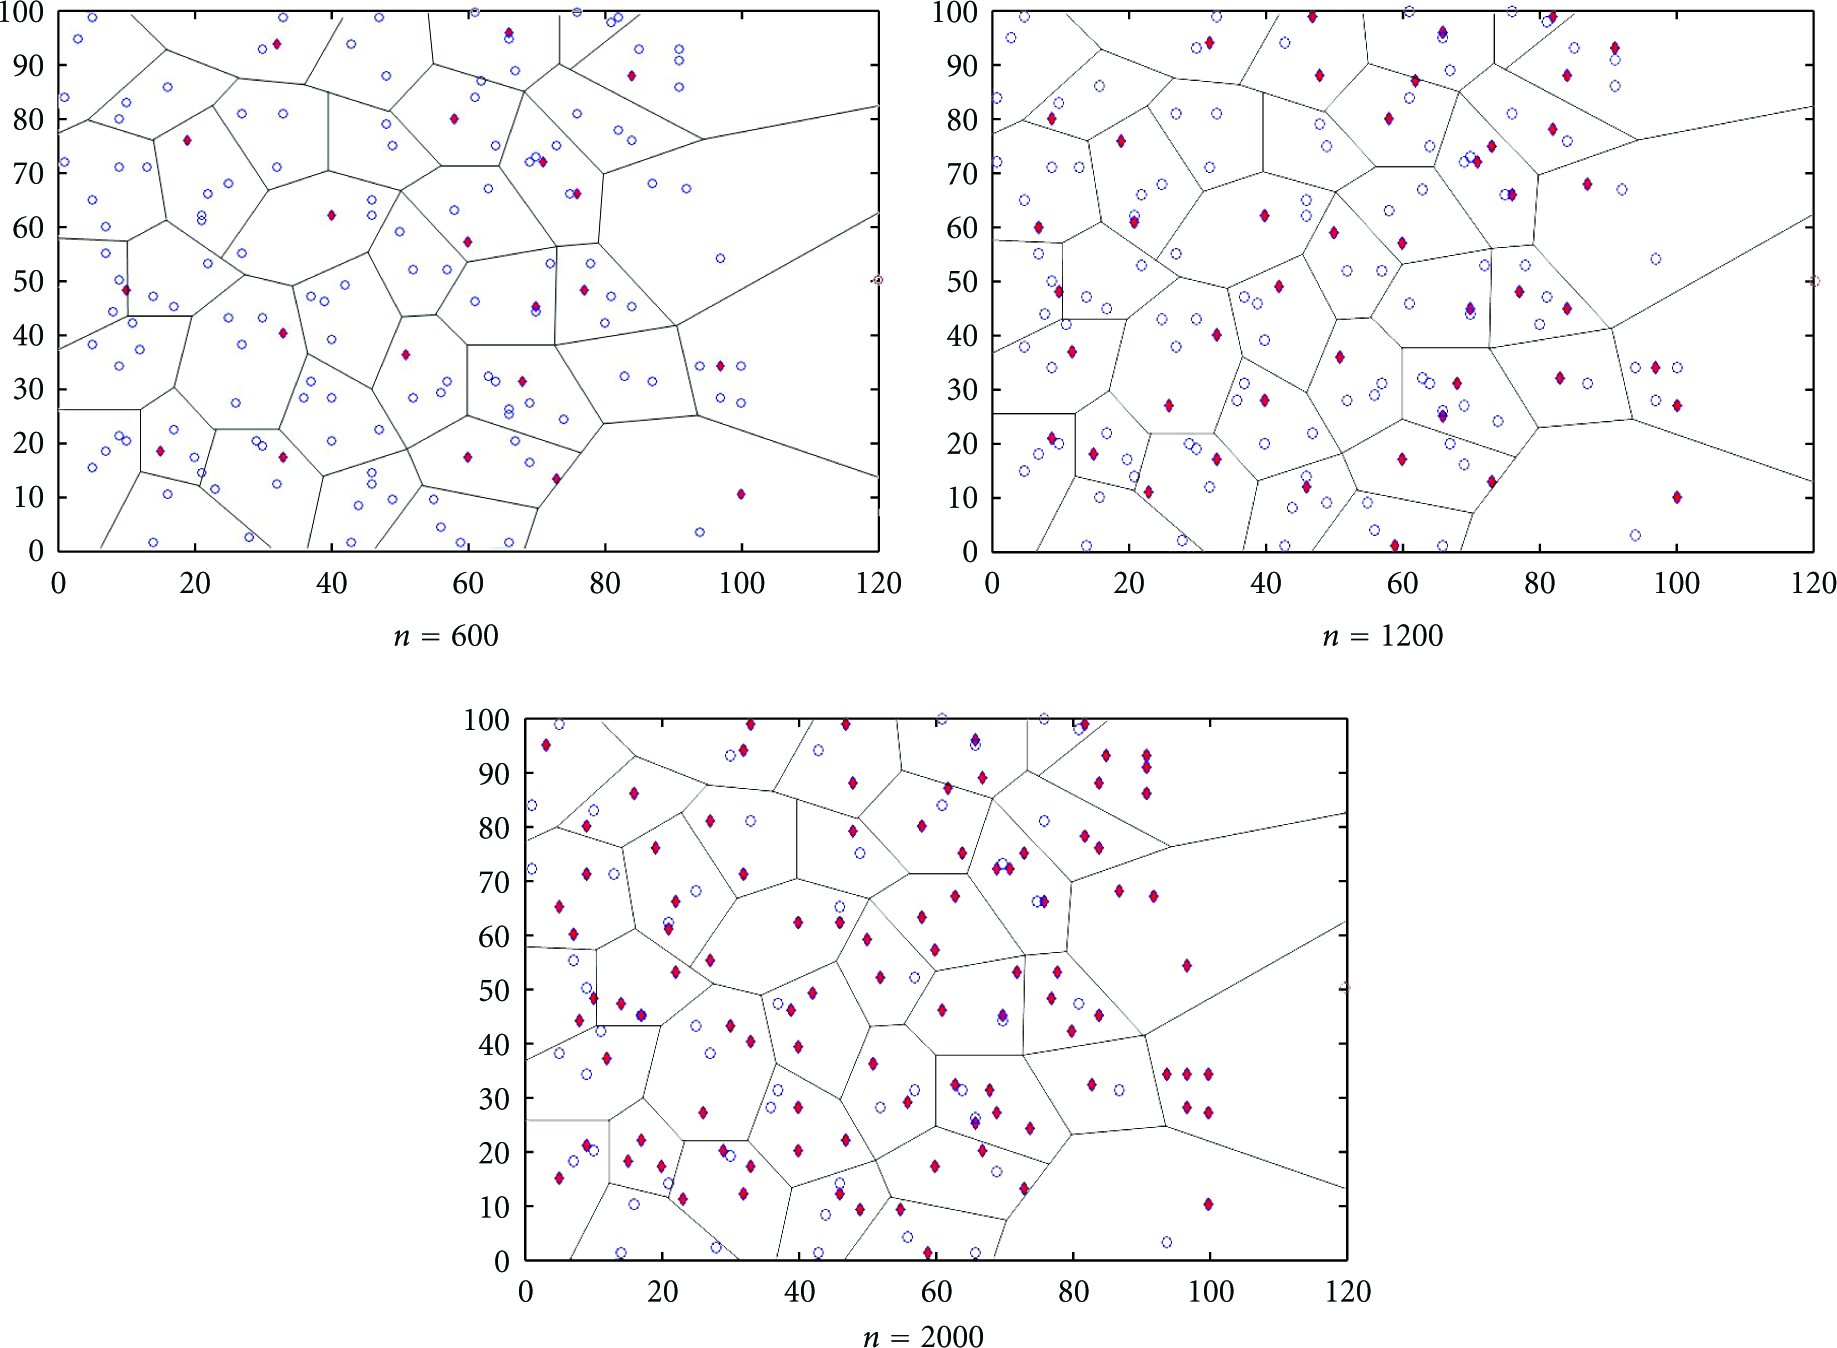
Energy consumption by equal probability and nonhierarchical clustering.
Energy consumption by nonequal probability and hierarchical clustering.
Figure 14 shows the energy consumption by equal probability and nonhierarchical clustering. Figure 15 shows the energy consumption by nonequal probability and hierarchical clustering. There are total 150 nodes in the network. The red diamond point represents that the sensor node runs out of energy. We analyze the energy consumption at cycle
5. Conclusion and Prospect
In this paper, a fault-tolerant routing algorithm is presented based on the nonuniform hierarchical clustering inspired by the characteristics of vascular network. We build the mathematical model and the topology by marking the nodes with different hierarchies. Nonuniform hierarchical clustering is done based on IPSO with different clustering probabilities in different hierarchical areas. It establishes multiple transmission paths between the neighbor hierarchical nodes by the normalized values of the paths’ pheromone generated in BWAS as the path selection probability. It selects the path with maximum probability as the actual data transmitting path to establish the fault-tolerant routing.
Theoretical analysis and simulations show that the topology based on the hierarchical nonuniform clustering can balance the nodes’ energy consumption and avoid the hot issue. The routing has higher packets receiving rate and lower average transmission delay. It can avoid the data loss due to the fault of the nodes or links. So it has a good performance in the fault-tolerance and stability of the data transmission.
Our work introduces the characteristics of the vascular network into the fault-tolerant routing for WSN and carries out the studies within the framework of the biological mechanism. As a novel routing algorithm, in-depth study is needed in the theoretical framework and practical application, especially when it applies to the fault detection and tolerance by the vascular model and the mechanism of the immune system and blood test.
Footnotes
Acknowledgments
This work was supported by the National Science and Technology Major Projects of China (no. 2009ZX07528-003-09), Specialized Research Fund for the Doctoral Program of Higher Education of China (no. 20100191110037), Chongqing Key Project of Science and Technology of China (no. CSCT2010AA2036) and (cstc2012gg-yyjs40008), Wanzhou District Science and Technology Planning Projects of China (no. 201203037) and ([2010]23), Youth Project of Chongqing Three Gorges University of China (no. 12QN14) and Science and Technology Project of Chongqing Three Gorges University of China ([2011]52).