
Abstract
A new model for wax deposition is established based on the loop tests data of 9 typical crude oils in conjunction with the concept of the effective wax precipitation which occurs in the heat boundary layer in the pipeline. The thickness of the wax deposition of a waxy oil pipeline is predicted by the established model, and the results of the model agree well with the field data. Subsequently, the models for the shutdown and restart processes of a waxy crude oil pipeline are established. Then the restart process of a wax crude oil pipeline is investigated numerically, the temperature drop during the shutdown process and the transient inlet pressure are presented, and the effect of the wax deposition on the safety of the restart process is clarified.
1. Introduction
Wax precipitation in crude oil pipelines at or below the wax appearance temperature (WAT) can lead to gelling that inhibits flow by causing significant non-Newtonian behaviour and increasing effective viscosities as the temperature of a waxy crude oil approaches its pour point [1]. When the temperature of the pipeline wall is below WAT, the deposition of a layer of paraffin molecules would form near the pipe wall, constricting the flow. In the practical pipeline transportation engineering, pigging is often conducted periodically for a hot waxy crude oil pipeline to keep its throughput and operation pressure relatively steady. But for some hot crude pipelines, the throughputs of which decline with the reductions of the outputs of the upstream oil fields; pigging operations are not done regularly or even not done at all for a long period. For these pipelines, the existence of the wax deposition in them could help reduce the increment of heat loss resulting from the reduction of the throughput and even make it possible to keep the pipeline operating safely without increasing the heat capacities of heat stations. But the heat preservation of wax deposition does not imply that it will also keep or improve the safety of a long-term unpigged hot crude pipeline during its shutdown and restart. Since the wax deposition decreases the accumulation heat of a hot crude pipeline in the soil around itself during running, which is a disadvantage to the thermal conditions after the shutdown of the pipeline, the influences of thicker wax deposition on the shutdown and restart of a long-term unpigged hot crude pipeline cannot be deduced directly from normal operation and should be investigated quantitatively in detail for assessing the safety of such a pipeline.
Some researchers, such as Del Carmen García and Urbina [2] and Del Carmen García [3], have studied correlations between the properties of crude oils and their flowing properties, including the precipitation and deposition of wax during flow. Models have been developed to predict the onset of wax precipitation and the deposition of wax along pipeline walls. However, accurately modelling deposition in pipelines can be a complex and difficult undertaking, because, while precipitation is mainly a function of thermodynamic variables such as composition, pressure, and temperature, deposition is also dependent on flow hydrodynamics, heat and mass transfer, and solid-solid and surface-solid interactions [4]. Some researches about the wax deposition could be referred to [5–15].
The studies on the calculation of the restart process of oil pipeline are extensive. Some valuable researches can be found in [16–21]. But the impacts of wax deposition on the restart process are rare. In this paper, the impact of the wax deposition formed during the running without pigging on the safety of the restart process of a pipeline is analyzed and some significant conclusions are drawn.
The layout of this paper is as follows. The characteristic of wax deposition is to be investigated first. Then the models for the shutdown and restart processes of a waxy crude oil pipeline will be established. Lastly, the effects of wax deposition on the shutdown and restart processes of a waxy crude oil pipeline will be investigated.
2. Mathematical Model for Predicting the Wax Deposition
When the crude oil is transported in the pipeline, since the ambient temperature at a certain length of the pipeline is usually lower than the crude temperature at the same length, the temperature near the inner pipe wall cools faster than that far from the inner wall and causes a temperature gradient pointing to inner pipe wall. And the temperature at inner pipe wall firstly reduces to WAT, and the wax precipitates near the wall in the first place and then crystallizes and deposits on the wall. The wax deposition near the wall results in the reduction of the liquid wax concentration in this area and causes a solved wax concentration gradient pointing to the inner wall, which impels the liquid wax molecules in the central area of pipe cross-section moving to inner wall and precipitating and depositing there continuously. This temperature gradient induced solved wax concentration is just the impetus of the wax deposition, and thus it is deduced that only the wax precipitation occurred in a region where an oil temperature gradient exists and contributes to the wax deposition, or say, is effective to the wax deposition. From this issue, even if all the oil temperatures along a radius in some pipe cross section have reduced below the WAT so the wax precipitation has occurred anywhere in the cross section; however, only the wax precipitation in the area near the pipe wall in which heat flux points outwards has contribution to the wax deposition on the pipe wall, instead of the whole amount of wax precipitation in the cross section, while the wax precipitations in other areas will flow downstream in wax crystals forms.
According to the above analyses, the concept of effective wax precipitation (EWP) is proposed, which associated with the wax precipitation occurred in the region where an oil temperature gradient exists and contributes to the wax deposition. Since the flow states in most industrial crude pipelines are in turbulent regimes, the temperature gradient only exists in laminar region near the wall. As for the laboratory loop test for wax deposition (which is the focus of our study), because the length of the test tube in a loop is usually about 1.5 meters to 2 meters and the heat boundary layer in the tube would not expand fully according to heat transfer method, the temperature gradient also exists in the heat boundary layer near the wall, shown in Figure 1.

Diagram of heat boundary layer in test tube.
Since the ambient temperature around the test tube changes axially in practical test process, the oil temperature varies along the test tube and the heat boundary layer thickness also changes along the test tube. In order to calculate the EWP in test tube accurately, the length of the test tube would be divided into several segments. Then the thickness of the heat boundary layer of each section could be calculated according to heat transfer method and thus the whole effective mass of crude which flows through the heat boundary layer during a test can be calculated according to the following formulae:

where δ
i
indicates the thickness of heat boundary layer of the ith section;
Once M δ is obtained, the EWP for the tested crude during the test time can be determined from it according to the wax precipitation characteristics of the crude.
For studying the relationship between wax precipitation and its deposition, a variable named effective deposition ratio (EDR) should be defined to connect the EWP with the wax deposition, which is defined as

where W d is the whole amount of wax deposition and W E is for EWP. In the following, effective deposition ratio will be abbreviated as EDR.
In order to detect the hidden relationship between EDR and EWP, a test loop shown in Figure 2 was devised to obtain the necessary data. In the figure,

Diagram of wax deposition test loop.
With the experiment data of nine different crude oils, it is discovered that the relationships between effective deposition ratio (EDR) and effective wax precipitation (EWP) for each kind of representative crudes studied and tested in the test loop obey the same rule; that is, the EDR decreases with the increase of the EWP and, when the EWP is less, the EDR changes rapidly; when the EWP increases to some extent, the EDR begins to change slowly. Further, put all the EDR and EWP data from 9 kinds of crude oils together, the tendency concluded above is clear at a glance (see Figure 3). It is further found that the statistic rule on the relationship of EDR and EWP is obvious and could be expressed in power law mathematically as follows:

where W
E
represents the EWP;

EDR versus EWP curve of nine kinds of representative crude oils.
Based on the results above, the significance for introducing the concept of EWP is emphasized. Through the definition of EWP, the universal rule on the relationship between EWP and wax deposition available to many crude oils is found quantitatively. The concept of EWP uncovers the internal connection of the wax deposition with the wax precipitation and provides a method to divide the part contributing to wax deposition from the whole wax precipitation in pipeline or in test tube. More important, the rule common to the wax deposition of many kinds of crude oils in the test loop makes it possible that a common wax deposition model could be created for many kinds of crude oils and a large number of loop tests necessary for wax deposition prediction previously could be left out.
In fact, the outline of the common wax deposition model has been given in formula (3) theoretically. But that form might not be used for practice yet for the reason that the EWP is unknown for a new kind of crude never tested in the test loop. From the definition and calculation of EWP, it is explicit that EWP is connected with the thickness of heat boundary layer and the thickness of heat boundary layer strongly depends on the velocity and temperature distributions in the test tube at different test conditions, so the factors such as the viscosity of crude, shear stress at inner pipe wall, radial temperature gradient at pipe wall, oil temperature in central area of test tube, and the velocity of oil flow which have impacts on velocity and temperature distributions would all influence the determination of EWP. In other words, the EWP is a function of all factors mentioned above. From the above discussion, the practical common wax deposition model should have the following form:

where
On the basis of wax deposition loop test results of 9 kinds of crude oils and applying the method of linear multi-variable stepwise regression to check and analyze the formula (4), the final form of the common wax deposition model is determined as follows:

Formula (5) is the common wax deposition model which is available to most kinds of crude oils. From now on, an efficient and sample-saving wax deposition model can be created for any crude in the case of no wax deposition loop tests.
3. Mathematical Models for the Shutdown and Restart Processes of a Waxy Crude Pipeline
During pipeline shutdown, heat transfer in crude oil can be divided into three stages as (1) natural-convection-dominated stage, (2) joint control of natural convection and heat conduction, and (3) pure heat conduction [22]. With the following assumptions the temperature drop process is then simplified as a heat conductive process.
The variation of the specific heat capacity of the crude oil is applied to describe the latent heat of wax crystallization during shutdown.
Stagnation point introduced in the second stage describes the internal pipeline as a liquid region with natural convection and a solid region with thermal conductivity.
Natural convection can be solved as conduction after an equivalent thermal conductivity is applied [23]. By this means, we can convert the calculation of natural convection into a conductive heat transfer. The equivalent thermal conductivity is dependent on the natural convection coefficient, the temperature of oil, and the temperature gradient on the interface. Then the heat transfer equation of the oil is then shown as

in which,
Though the equivalent thermal conductivity is not a real heat conduction coefficient, it guaranteed energy conservation and greatly simplified the calculation. This approximation is verified by field data of crude oil pipelines [23].
Heat transfer equations of wax deposition layer, pipe wall, and corrosion protective coating as well as the heat conduction equation of the soil are the same as those in the normal operation process. Matching conditions are shown in (7) while boundary conditions are the same as those in the normal operation process. Consider
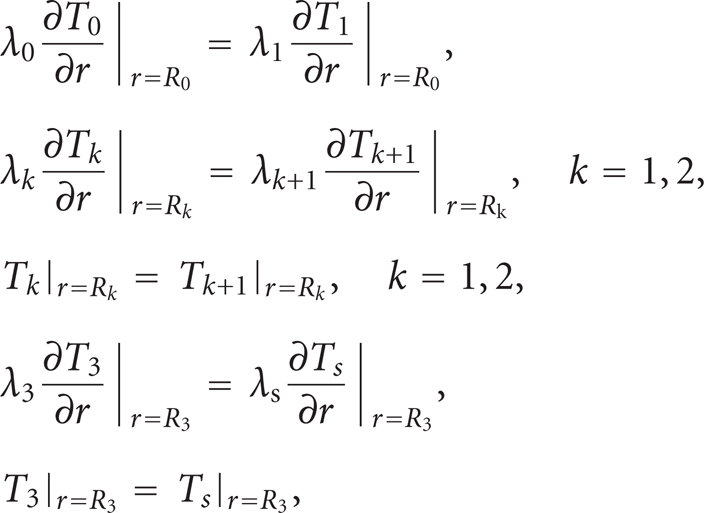
where
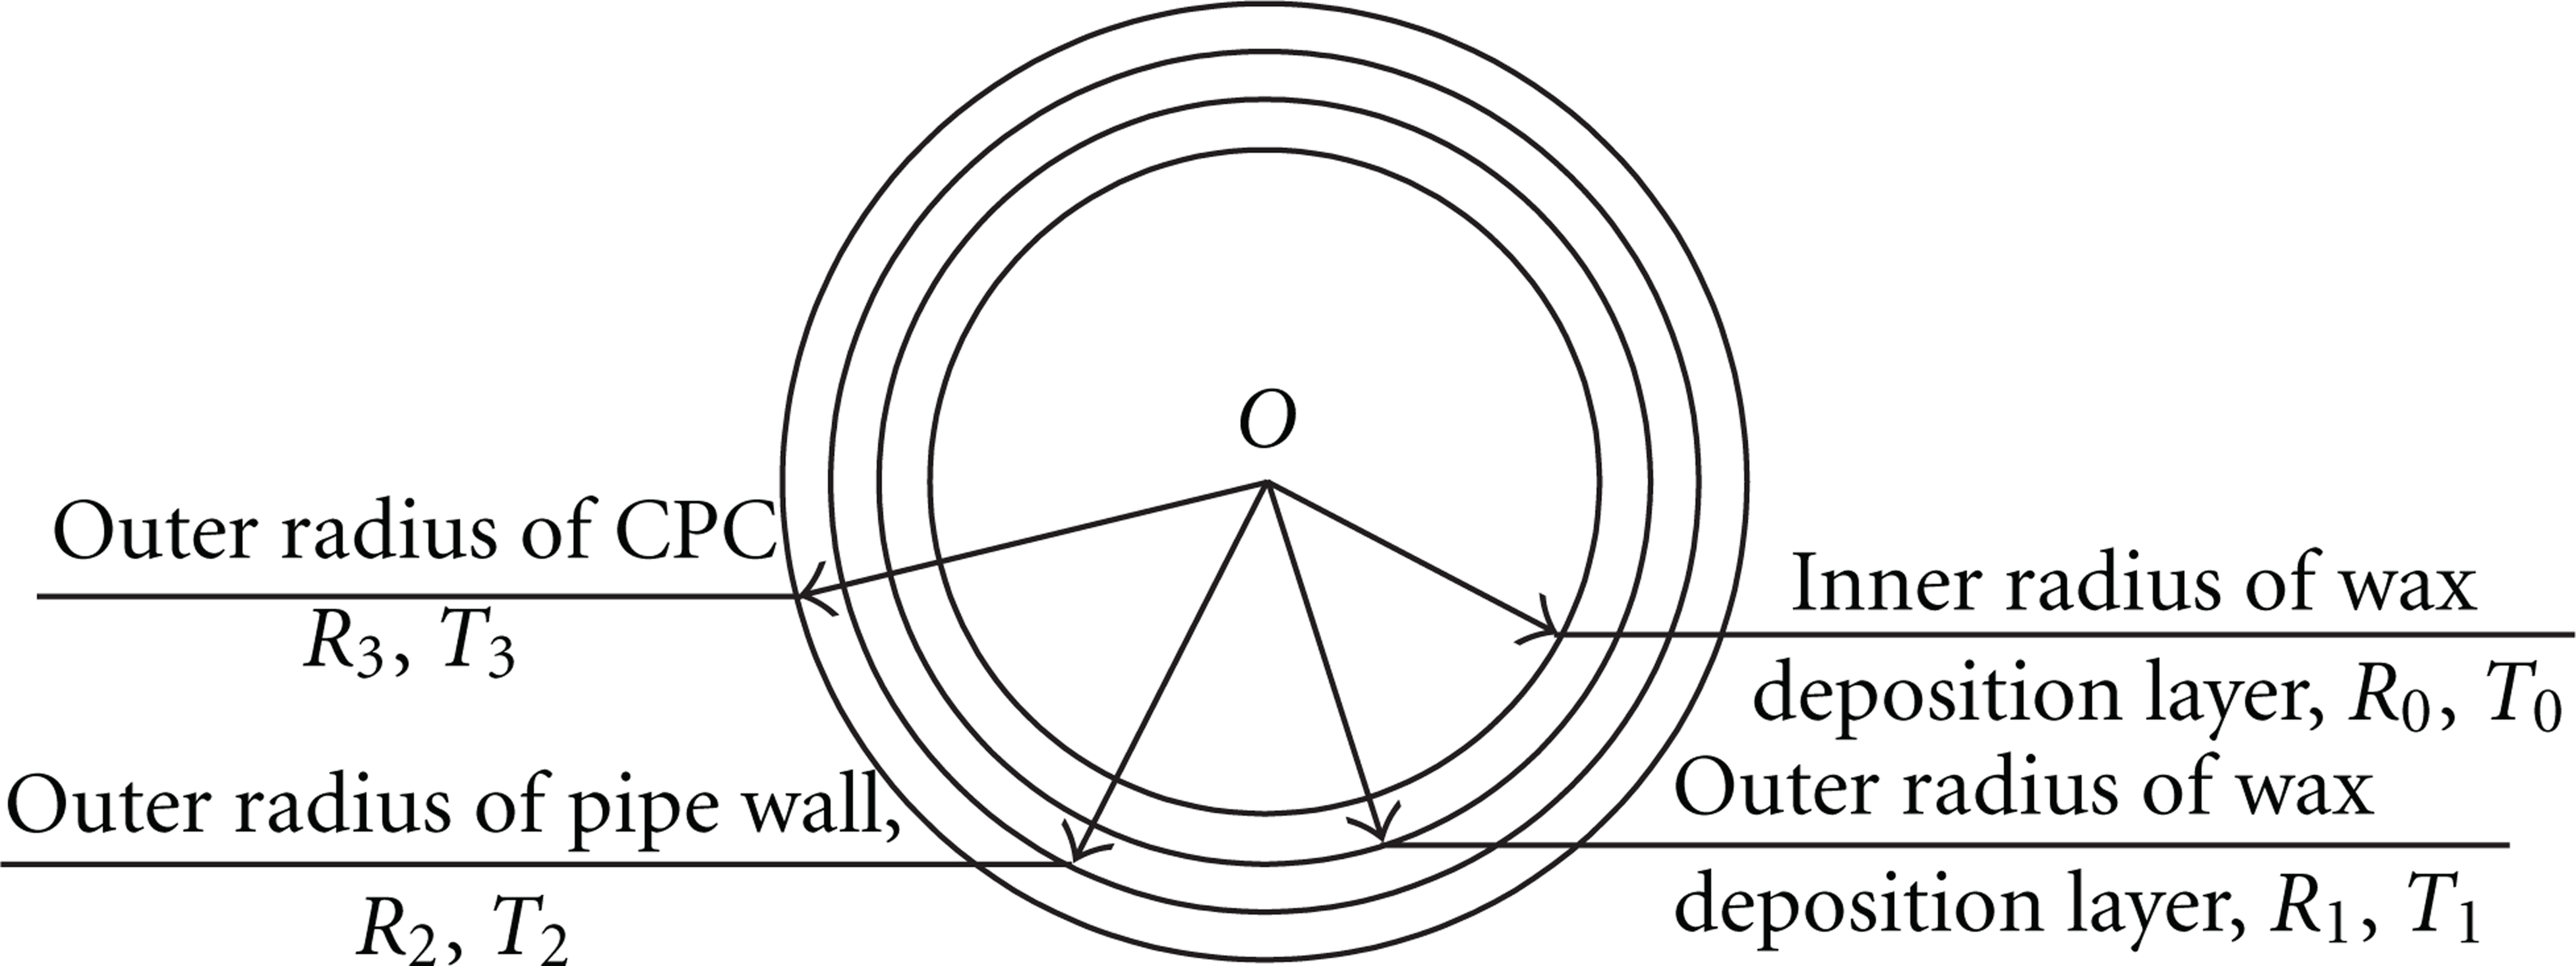
The three-layer system of the crude oil pipeline.
During the process of restart, the thermodynamic model is the same with that during normal operation, which can be referred to [24]. In addition, the hydrodynamic model for the restart process is as follows.
Momentum equation:

where v is the average velocity of the oil flow; p is the restart pressure along the line; θ is the inclination angle of the pipeline; ρ is the density of the crude; g is the gravity acceleration; Deff is the effective inside diameter of the pipe; τ w is the shear stress at inner pipe wall, Pa.
The shear stress at inner pipe wall τ w depends on the flow pattern and flow behavior of the crude and can be determined according to the following formulae.
When the crude belongs to Newtonian fluid:


When the crude belongs to non-Newtonian fluid:


where Re and ReMR are the Reynolds number and Metzner-Reynolds number, respectively; Q is the volumetric flow rate; ν and λ are the viscosity of the crude and friction coefficient, respectively; K and n are consistency coefficient and flow behavior index of pseudoplastic fluid, respectively.
When the crude presents a thixotropic behavior,
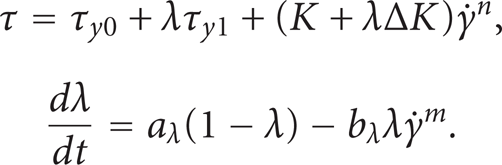
τ w can be determined by solving the Houska thixotropic model.
Initial and boundary conditions:

where A and B are two constants.
4. Numerical Methods
Here a thermal influence zone [25] is adopted as a computational domain and then the numerical simulation is performed. The pipeline is divided into
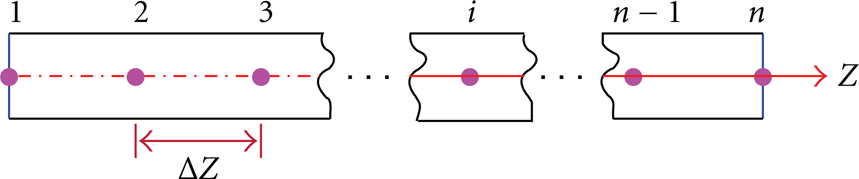
The pipeline infinitesimal segments.

Grids generation of the soil domain.

Local expanded view of the structural grids generation during shutdown.
5. Results and Discussion
5.1. Characteristic of the Wax Deposition of a Waxy Crude Oil Pipeline
A hot crude oil pipeline transporting Daqing crude in the Northeast of China had not been pigged over the past four years due to the reductions on throughputs. The hot crude pipeline is 436.3 km long and its diameter is

Wax deposition simulation of the first interval of the long-term unpigged pipeline.
From Figure 8, it can be found that the wax deposition is not identical along the pipeline. In the middle of the fifth year during no pigging, the maximum wax deposition of the first pipeline interval is about 117 mm and the wax deposition at the outlet of the same interval is near 80 mm. The simulation shows that the position where the maximum wax deposition occurs has moved towards the outlet of the interval at the end of the fourth year and the displacement is about 11 km, which results in the widening of the range of the maximum wax deposition. The phenomenon results from the nonequality of the wax deposition of Daqing crude in this hot pipeline and is the accumulation of the point-by-point movements of the maximum wax deposition during the fourth year. The mechanism lies in when the throughput and the inlet oil temperature of a pipeline interval keep constant, the wax deposition will make the oil temperatures along the line increase slowly. For a hot crude pipeline along which the wax deposition distributes unevenly, the oil temperature at the position of the maximum wax deposition occurring initially would increase and the temperature difference between the oil flow and the inner pipe wall there would reduce. The next downstream position will replace the initial position as a new maximum wax deposition position. Thus the location of maximum wax deposition will move downstream successively, which can bring a span of maximum wax deposition.
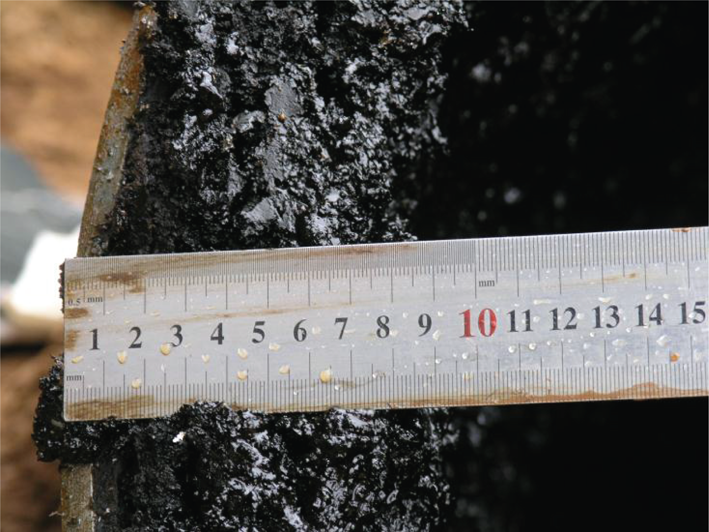
In the case of a long-term unpigged hot crude pipeline with reducing throughputs, whether the location of maximum wax deposition will move depends on two effects jointly: one is the reductions of the oil temperatures caused by lower throughput, another is the increments of the oil temperatures due to the wax deposition. Generally, at the beginning of the operation without pigging, the wax deposition is thinner and the heat loss caused by low throughput is stronger than the heat preservation of the wax deposition, which may result in the location of maximum wax deposition moving upstream. With the growth of the wax deposition, the insulation of wax deposition enhances and the heat loss rate arising from the reduction of throughput decreases due to the reduction of the inner pipe diameter, which will make the location of maximum wax deposition moving downstream. When the maximum wax deposition grows to a certain value (depending on pipeline sizes and operation conditions), the two effects balances and the location of maximum wax deposition will stop moving. Referring to Figure 8, it can be reasoned that the pipeline runs nearby the equilibrium point in the former three years under no pigging and over that point in the fourth year. It needs to be noted that the unpigged hot pipeline transporting Daqing crude began to transport a kind of light crude after no pigging of more than 4 years. Some maintenance and repairs were done for the pipeline to satisfy the new demand, so it was possible to measure the real wax deposition in situ. The following Figures 9 and 10 exhibit the maximum wax deposition and the wax deposition at the outlet of the first pipeline interval in situ, respectively, verifying the accuracy of the simulation.

Maximum wax deposition of the first interval of the long-term unpigged pipeline (about 110 mm).
Wax deposition at the outlet of the first interval of the long-term unpigged pipeline (about 80 mm).
5.2. Temperature Drop Characteristics of the Waxy Crude Oil Pipeline
Based on the above model, numerical simulations for the temperature drops along the pipeline with the shutdown duration of the unpigged hot crude pipeline carrying Daqing crude are completed. The results for the first pipeline interval in December of the 4th year of no pigging are shown in Figure 11.
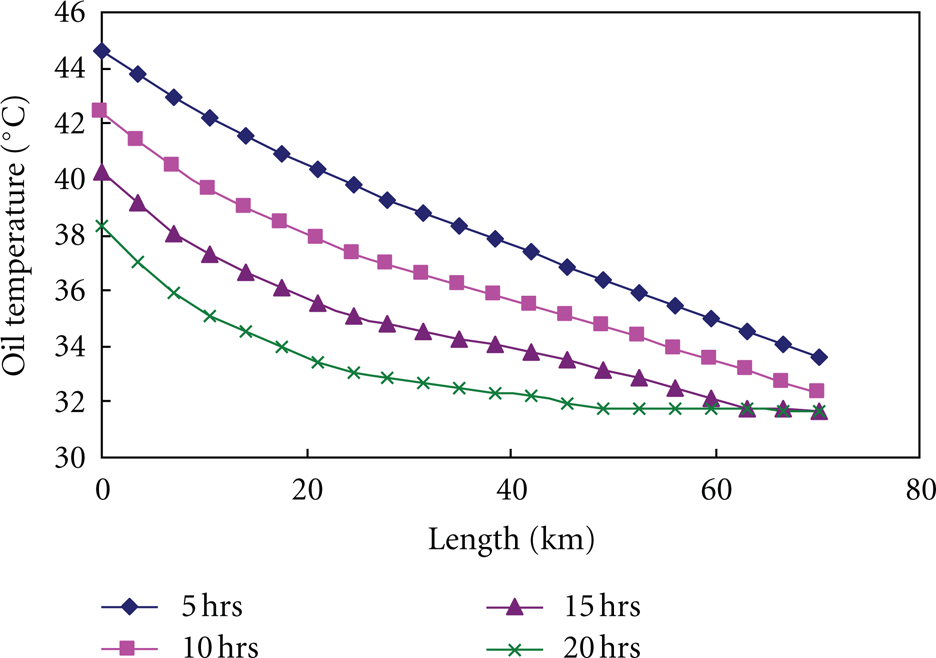
Oil temperatures along the line with the shutdown duration of the first pipeline interval in December of the 4th year of no pigging.
To investigate the impact of the wax deposition formed through a long-term operation on the temperature drop of the hot crude pipeline, the oil temperatures at the outlet of the first pipeline interval after 20-hour shutdown in December of each year during four years under no pigging are selected from the simulation results. Also the wax depositions at the same position in the same time are selected from the wax deposition simulations. All the data are drawn in the same Figure, see Figure 12.
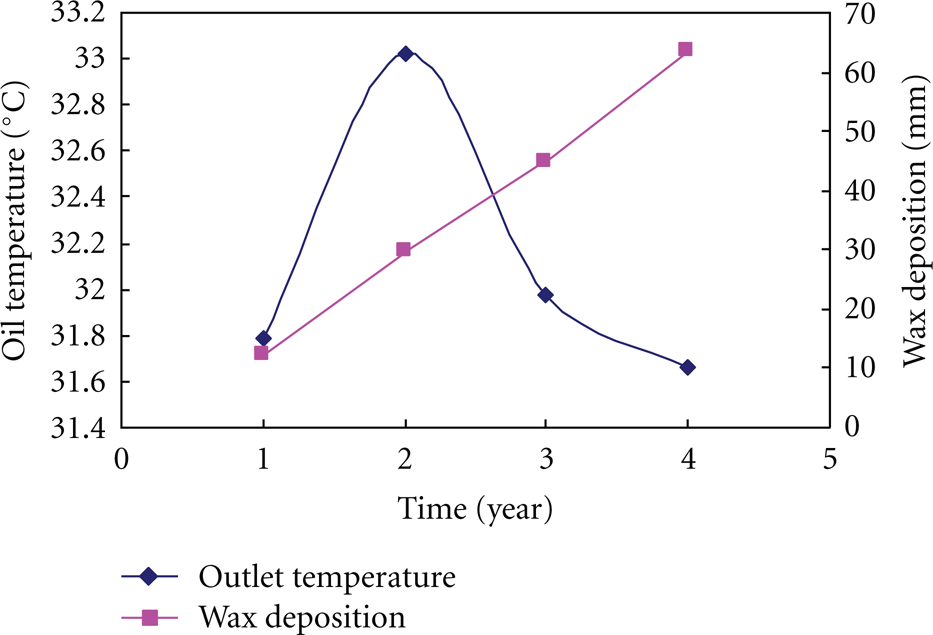
Oil temperatures after 20-hour shutdown and wax depositions at the outlet of the first pipeline interval in December of each year of no pigging.
For analyses, the operation data for this pipeline interval corresponding to Figure 12 are listed in Table 1.
Operation data during no pigging.
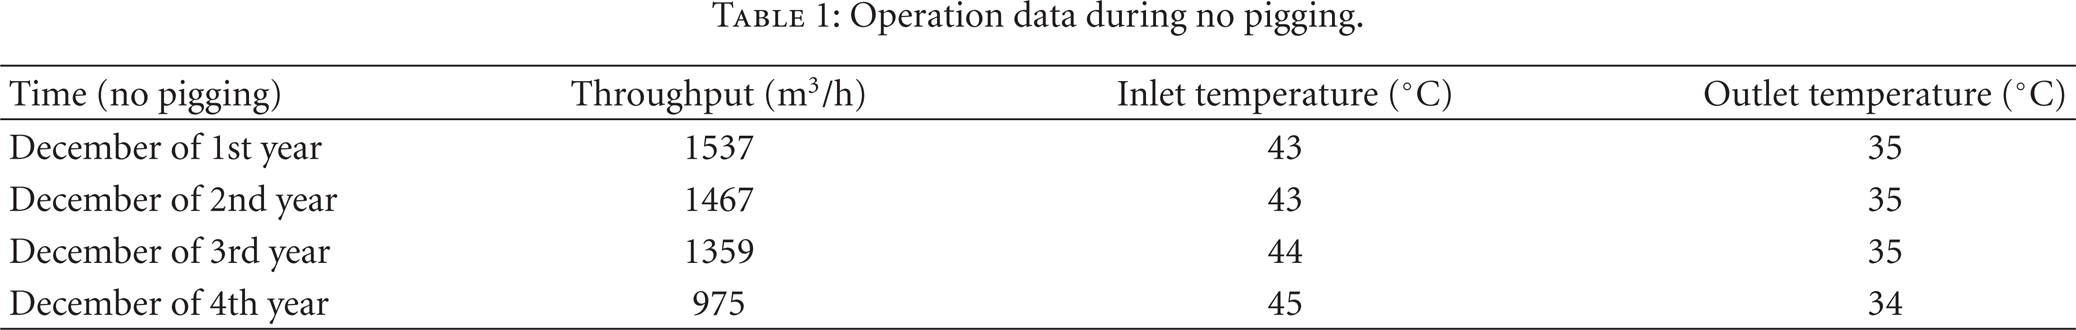
From Table 1, the insulation effect of the increasing wax deposition is obvious in spite of the successive reduction of throughputs during no-pigging operation. When the throughputs decreased slowly and the inlet oil temperatures kept constant (in Decembers of the 1st and 2nd years), the increasing wax deposition ensured the same outlet oil temperatures. While the throughputs declined a lot and the inlet oil temperature was enhanced a few (in December of the 3rd year, especially in December of the 4th year), the wax deposition made the outlet oil temperatures relatively steady.
But from Figure 12, it can be concluded that the wax deposition formed during normal operation will not always be positive to keeping the oil temperature after the shutdown of the pipeline. The existence of a turning point corresponding to the 2nd year proves this issue. It can be explained as follows: on the one hand, the wax deposition slows down the heat transfer between oil and the surrounding soil and thus reduces the oil temperature drop rate during the shutdown. On the other hand, the reduction of the flow rate reduces the outlet oil temperature during the normal operation, leading to a lower oil temperature with the same shutdown duration. So the final impact of the wax deposition on the temperature drop of a hot crude pipeline after its shutdown depends on the two effects simultaneously: the insulation enhancement of the wax deposition and the flow rate reduction in the pipeline, each of which advances oppositely. Also, there is a balance point between the two effects. For the case in Figure 12, the balance point corresponds to the wax deposition of about 30 mm at the outlet of the first pipeline interval.
5.3. The Effect of Wax Deposition on the Restart Process of the Waxy Crude Oil Pipeline
Combining the hydrodynamic model with the thermodynamic model introduced above, numerical simulation for the restart process of the long-term unpigged hot crude pipeline is carried out. The results aimed at the first pipeline interval are selected for analyses, which show how the inlet pressures vary with the duration of restart for different shutdown durations in different years of no pigging (see Figures 13, 14, 15, 16, and 17).

Inlet pressure with the duration of restart after the different shutdown time of the 1st pipeline interval in December of the 1st year of no pigging.

Duration of the maximum inlet pressure at different shutdown times of the 1st pipeline interval in December of the 1st year of no pigging.

Inlet pressure with the duration of restart after the different shutdown time of the 1st pipeline interval in December of the 2nd year of no pigging.
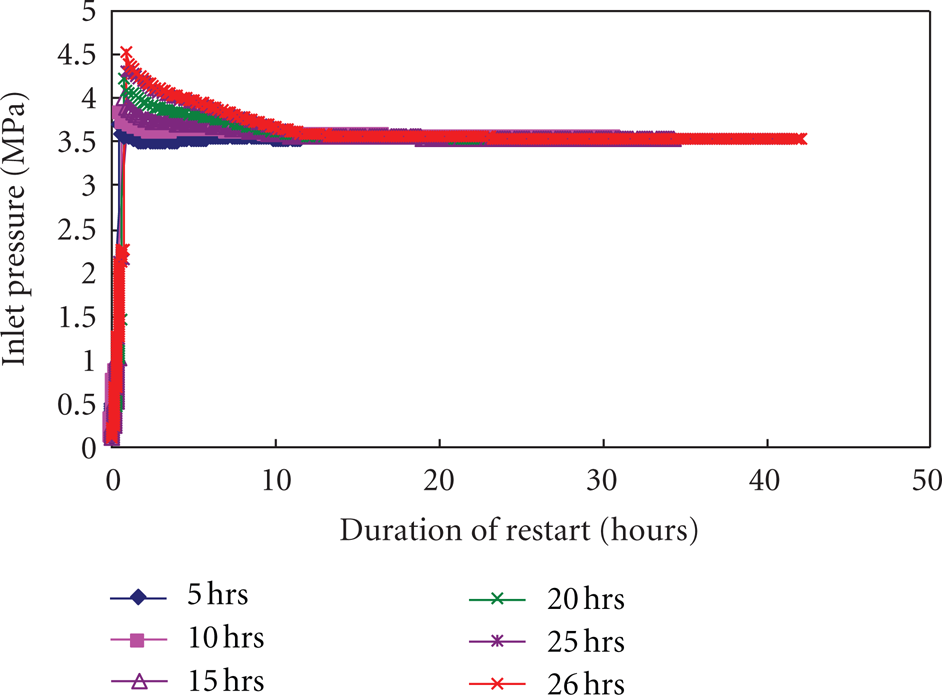
Inlet pressure with the duration of restart after different shutdown time of the 1st pipeline interval in December of the 3rd year of no pigging.

Inlet pressure with the duration of restart after the different shutdown time of the 1st pipeline interval in December of the 4th year of no pigging.
Inspection of Figure 13 reveals that the safe maximum shutdown duration for the first pipeline interval in December of the first year of no pigging is 40 hours, at which the inlet pressure already reaches the MAOP of the pipeline, namely, 4.32 MPa. When the shutdown durations lie between 40 and 44 hours, the retaining times of maximum inlet pressure on MAOP delay with the shutdown time and are 0.5 hour, 1 hour, 2.3 hours, and 3.8 hours, respectively, as shown in Figure 14. The longer the duration of the maximum inlet pressure on MAOP is, the larger the risk of restart failure is. So, the safe maximum shutdown duration for the case in Figure 13 should be determined as 40 hours despite the fact that the pipeline interval may be restarted successfully above 40 hours but below 44 hours. Once the pipeline interval discussed was shut down over 44 hours under operation conditions in December of the first no-pigging year, it would not be restarted normally according to the operation regulations for the pipeline and emergency procedures should be activated.
From Figure 15, it is clear that the safe maximum shutdown duration for the first pipeline interval in December of the second year of no pigging is 42 hours. Between 42 and 45 hours of shutdown durations, the pipeline interval might be restarted but the risk of the restart failure is large. Over 45 hours, the pipeline interval could not be restarted normally.
From Figure 16, the safe maximum shutdown duration for the first pipeline interval in December of the third year of no pigging is 25 hours. Over 26 hours, the pipeline interval could not be restarted normally.
From Figure 17, the safe maximum shutdown duration for the first pipeline interval in December of the fourth year of no pigging is 18 hours. The pipeline interval could not be restarted normally when the shutdown delayed over 19 hours.
The restart safeties of the first pipeline interval during no pigging are derived from the above analysis and listed in Table 2.
Comparison of restart safety after shutdown.

In Table 2, SMSD is the abbreviation for safe maximum shutdown duration, IPRF for interval of possible restart failure, and CSDURN for critical shutdown duration unable to restart normally.
From Figure 13 to Figure 17, it could be found that the SMSDs of the first pipeline interval in Decembers during no pigging reduced with the growth of the wax deposition except in the second year. One of the causes is the final impact of wax deposition on the thermodynamics process during shutdown, which is discussed in Section 5.2. Another one arises from the fact that the growth of the wax layer reduces the effective inner diameter of the pipe resulting in the increasing of the restart pressure, even if the reduction of the throughput can counteract partly this tendency. Furthermore, the IPRF almost does not exist since the second year, which implies that there is no buffer between safe restart and the limit state of restart failure after the second year of no pigging, namely, the restart safety margin of the pipeline reduces.
6. Conclusions
In this paper, the characteristic of the wax deposition of a waxy crude oil pipeline is investigated. A new model for wax deposition is established and validated by the field data. Besides, the effects of wax deposition on shutdown and restart process of the crude oil pipeline are studied and the following conclusions are obtained.
The wax deposition in a long-term unpigged hot crude pipeline decreases the heat loss of the pipeline to the surroundings at any time and the heat accumulation in the soil as well. The insulation of the wax deposition is beneficial to the heat preservation of a hot crude pipeline during its normal running, especially under decreasing throughputs. However, the reduction of the flow rate reduces the outlet oil temperature during the normal operation, leading to a lower oil temperature with the same shutdown duration. Finally, the increasing insulation for the pipeline and the reducing flow rate caused by the growth of wax deposition jointly affect the safety of the shutdown and restart of such a special pipeline.
Footnotes
Acknowledgment
The study is financially supported by the National Science Foundation of China (no. 51134006).