
Abstract
In conventional directional sensor networks, coverage control for each sensor is based on a 2D directional sensing model. However, 2D directional sensing model failed to accurately characterize the actual application scene of image/video sensor networks. To remedy this deficiency, we propose a 3D directional sensor coverage-control model with tunable orientations. Besides, a novel criterion for judgment is proposed in view of the irrationality that traditional virtual potential field algorithms brought about on the criterion for the generation of virtual force. Furthermore, cross-set test is used to determine whether the sensory region has any overlap and coverage impact factor is introduced to reduce profitless rotation from coverage optimization, thereby the energy cost of nodes was restrained and the performance of the algorithm was improved. The extensive simulations results demonstrate the effectiveness of our proposed 3D sensing model and IPA3D (improved virtual potential field based algorithm in three-dimensional directional sensor networks).
1. Introduction
The sensory ability of WSNs to physical world is embodied in coverage which is often used to describe the monitoring standard of Quality of Service (QoS) [1, 2]. Coverage optimization in sensor networks plays a significant role in allocating network space, realizing context awareness and information acquisition, and enhancing the viability of networks [3].
Early studies on coverage optimization were based on two-dimensional sensory domain model [4, 5], or 0-1 probability sensory model. For instance, the virtual force algorithm (VFA) proposed by Zou and Chakrabarty [6] moves nodes after all nodes' moving paths have been determined. The authors of [7] proposed an approximate centralized greed algorithm to solve the maximum coverage problem with minimum sensors. Coverage in terms of the number of targets to be covered is maximized, whereas the number of sensors to be activated is minimized. The target involved virtual force algorithm (TIVFA) is proposed by Li et al. [8] and potential field-based coverage-enhancing algorithm (PFCEA) aiming at directional sensor model is proposed by Tao et al. [9]. The authors of [10] discussed multiple directional cover sets problem of organizing the directions of sensors into a group of nondisjoint cover sets in each of which the directions cover all the targets so as to maximize the network lifetime. In [11], which is written by me, I improved the criterion for judging the generation of virtual potential field via cross-set test. However, probability-based three-dimensional sensor networks model is more tending to be in conformity with practical application, for example, the recently arisen multimedia sensor networks [3, 12–16] and underwater networks [17]. In view of three-dimensional sensory model and probability sensory model, overseas and domestic researchers have yielded some research achievements on coverage algorithms in recent years. I proposed a virtual force algorithm which is applicable with three-dimensional omnidirectional sensory model in [18]. Authors of [19] put forward a three-dimensional directional sensory model and optimized coverage performance using virtual potential field and simulated annealing algorithm. Reference [20] proposed a coverage configuration algorithm based on probability detection model (CCAP). Reference [21] proposed a coverage preservation protocol based on probability detection model (CPP) that makes working nodes in sensor networks as few as possible when network coverage is guaranteed. However, this protocol configures network using centred control algorithm which limits the network scale, and at present most of the literatures have not introduced this probability coverage model into three-dimensional sensor networks. In fact, most practical applied wireless sensor networks are deposited in three-dimensional sensor networks so that it will be more accurate if it is simulated in a three-dimensional space [22, 23]. In [22], Bai et al. proposed and designed a series of connected coverage model in three-dimensional wireless sensor networks with low connectivity and full coverage. In [23], Alam and Haas studied truncated octahedron deployment strategy to monitor network coverage situation. But in most studies, the criterion for the generation of repulsion between two points is simply defined as the situation that the distance between nodes is less than twice the sensory radius, which has been proved inappropriate to directional sensor networks in [11] by me. Therefore, first we analyze the sensory ability of three-dimensional directional sensor based on probability model to design a novel direction-steerable three-dimensional directional sensor model and make use of virtual potential algorithm to adjust node direction to improve coverage effect. In particular, in this paper we proposed a more rational criterion for generation of repulsion in three-dimensional directional sensor networks and introduced a factor called coverage impact factor to estimate the impact on network coverage from the change of sensing direction in advance, to reduce profitless adjustment of sensing direction, save node energy, enhance algorithm performance, and optimize coverage effect.
This paper is organized as follows: Section 2 gives the problem description and related definition. Section 3 describes the improved virtual potential field-based algorithm in three-dimensional directional sensor networks based on probability model. Section 4 describes in detail the algorithm flow. Section 5 verifies the validity of the algorithm via simulation experiments and makes contrast. Section 6 draws conclusion.
2. Coverage Enhancement Issues of Three Directional Sensor Networks
2.1. Problem Formulation
The coverage enhancement issue of three directional sensor networks that is constituted by direction-steerable nodes can be described as follow: how to enhance the degree of coverage by changing the sensing direction so that degree of coverage in target area approaches maximum in condition that a certain number of nodes are randomly distributed in a given three-dimensional target area and part of the area is not covered by nodes and the number and position of nodes are stable.
2.2. Analysis and Definitions on Coverage Enhancement Issue in Directional Sensor Networks
For the purpose of later research, we give the consumptions beforehand, shown as follows.
Every node works independently, namely, sensory task of each node does not depend on others'. All nodes are isomorphic, namely, all the maximum sensory distance Every node can get the information of its location and sensing direction and the direction is steerable.
Limited by the angle of view, the sensory area of the directional sensor model is abstracted to a tetrad

Directional sensor model.
Definition 1 (directional sensor model
).
L is location of nodes, that corresponds to (
In particular, when
Definition 2 (probability detection model).
In this part, we define the sensor sensing accuracy model. Sensing accuracy of sensor
We assume that a sensor can always detect an event happening at the point with distance 0 from the sensor, and the sensing accuracy attenuates with the increase of the distance. One possible sensing accuracy model is [24]

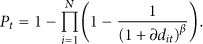
Sensor node density is usually higher. Assume that N sensor nodes are randomly distributed in a three-dimensional monitoring area. Therefore, events in the monitoring area are detected by multiple sensor nodes simultaneously. The sense probability is expressed as follow:

Substitute into Formula (1)
According to (3),
Definition 3 (maximum sensory distance
).
The maximum sensory distance of nodes is defined as

In condition of node
Definition 4 (sensory domain of node
).
For ease of later calculation, we translate the directional sensor model in Figure 1 into that in Figure 2 and give the following definition.
The sensory region is part of a sphere that centred on


Sensory domain of node.
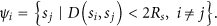
Definition 5 (Set of neighbor nodes
).
In sensor network, two nodes are called neighbors when Euclidean distance is less than twice the maximum sensory distance
Definition 6 (γ-probability coverage).
In a set of active nodes located at (
Definition 7 (degree of coverage).
A given area S is equally divided into M small areas which can be assumed as points as M is large enough. If there are Q points in the M points that accord with γ-probability coverage, coverage rate of area S is defined as

Definition 8 (coverage impact factor).
Coverage impact factor μ characterizes the impact on network coverage when the sensing direction angle has been changed. We define it as follows:

3. The Improved Virtual Potential Field-Based Algorithm in Three-Dimensional Directional Sensor Networks
Taking the deployment cost of sensor network into consideration, it would be unpractical that all nodes are capable of moving. Moreover, the movement of sensor nodes usually causes the invalidation of part of sensor nodes and in turn changes the topology of the whole sensor network. All these factors raise the maintenance cost of network. Therefore, we assume that all nodes remain at the same location as initial and coverage can be enhanced by changing sensing direction of nodes. We introduce the concept of centroid.
3.1. Judgement on Overlap Situation of Sensory Area
In traditional algorithms, which use the virtual potential field to enhance coverage, the criterion for the generation of repulsion between two points is that the distance between nodes is less than

A case that distance is less than
Therefore, in this paper, the criterion for generation of repulsion between two nodes is defined as whether or not there is overlap sensory region between two nodes.
To three-dimensional directional sensor networks model, when judging whether there is overlapped sensory region between two nodes, we project the sensory region onto planes

The situations of overlap of sensory region in directional sensor model.
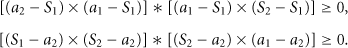
We simplify the sectorial sensor model of a two-dimensional space into a triangle by replacing the arc in sector by line, because only under the circumstances of (c) and (d) in Figure 4 can the decision outcome be different. It can be seen in Figure 4 that the area of the overlap region under the two circumstances is small compared to the whole sensory region, so it is inefficient to waste energy and adjust deployment of nodes for that purpose.
After simplifying, we can determine whether the two triangles have overlap region according to whether they have intersecting sides by mean of cross-set test. As shown in Figure 5, a triangle with overlap region must have intersecting sides. For example, in Figure 5,

Two sensor models with overlap sensory region.
3.2. Analysis on Regulation of Node Rotation
3.2.1. Analysis on Regulation of Centroids
Nodes

Using the method of Section 3.1, only when there is overlap region between two nodes, repulsion between centroids of two nodes exists.
3.2.2. Analysis on Rotation Angle
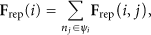
The resultant repulse force actions on centroid
4. Algorithm Description
According to the virtual force of the centroid of each node, a node deployment adjustment algorithm is proposed as follows in this paper. The algorithm is a distributed algorithm and executes simultaneously in each node. We equally divided the sensing area S into M small areas. M is large enough so that the small areas could be assumed as points. When area degree of coverage is calculated according to formula (7), the target point should be satisfied with γ-probability coverage. Take node
(1) t←0; (2) set the maximum cycle index (3) determine the initial position of corresponding centroid of (4) while ( (5) renew the current coordinate position of centroid (6) determine the repulsion force (7) if (8) determine the later target location centroid (9) calculate the coverage impact factor μ of angle rotation this time according to Formula (8) (10) if (11) else break; (12) t← (13) end.
Algorithm 1
5. Algorithm Simulations and Performance Analysis
We developed the simulation software Sencov3.0 that applicable to the research of sensor network deployment and coverage with VC++6.0, using which we verify the validity of IPA3D algorithm through extensive simulation experiments. Values of specific parameters are shown in Table 1. We can see from formula (4) that
Experiment parameters.

5.1. Case Study
250 nodes are randomly deployed in a

Coverage optimization under IPA3D algorithm.
5.2. Algorithm Convergence Analysis
We carry out a group of experiments with five kinds of network node scale so as to analyze IPA3D algorithm convergence. According to every network node scale, we randomly produce 20 topological structures, respectively, and calculate the algorithm convergence times and average. Experimental data are shown in Table 2 with parameters
Convergence analysis on experimental data.

Based on the above analysis we can reach a conclusion that the convergence of IPA3D algorithm, that is, the adjustment number of times, does not change conspicuously along with sensor network node scale. The value ranges from 70 to 80; thus IPA3D algorithm has a nice convergence.
5.3. Comparative Analysis of Algorithms
In this section, a series of simulation experiments are conducted to illustrate the effect on the performance of IPA3D algorithm from the three key parameters. They are node scale N, maximum sensory distance
It can be seen from the curve in Figure 7 that when

Effect on node scale N on condition of
We can see from the curve in Figures 8 and 9 that the effect on this algorithm from maximum sensory distance of nodes
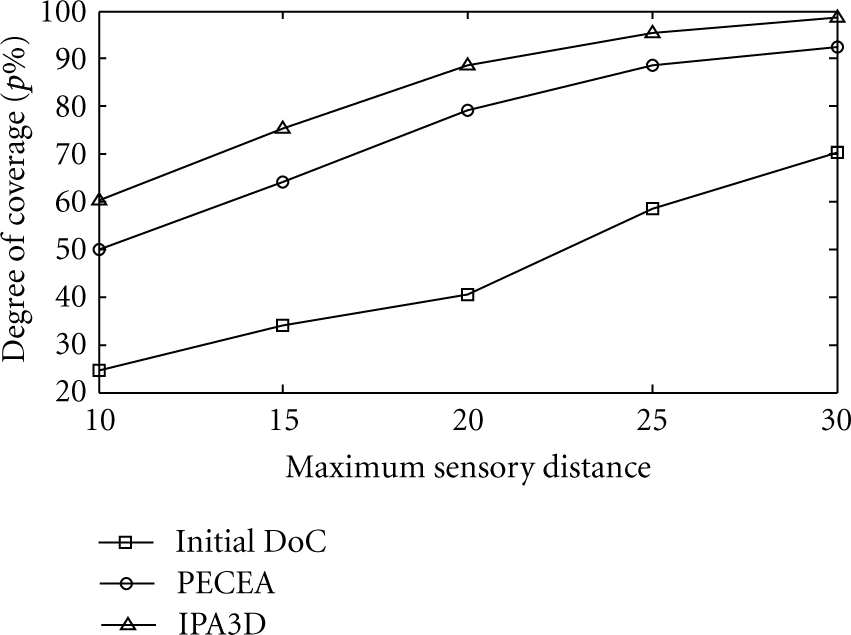
Effect on maximum sensory distance of nodes

Effect on sensory angle of deviation α on condition of
As can be seen from Figures 7, 8, and 9 that compared to the PECEA algorithm in [9], under the same parameter value, the proposed IPA3D algorithm increases the coverage quality most significantly after the optimization of the initial deployment, which illustrates the superiority of this algorithm.
5.4. Analysis on Coverage Impact Factor
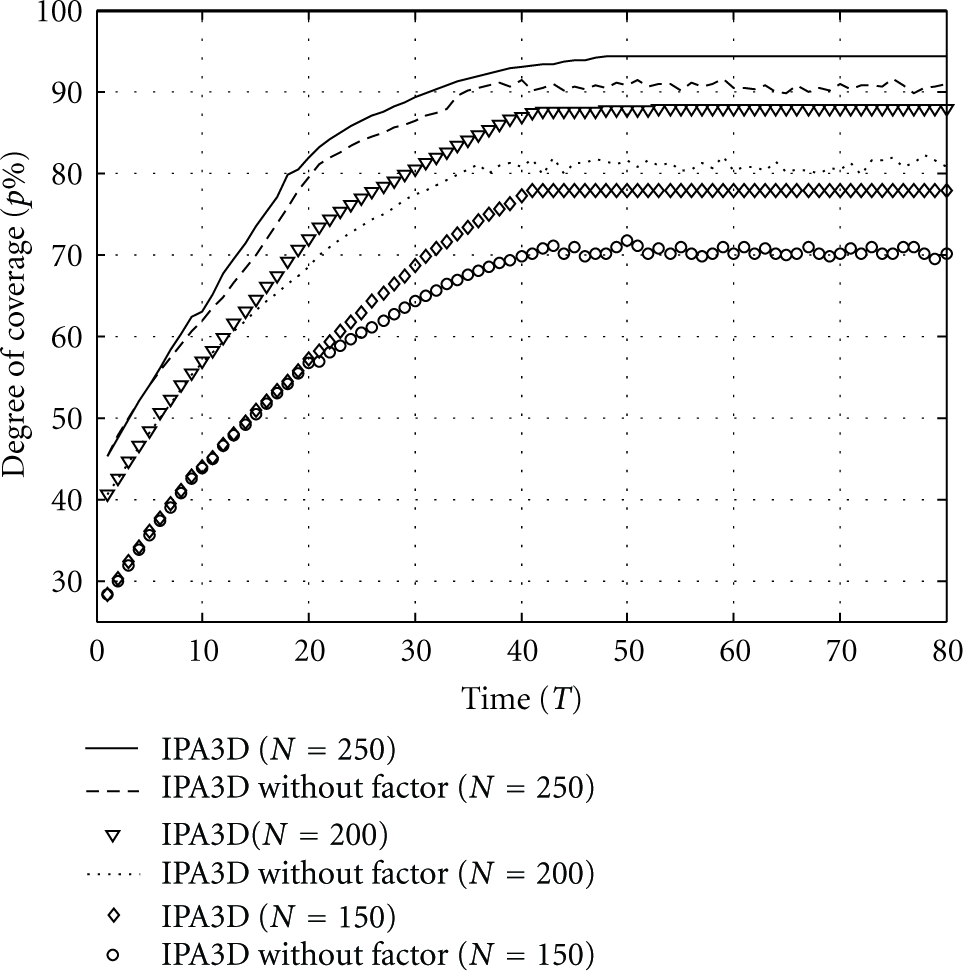
In this paper, we introduced coverage impact factor and use it to judge the impact on degree of coverage from the change of sensing direction angle and thereby to decide whether the node sensing direction angle should rotate. We illustrate the impact through a series of simulation experiments with
Figure 10 shows the impact from coverage impact factor on algorithm in different node scales. According to three different network node scales, 10 topologic structures are randomly generated. Record the changes of network degree of coverage when algorithm is running and average. From the curves in Figure 10 we can see, in the first 30 loops of algorithm that the degree of coverage increases sharply and exponentially. So adding coverage impact factor or not has little impact on algorithm performance. However, with the increase of algorithm execution time, algorithm degree of coverage without coverage impact factor presents a fluctuating state and overall degree of coverage stops increasing while algorithm degree of coverage with coverage impact factor shows a gentle rising trend and finally reaches stable state with degree of coverage remaining unchanged. The reason is that, without coverage impact factor, the force on a single node is according to neighbor nodes set
Impact on algorithm performance from coverage impact factor in different node scale.
6. Conclusions
This paper proposed a probability-based three-dimensional directional sensory model, and based on which a novel criterion for judgment is proposed in view of the irrationality that traditional virtual potential field algorithms brought about on the criterion for the generation of virtual force. Cross-set test was used to determine whether the sensory region has any overlap and coverage impact factor is introduced to reduce profitless rotation from coverage optimization, thereby the energy cost of nodes was restrained and the performance of the algorithm was improved. In simulation experiment, first we verified the convergence of the algorithm and then the effect on the algorithm from the key parameters and the validity of IPA3D were demonstrated by the comparison between IPA3D and PECEA under the effect of key parameters. Also, we confirmed and analyzed the impact on IPA3D algorithm from coverage impact factor through simulation experiment. The proposed algorithm effectively improved the coverage performance of traditional virtual potential field algorithms but the energy consumption caused by the change of sensing direction angle were not taken into account which is for further study.
Footnotes
Acknowledgments
The subject is sponsored by the National Natural Science Foundation of China (Nos. 60973139, 61003039, 61170065, and 61171053), Scientific and Technological Support Project (Industry) of Jiangsu Province (Nos. BE2010197, BE2010198), Natural Science Key Fund for Colleges and Universities in Jiangsu Province (11KJA520001), the Natural Science Foundation for Higher Education Institutions of Jiangsu Province (10KJB520013, 10KJB520014), Academical Scientific Research Industrialization Promoting Project (JH2010-14), Fund of Jiangsu Provincial Key Laboratory for Computer Information Processing Technology (KJS1022), Postdoctoral Foundation (1101011B), Science and Technology Innovation Fund for Higher Education Institutions of Jiangsu Province (CXZZ11-0409), the Six Kinds of Top Talent of Jiangsu Province (2008118), Doctoral Fund of Ministry of Education of China (20103223120007, 20113223110002), and the Project Funded by the Priority Academic Program Development of Jiangsu Higher Education Institutions (yx002001).