
Abstract
The low-energy consumption of IEEE 802.15.4 networks makes it a strong candidate for machine-to-machine (M2M) communications. As multiple M2M applications with 802.15.4 networks may be deployed closely and independently in residential or enterprise areas, supporting reliable and timely M2M communications can be a big challenge especially when potential hidden terminals appear. In this paper, we investigate two scenarios of 802.15.4 network-based M2M communication. An analytic model is proposed to understand the performance of uncoordinated coexisting 802.15.4 networks. Sleep mode operations of the networks are taken into account. Simulations verified the analytic model. It is observed that reducing sleep time and overlap ratio can increase the performance of M2M communications. When the networks are uncoordinated, reducing the overlap ratio can effectively improve the network performance.
1. Introduction
The increasingly popular M2M technology can enable machines to communicate directly with one another through wireless and/or wired system [1, 2]. With the increasing volume of wireless networks in recent years, the information can be exchanged between machine devices much easier and faster at low cost, which makes M2M technology more attractive to business as well as customers due to its huge potential on cost reduction and services improvement [3, 4]. Effective and reliable support from wireless networks for communications between the number of M2M devices is pivotal to the success of M2M technology. This paper aims to study the effectiveness of IEEE 802.15.4 network technology on support of M2M communications [5]. With increasing number of M2M devices which may be connected by IEEE 802.15.4 network, it is very likely to witness that multiple 802.15.4 networks are closely and independently deployed for M2M appellations. The interference of each other and hidden terminal problem may arise among these M2M devices, which can become severe problems for 802.15.4 networks-based M2M applications.
In this paper we investigate the issues of multiple uncoordinated coexisting 802.15.4 networks when they are closely deployed with sleep mode. Two representative network scenarios where two 802.15.4 networks are working in the sleep mode with different overlap ratios in the channel access periods are presented. We propose an analytic model to predict the system throughput and energy consumption with different media access control (MAC) parameters, frame length, the number of network devices for each network, and overlap ratios. The results show that the impact of uncoordinated multiple networks operations can lead to significant system performance drop when their channel access periods are most overlapped. The approaches of reducing sleep time and overlap ratio to increase the system performance are also studied. The analytic model is verified by simulations.
In the literatures, simulation-based evaluation of single 802.15.4 network has been widely reported including [6, 7]. Additionally, many analytic models have been proposed to capture the throughput and energy consumption performance of single 802.15.4 network with either saturated or unsaturated traffic. The limited scalability of the 802.15.4 MAC was pointed out by Yedavalli and Krishnamachari [8] where the performance in terms of throughput and energy consumption are studied. They showed that 802.15.4 MAC performed poorly when the number of contending devices was high. Mišić et al. proposed a Markov model to evaluate the throughput of 802.15.4 networks with unsaturated downlink and uplink traffic [9]. However, their analytical models do not have high accuracy. A simplified Markov model was proposed in [10], in which a geometric distribution was used to approximate the uniform distribution for the random backoff counter. But the approximation results in large inaccuracy in throughput prediction. A three-dimensional Markov model was proposed in [11] to evaluate the throughput of slotted carrier sense multiple access (CSMA). However, the state transitions in [11] were not correctly modelled. The model was revised with improved accuracy in [12]. Both Pollin et al. [13] and Singh et al. [14] also considered a star network topology and analysed the MAC protocol performance under assumption that saturated traffic conditions. They found out that a large fraction of packets was dropped during the channel access, and the dropping probability increases with the number of sensor devices. Park et al. [15] and He et al. [16] developed accurate analytical modes for 802.15.4 MAC protocol in the beacon-enabled mode for star network topology. In addition, the performance analysis was mainly targeted at validating the accuracy of the proposed model. Energy consumption and throughput performance of 802.15.4 MAC was analysed in [17]. However, none of these works has studied the uncoordinated operations of multiple coexisting 802.15.4 networks with sleep mode.
The remainder of this paper is organised as follows. In Section 2, we introduce the superframe structure and channel access algorithm of IEEE 802.15.4 standard briefly. Two scenarios and model assumption of the analytic model are introduced in Section 2 and the analytic model of two uncoordinated networks is presented in Section 3. Section 4 discusses the numerical results and performance analysis. The conclusions and future works are in Section 5.
2. Channel Access Algorithm of IEEE 802.15.4
An IEEE 802.15.4 network can work either in nonbeacon-enabled or in beacon-enabled mode [5]. In the nonbeacon-enabled mode, there are no regular beacons, and devices communicate with each other using unslotted CSMA-CA algorithm. In the beacon-enabled mode, the coordinator transmits regular beacons for synchronisation and association procedures to control communication. A superframe structure is imposed in the beacon-enabled mode as shown in Figure 1, whose format is defined by the coordinator. The superframe is bounded by network regular beacons, and can have an active portion and an optional inactive portion. All communications take place in the active period while devices are allowed to enter a low-power (sleep) mode during the inactive period. The structure of this superframe is described by the values of
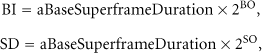

An example of the superframe structure. In this case, the beacon interval, BI, is twice as long as the active superframe duration, SD, and it contains CFP.
The active portion of each superframe shall be composed of two parts: a contention access period (CAP) and an optional contention-free period (CFP). The CAP shall start immediately following the beacon and complete before the beginning of CFP on a superframe slot boundary. If the CFP is zero length, the CAP shall complete at the end of the active portion of the superframe. We neglect every CFP in this study, because it is designed for low-latency applications requiring specific data bandwidth which means only CAP in each active portion of superframe structure. In CAP, communication among devices uses slotted CSMA-CA algorithm for contention access. The 802.15.4 slotted CSMA-CA algorithm operates in unit of backoff slot. One backoff slot has the length of 20 symbols. In the rest of the paper backoff slot is simply called slot unless otherwise specified.
According to the acknowledgement (ACK) of successful reception of a data frame, the slotted CSMA-CA algorithm can be operated in two modes: ACK mode, if an ACK frame is to be sent and non-ACK mode, if an ACK frame is not expected to be sent. In this paper we will work on the non-ACK mode. In the non-ACK mode, every device in the network maintains three variables for each transmission attempt: NB, W, and CW. NB denotes the backoff stage, representing the backoff times that have been retried in the slotted CSMA-CA process while one device is trying to transmit a data frame in each transmission. W denotes the backoff window, representing the number of slots that one device needs to back off before clear channel assessment (CCA). CW represents the contention window length and is used to determine how many slots for the CCA before transmissions. CW will be set to two before each transmission and reset to two when the channel is sensed busy in CCAs.
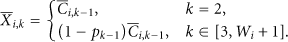
Before each device starts a new transmission attempt, NB sets to zero and W sets to
3. Model Assumption
There can be many scenarios with which the 802.15.4 networks may or may not interfere with each other if their operations are not coordinated when multiple 802.15.4 networks are deployed independently and closely. We assume two 802.15.4 networks are deployed closely and two simple representative scenarios are considered to focus on obtaining insights to the impact of uncoordinated operations on system performance.
We consider a star network topology with a PAN coordinator. These two networks are labelled by NET1 and NET2 with
(1) Scenario I
For this scenario we assume that both considered networks are operated on the same frequency channel and the communication range of each network is fully overlapped as shown in Figure 2(a). We consider the beacon-enabled mode as mentioned in the previous section. Each network has a coordinator, which is responsible for broadcasting the beacon frames in the beginning of superframes. For simplicity, we assume that the beacons from any network can be correctly received by all the basic devices which belong to that network. The two networks share the whole channel frequencies, which means they can detect each other's transmissions through CCAs. For this scenario, the CAPs from each network can be partially overlapped or fully overlapped with different overlap ratio g as shown in Figure 3. When

Communication range of each network is fully overlapped; (a) basic devices from two networks can detect each other's transmissions through CCAs; (b) basic devices from each network cannot detect transmission from other network's transmission through CCAs.
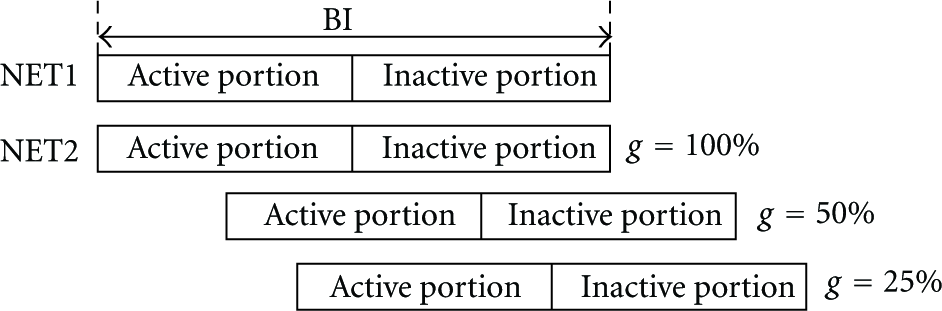
Illustration of channel access periods overlap in the superframe structure with different overlap ratio g, where g is the ratio of the number of slots in overlapped part to the number of slots in CAP,
(2) Scenario II
In this scenario, we assume these two networks share the channel frequencies and their communication range is fully overlapped as shown in Figure 2(b). We consider that the basic devices of each network can only hear transmissions from the other devices in its own network but cannot detect transmissions from other networks, which means that the CCA detections for each device are not affected by the channel activities from the other networks. This could happen because the distance between the basic devices and the two networks is too far to hear each other, although they operate on the same frequency channel. But the coordinators for the networks can detect transmissions from all the basic devices not only their own networks but also the other networks. With this assumption hidden terminals are present from neighbour networks. The transmissions could be collided by the data from other networks if they have overlap in the channel access portion. The same with Scenario I, when
4. Analytic Model for Scenarios
4.1. Analytic Model of Scenario I
In the superframe structure, there is no activity from any device in the inactive portion for each network. The system performance of networks in CAP for Scenario I could be analysed separately with two parts according to different overlap ratio g: nonoverlapped and overlapped part.
For the nonoverlapped part, the performance of networks could be analysed with the existing analytic model for single 802.15.4 network proposed in [12]. According to the idea of performance modelling in [12], the nonoverlapped part channel states sensed by each device of either 802.15.4 network can be modelled by a renewal process, which starts with an idle period and followed by a fixed length of L slots (frame transmission), as shown in Figure 4.

Example of channel renewal process for 802.15.4 networks. A random number of idle slots followed by a fixed length of transmission in the CAP.
The idle period depends on the random backoff slots and the transmission activities from each device. It is noted that the maximal number of idle slots is
Without loss of generality we consider NET1 and a tagged basic device in NET1. For the tagged basic device, its Markov chain consists of a number of finite states and each corresponds to a state of the CSMA-CA algorithm in one slot. These finite states are introduced below. Let
(1) Busy State
Denoted by

(2) Backoff State
Denoted by
(3) Sensing State
Denoted by
(4) Initial Transmission State
Denoted by
(5) Transmission State
Denoted by

The transmission probability

With the above expressions derived for transmission probability

Since the balance equations for all steady-state probabilities and expressions for

To analyse energy consumption, we use normalised energy consumption, defined in [17] as the average energy consumed to transmit one slot of payload. The energy consumption of transmitting a frame in a slot (denoted by
For the overlapped part of CAPs in Scenario I, we have the transmission probabilities

The Markov chain for the tagged basic device can be numerically solved again with the new channel busy probabilities. The throughput

For NET1 and NET2, the throughputs of overlapped part
The normalised energy consumptions of overlapped part for Scenario I are defined as

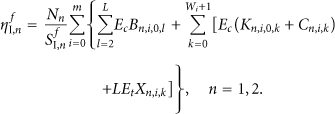
Now, we can combine the nonoverlapped and overlapped part of CAPs together with different overlap ratio g. The various sleep time in BIs with different SOs is also considered. For Scenario I, we have throughputs


The normalised energy consumption
4.2. Analytic Model of Scenario II
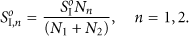
So far we have presented the performance analytic mode for Scenarios I with different sleep time and different overlap ratios. In this subsection we will give the analytic mode for Scenario II. Firstly, we assume that the two networks are fully overlapped in the CAPs (

Example of transmission collisions for two uncoordinated 802.15.4 networks for Scenario II.
The performance of NET1 under the impact of uncoordinated operation from NET2 is considered firstly. The impact of NET1 transmissions to NET2 performance can be analysed similarly. With the Markov chain states we can compute the transmission probability

For each transmission from NET2 following k idle slots there is a probability

Illustration of transmissions from NET1 with/without collisions with frames from NET2 for Scenario II.
We can calculate

The average probability

For Scenario II, the throughput of nonoverlapped part of each network can be calculated by (9) as done in Scenario I, for there is no interference from each other. Then we can calculate the throughput of overlapped part

Similarly we can use the same way to calculate the throughput of overlapped part

After the throughputs of nonoverlapped and overlapped part have been derived, we can calculate the throughputs

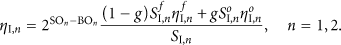
Because of the only impact on the transmissions in each network for Scenario II is the outcomes of frame reception. The normalised energy consumptions

5. Numerical Results and Performance Analysis
We consider an IEEE PHY at frequency band 2400–2483.5 MHz with O-QPSK modulation and data rate of 250 kbps. A discrete event simulator is used to investigate the performance of uncoordinated problem and verify the proposed analytic model. The symbol rate is 62500 symbols per second for the PHY and at most 3000 slots of data could be transmitted in one second. We set BO for each network is fixed 6, which means each superframe length BI is fixed 3072 slots for both NET1 and NET2. Then the CAP of each superframe is only decide by SOs. For example, if SO sets to 5, which means half of the superframe 1536 slots are active portion and the rest is inactive portion. We can vary different SOs for various sleep slots for both two networks to investigate the impact of sleep mode. Typical results are presented with default MAC parameters for NET1:
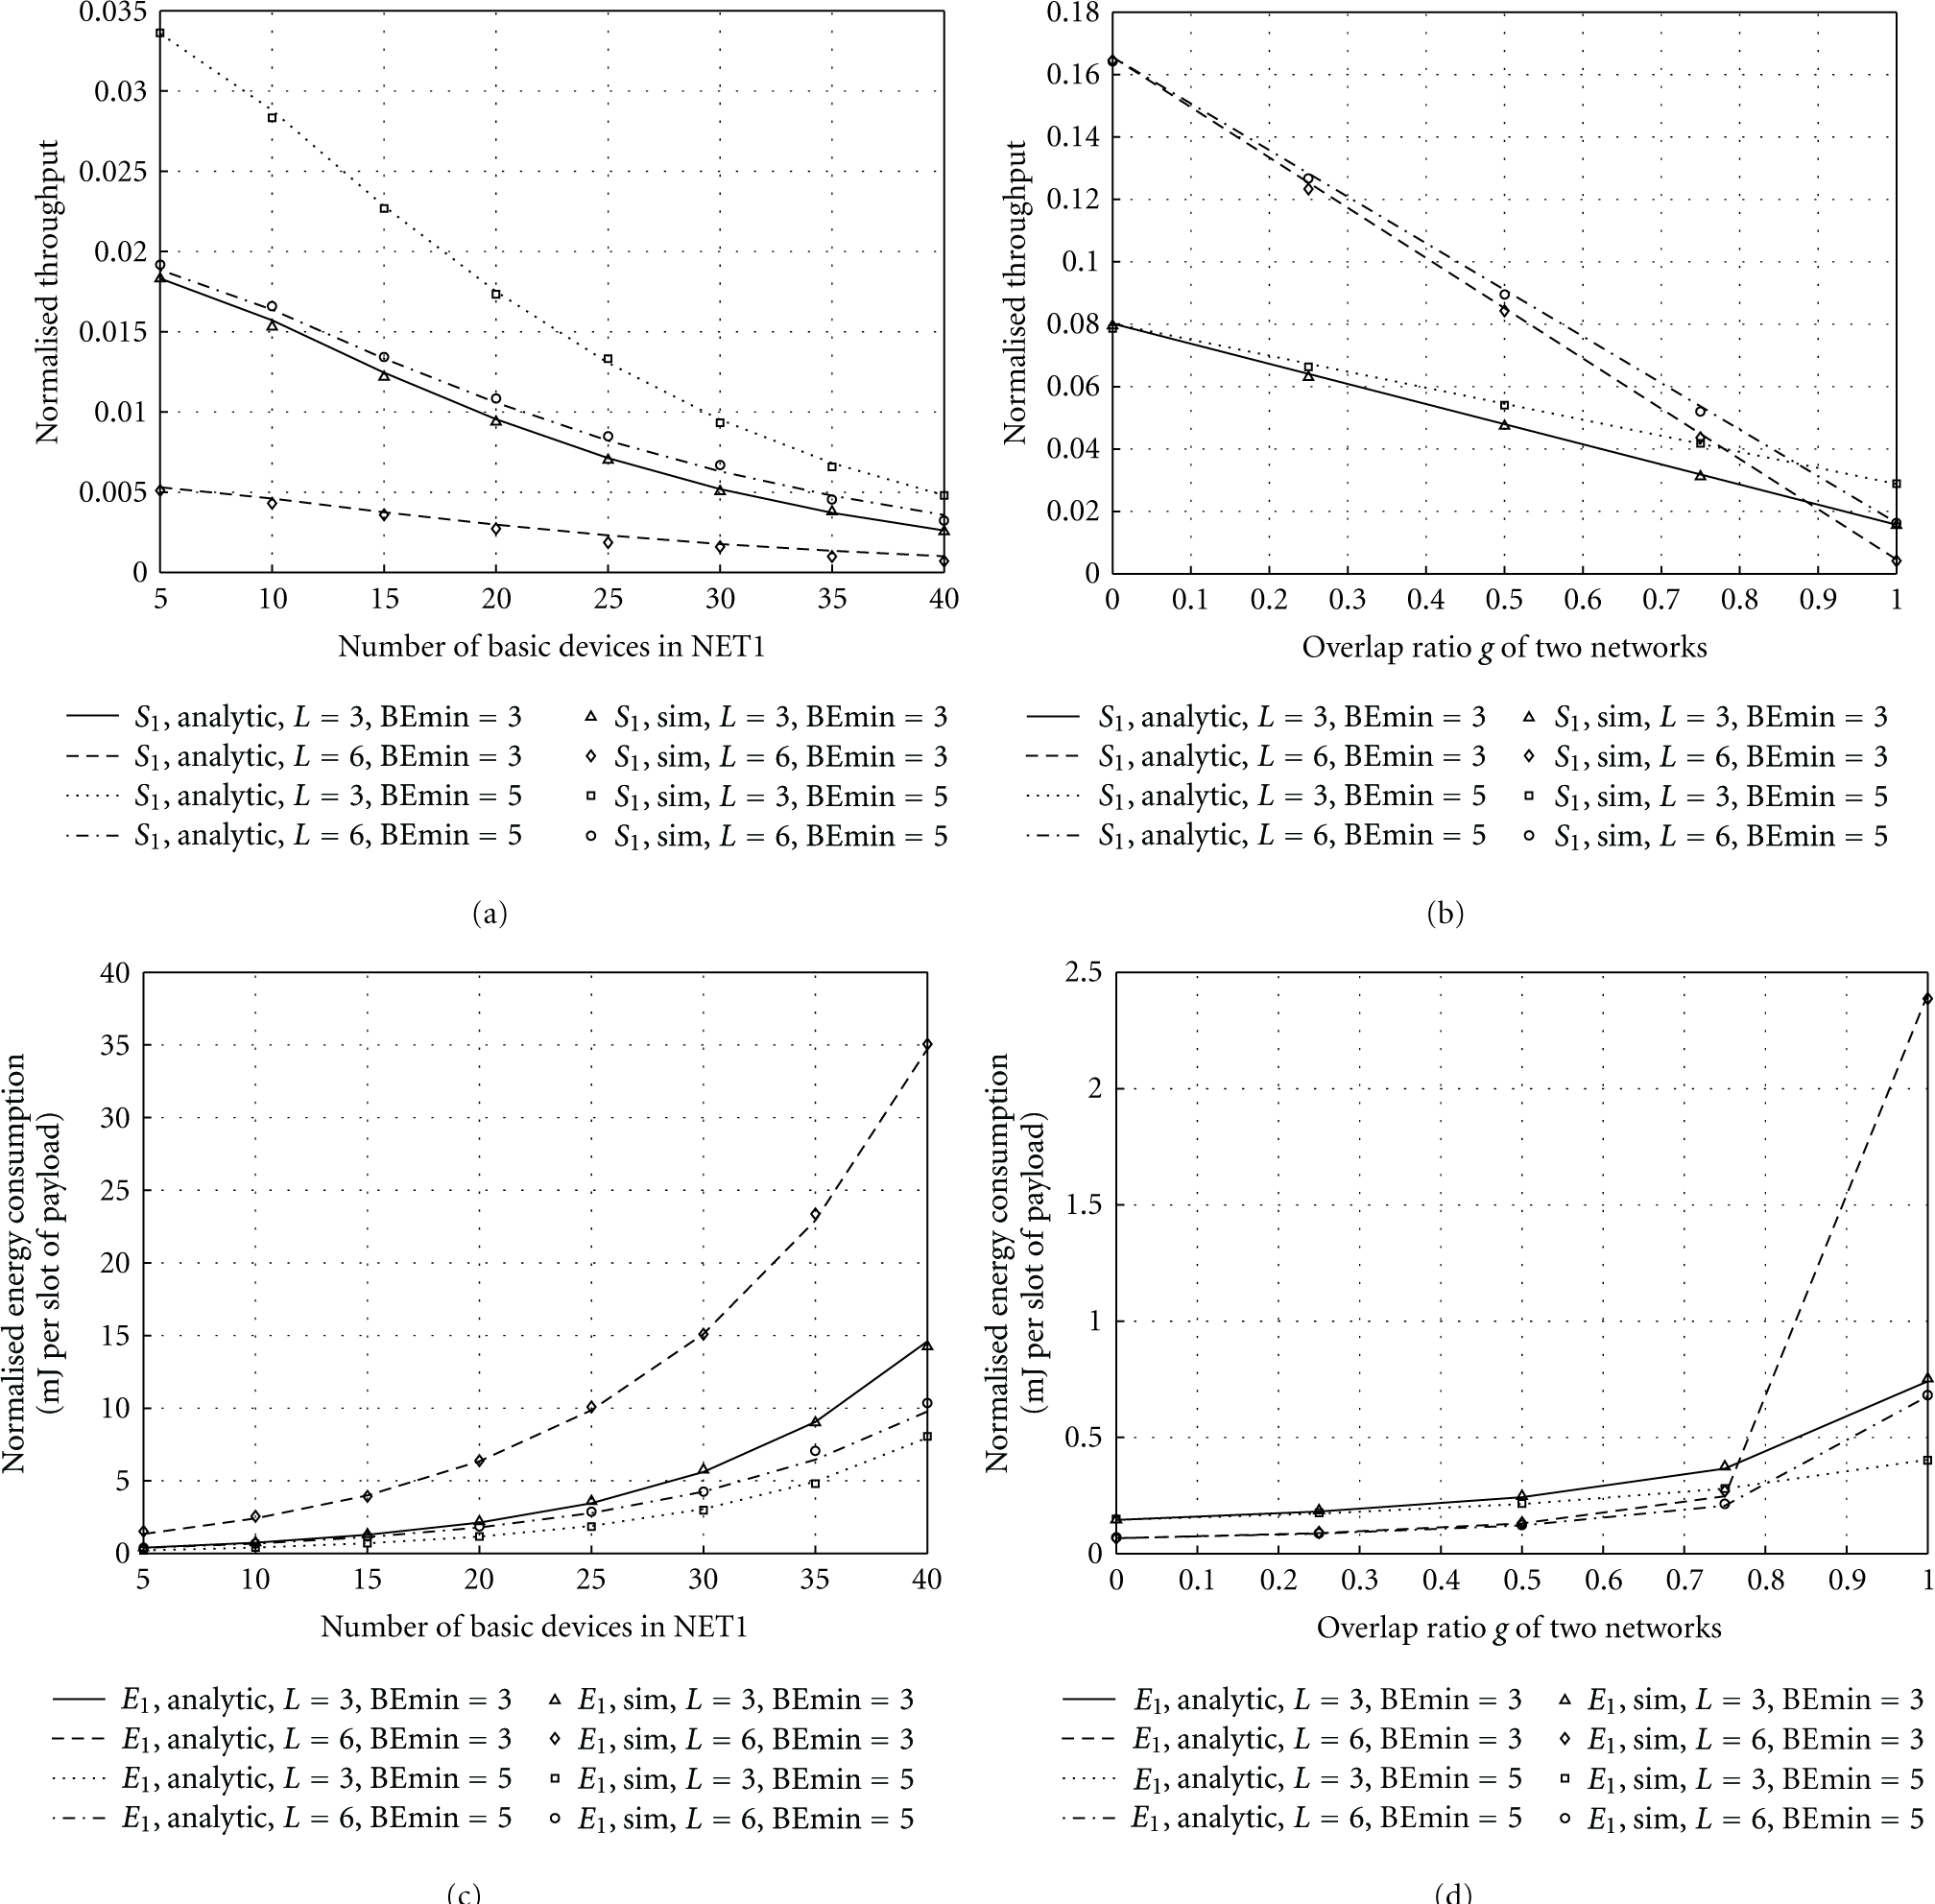
Figures 7(a)–7(d) give the normalised throughput and normalised energy consumption of Scenario I. Figures 8(a)–8(d) show the normalised throughput and normalised energy consumption of Scenario II.
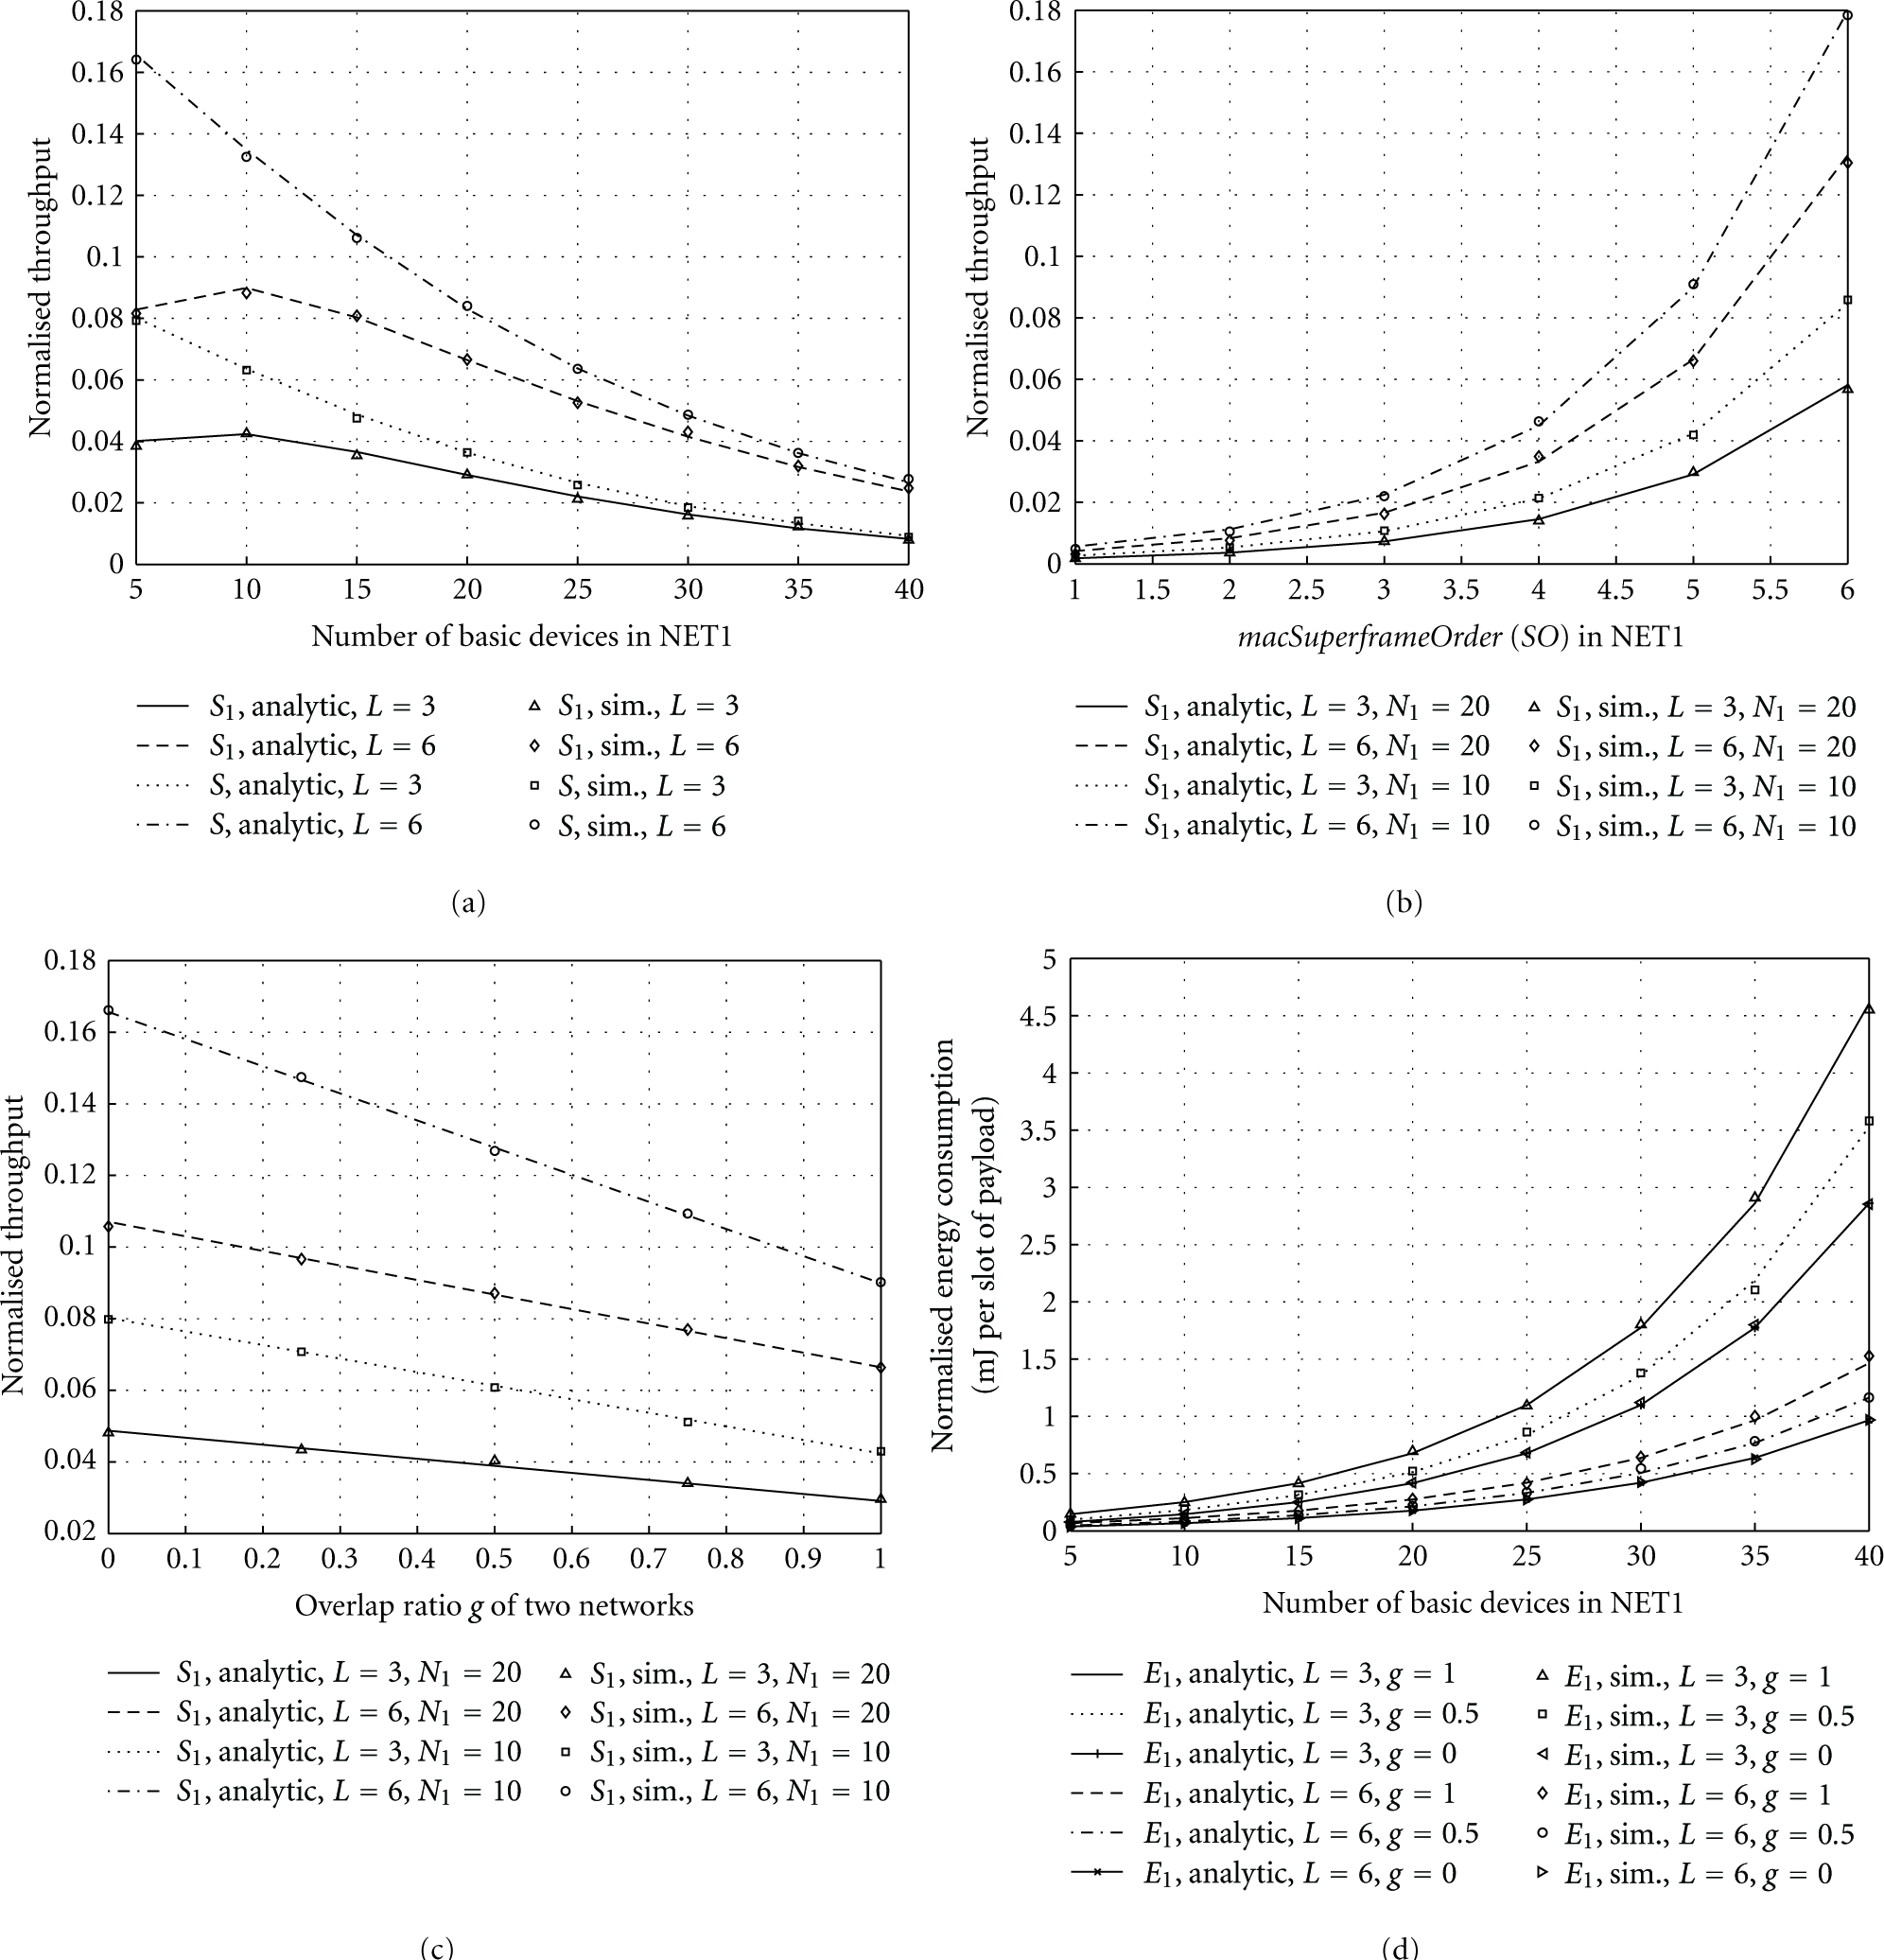
Normalised throughput S of overall system,
Normalised throughput
5.1. Analysis of Scenario I
Figure 7(a) shows the throughput S of overall system and throughput
Figure 7(b) presents the throughput
Figure 7(c) shows the relationship between throughput
Figure 7(d) represents the energy consumption
5.2. Analysis of Scenario II
Figure 8(a) shows that the throughput
It is observed that with increased random backoff window in NET2, the throughput
Figure 8(b) gives the throughput
Figures 8(c) and 8(d) represent the energy consumption
6. Conclusion
Wireless M2M networks could play a critical role in the M2M technology. In this paper, we investigated the effectiveness of IEEE 802.15.4 networks in support of M2M communications. Two representative scenarios of closely deployed and uncoordinated IEEE 802.15.4 networks are studied. An analytic mode was proposed to understand the impact of uncoordinated operations and sleep mode on the overall system performance. Simulations demonstrate the high accuracy of the proposed analytical model. It was observed that the uncoordinated operations of 802.15.4 networks have significant impact on the M2M application performances. Reducing sleep time and overlap ratio can improve the overall networks performances. But by reducing sleep time approach the energy consumption may be increased due to longer active periods. On the other hand reducing sleeping overlap ratio g in the channel access periods of networks can largely improve the throughput and decrease the energy consumption.
Footnotes
Acknowledgments
The work was supported by the UK Engineering and Physical Sciences Research Council (EPSRC) with Grant reference no. EP/1010157/1 and the National Natural Science Foundation of China (NSFC) under the Grant no. 61103177.