
Abstract
A key challenge in smart grid is to monitor the system modal characteristics of disturbance over a microgrid for system stability and diagnosis. The measurements at different phasor measurement units (PMUs) need to be reported to a processing center. Therefore, a multiple access scheme for wireless transmission is necessary to collect the measurements from PMUs. An analog oscillation analysis is carried out without demodulating the received signal. Both schemes of time-division multiple access (TDMA) and code-division multiple access (CDMA) are discussed. In both schemes, the Prony-based algorithms using the received signal to estimate the system modal characteristics, including the eigenvalues of the linear system and the amplitudes of different response modes, are proposed and analyzed. Two countermeasures, max-min ratio measure (MMRM) and variance measure (VM), are also proposed to prevent possible attacks of false reports. Numerical simulation results demonstrate the effectiveness of Prony-based algorithms and the two countermeasures.
1. Introduction
In recent years, smart grid has attracted many studies in the community of power system, communications, and networking. According to the Energy Independence and Security Act of 2007 (EISA), smart grid is defined as follows: “A modernization of the Nation's electricity transmission and distribution system to maintain a reliable and secure electricity infrastructure that can meet future demand growth” [1]. An important component in smart grid is the microgrid [2, 3], which is a subsystem containing multiple distributed energy generators (DEGs, such as microturbines, solar panels, or wind turbines) and multiple loads. A microgrid can work either together or independently with the power grid. In normal situations, the microgird is connected to the power grid and transfers energy either to or from the major power grid according to its own energy generation and consumption. When the power grid is unstable, for example, in a large area blackout, the microgird can be disconnected from the power grid and work in an island mode. At this time, its own DEGs will support the power load within the microgrid. Such a microgrid has been implemented in many testbeds, for example, the Electric Reliability Technology Solutions (CERTS) Microgrid supported by the US Department of Energy.
One problem impacting the reliability of power system is power system oscillations. Power system oscillations, caused by either network change or disturbance, appear as modes which are complex exponentially modulated sinusoids. Insufficiently damped modes may incur uncontrolled separation of the power system into islands, consequently resulting in blackouts. Therefore, for the reliability of a power system, it is important to estimate the power system state, detect and identify oscillation modes accurately and as early as possible. Oscillation exists not only in large power grids but also in microgrids. It may be even more severe in a microgrid than in a large power grid. However, the research of oscillations is very limited in microgrids. Therefore, it is important to study power system oscillation in microgrids for achieving a better reliability.
Currently, mode identification of power system oscillation is well studied in power grid. With the deployment of Phasor Measurement Unit (PMU), power oscillation detection and identification have been widely implemented in Wide-Area Monitor System (WAMS) [4, 5]. Typically, the system modal characteristics are estimated from the measurement of several synchronized PMUs. After taking the reports from the PMUs, a processing center will analyze the data and estimate the system modal characteristics, for example, the eigenvalues of the transfer function, as well as the amplitude of different components with different dampening ratios. If instability is detected, the system can take certain actions to stabilize the power grid.
An important aspect of microgrid is the communication infrastructure for monitoring the oscillation due to the requirement of real-time processing and high reliability. In such a communication infrastructure, the observations at PMUs are sent to a processor. One standard related to the communications of PMUs is IEEE C37.118 [6]. However the communication protocol defined in IEEE C37.118 only specifies a few message types with few options and allows the usage of any possible communication approaches for the PMUs to report to the processing center, for example, wireless communications or optical fibers. In traditional microgrids, wired communications are employed. For example, an RS-485 (digital computer based) link or an ethernet is used in the Oak Ridge National Lab (ORNL) microgrid system [7]. An alternative approach for the communication for DEG control is to use wireless communication systems due to its fast deployment. For wireless communication systems, the multiple access as shown in Figure 1 is a key challenge to the system monitoring since there exist several wireless PMUs reporting their observations. Since the data traffic is intensive, it is improper to use random access schemes like carrier sense multiple access (CSMA), which might incur too many collisions. Depending on whether collisions are allowed or not, we can consider orthogonal or nonorthogonal multiple access schemes.
Orthogonal: for simplicity, we consider only the time-division multiple access (TDMA) scheme. The corresponding system estimation is straightforward. The challenge is how to deal with the time offset of reports from different PMUs due to the TDMA. Nonorthogonal: we consider the code-division multiple access (CDMA), which allows collisions. One traditional approach is to first recover the original reports from the mixed received signal. However, this may not be the most efficient approach. We will study the approach of estimating the system state directly from the received signal.
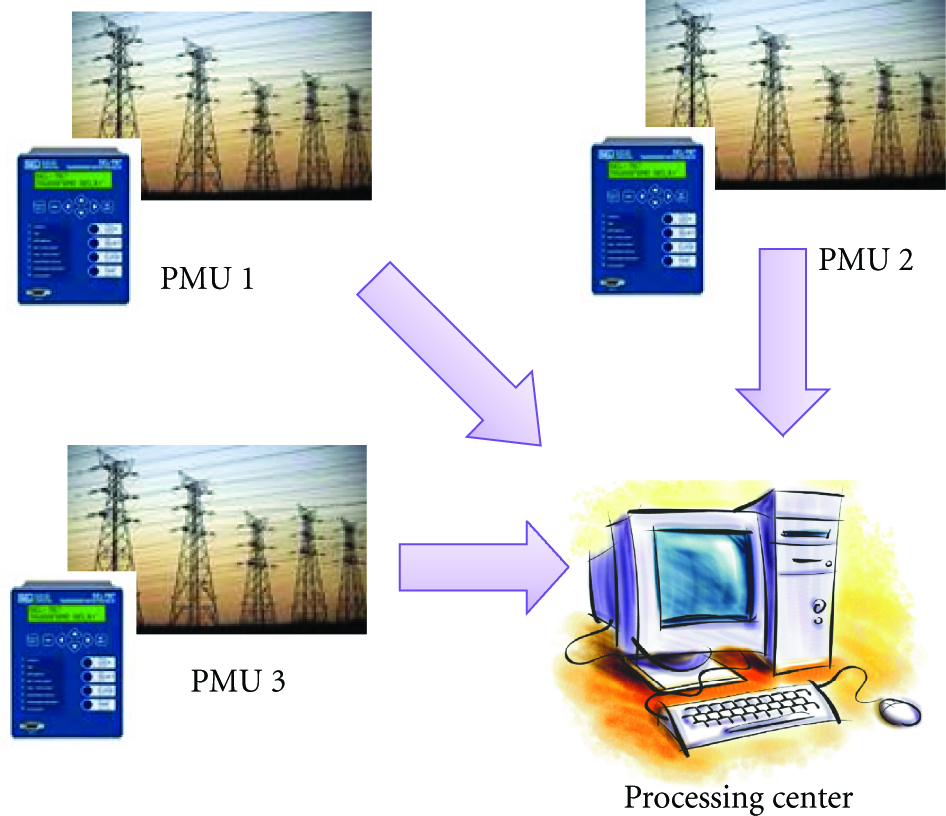
An illustration of the multiple access of PMUs.
In this paper, we will study both approaches. The power system will be modeled as a linear system with the assumption of small signal perturbations. The system modal characteristics will be estimated using Prony's algorithm [8, 9], which will be made compatible with the TDMA and CDMA schemes. The Cramer-Rao-bound (CRB) covariance matrix for both TDMA- and CDMA-based Prony methods will be derived. Both TDMA and CDMA approaches will be compared using numerical simulations. The conclusions will provide insights for the design of communication infrastructure in microgrids and advance the signal processing techniques in the system modal characteristics estimation of microgrids. Moreover, we consider the case in which there exists an attacker and discuss how to detect the attack when attacking happens. We propose two variance-based countermeasures to identify the attack.
The remainder of this paper is organized as follows. Related work for modal identification of power system oscillation will be provided in Section 2. The system model will be introduced in Section 3. The multiple access schemes of TDMA and CDMA will be discussed in Section 4. The CRB covariance matrices for both TDMA- and CDMA-based Prony methods are derived in Section 5. The countermeasures for possible attacks are proposed in Section 6. Then, we will show the numerical simulation results in Section 7. Finally, the conclusion will be drawn in Section 8.
2. Related Work
Parametric modal identifications are widely used in power systems. One main method is based on eigenvalue analysis. However, the disadvantage of eigenvalue analysis is that it requires the knowledge of the system matrix. The difficulty of monitoring the whole state space system matrix prevents it from online tracking of power oscillation modes. In contrast, low-order linear estimations are suitable for online tracking of power oscillation modes. The advantage of these methods is that they do not require the linearization of the system and the associated large-scale system matrix. The low-order linear estimation methods include Steiglitz-McBride Algorithm (SMA) [10], Eigensystem Realization Algorithm (ERS) [11], and Prony method [12]. SMA uses an iterative procedure to adjust the coefficients of a transfer function; ERA is based on singular value decomposition of the Hankel matrix associated with the impulse response of the system; the Prony method is based on a linear prediction model, which estimates parameters to fit a finite number of samples of a signal. In [13] the performances of these three algorithms are well compared. Numerical results show that Prony method has more accurate outputs for various inputs. Therefore, in this paper we focus on the Prony method for the mode identification of power system oscillation in microgrids.
The Prony method has been widely applied in power systems for mode identifications [12, 14–20]. Currently the online Prony analysis has been deployed for operation in many places, for example, Jiangsu in China [4] and the Western Electricity Coordinate Council [5]. The first application of Prony method for power system oscillation is [12, 14] which used field measurement data. The Prony method proposed in [12, 14] is based on the least square error criterion and processes each signal independently. However, Prony method is sensitive to noise. The Prony analysis of individual signals may have conflicting frequencies and damping coefficients. References [8, 21] have extended the Prony method to analyze multiple signals simultaneously in order to improve the accuracy. In our paper, we also combine multiple signals to improve the accuracy of Prony analysis. The contribution of our paper is that the system state is directly estimated from the received signal without recovering the original information bits, which is coined analog oscillation analysis. References [22, 23] derived the CRB covariance matrix of Prony method with single and multiple signals, respectively. [24, 25] derived the covariance matrix for singular-value-decomposition- (SVD-) and total-least-square (TLS) based Prony method, respectively. In our paper, the CRB covariance matrices for TDMA- and CDMA-based Prony methods are derived.
3. System Model
We model the power grid as a linear system, whose dynamics are given by [9]

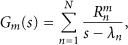
Consider the mth output
The observation at PMU m is then given by

Suppose that each PMU samples the continuous-time observation with time step

We suppose that the communication system for the monitoring system has a bandwidth W. The time is divided into time chips; each has a time interval

4. Multiple Access Schemes
In this section, we discuss two types of multiple access schemes, namely, the TDMA and CDMA. We assume that the reports from different PMUs are honest. Usually, the observations at the PMUs have a very high signal-to-noise ratio (SNR). We also assume that the communication channel quality is very good and has a high SNR. Therefore, we ignore the noise in the discussion in this section. The impact of noise will be evaluated in the numerical simulations where the algorithms with the assumption of no noise will be applied in the noisy case.
4.1. TDMA
In TDMA, we simply let the PMUs report their measurements in a fixed order. We can set

Upon receiving


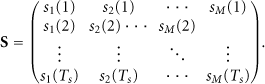
We can consider the whole quantity of
To solve the equation for the unknowns The coefficient vector Solving the polynomial equation (11) for Calculating eigenvalues Solving (7) for the amplitudes Order the eigenvalues


4.2. CDMA
In the CDMA scheme, collisions among the PMUs are allowed. We define a symbol period as

Upon receiving W symbol periods and putting the received signal together, the received signal is given by


One approach is to use a CDMA demodulator to compute

Two approaches for the system estimation with CDMA.
However, by observing the similarity between (7) and (19), we can propose a new algorithm as shown in Figure 2(b) to apply the Prony's method again as follows.
Consider term Obtain Then, we use (19) to compute the amplitude components in


5. Cramer-Rao-Bound Covariance Matrix for Multiple Access Scheme
In this section we derive the CRB covariance matrix for estimating
5.1. TDMA
In TDMA systems, the received signal from the mth PMU can also be written as


Then, the likelihood and log-likelihood of data from all M PMUs are given by


In order to calculate the CRB covariance matrix, the following parameters are defined. The real and imaginary parts of

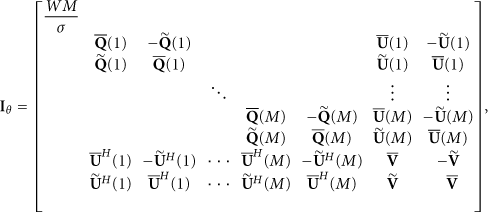
Then the Fisher information matrix


The proof of (28) can be found in Appendix A.
Then the CRB Covariance matrix
5.2. CDMA
In CDMA systems, the received signal from all M PMUs for time slots

Then the likelihood and log-likelihood of data from all M PMUs are given by


Then the Fisher information matrix


The corresponding proof can be found in Appendix B.
Then the CRB covariance matrix

6. Countermeasure for Attacks
In the previous procedure of system modal characteristics estimation, we implicitly assume that all PMUs are honest and report their observations faithfully. However, in practice, a PMU could be compromised by a malicious party. It is also possible that the sensor at the PMU malfunctions and gives wrong readings. The false report could result in a significant error in system estimation or could even incur power system instability as a result of the system taking an incorrect control action due to the wrong state estimation. In this section, we study the countermeasure for detecting possible attacks.
6.1. Attack Model
Attacks are defined as all events which generate data including false or faked mode characteristics. We notice that the amplitudes
6.2. Attack Detection
The procedure of detecting the attack and attacker is shown in Figure 3. As shown in the procedure of the Prony analysis in Section 4, the normal PMU and compromised PMU share the same set of estimated eigenvalues
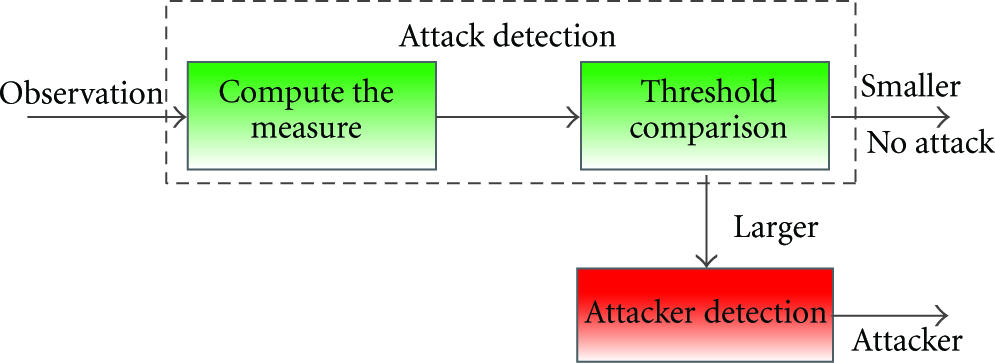
An illustration of the detection of attack and attacker.
6.2.1. MMRM Approach
MMRM is based on the ratio of maximum and minimum absolute amplitudes of


An illustration of the max-min ratio measure for Prony analysis for TDMA, SNR = 30 dB.
6.2.2. VM Approach
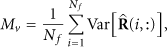
VM is based on the variance of each row of

An illustration of variance measure for Prony analysis for TDMA, SNR = 30 dB.
6.3. Attacker Detection
Once the processing center finds that an attack has been launched, the next job is to detect the attacker from the received signal. One simple approach is to separate the observations from different PMUs and then use the Prony method to analyze the observation of each PMU separately and estimate eigenvalues of each PMU. Then, it is easy to detect the attacker as the estimated eigenvalues of attacked PMU are different from those of normal PMUs. Note that this detection procedure needs to execute the Prony's method for every PMU which is very time consuming. Another possible solution is to use MMRM or VM based cluster analysis to classify the signals into different clusters. Considering the fact that in most cases the MMRM or VM among normal data is smaller than that between normal data and attacked data, the MMRM or VM based cluster analysis method puts the attacked data in the cluster that does not include normal data. Therefore, when there is only one attacked PMU, the signal in the cluster with only one element is identified as the attacked data. There are many papers (including those we have surveyed [29–31]) that discuss the cluster analysis. Due to the limited length of the paper, the detailed procedure for cluster analysis is not provided.
7. Numerical Simulations
In this section, the simulation results of proposed Prony analysis for TDMA and CDMA are provided. Then, the results of proposed MMRM and VM for attack detection for TDMA are shown.
7.1. Performance of Prony Analysis for TDMA and CDMA
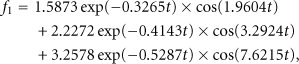
In the simulation, we assume that there are two PMUs. The signals are given by

The sampling interval
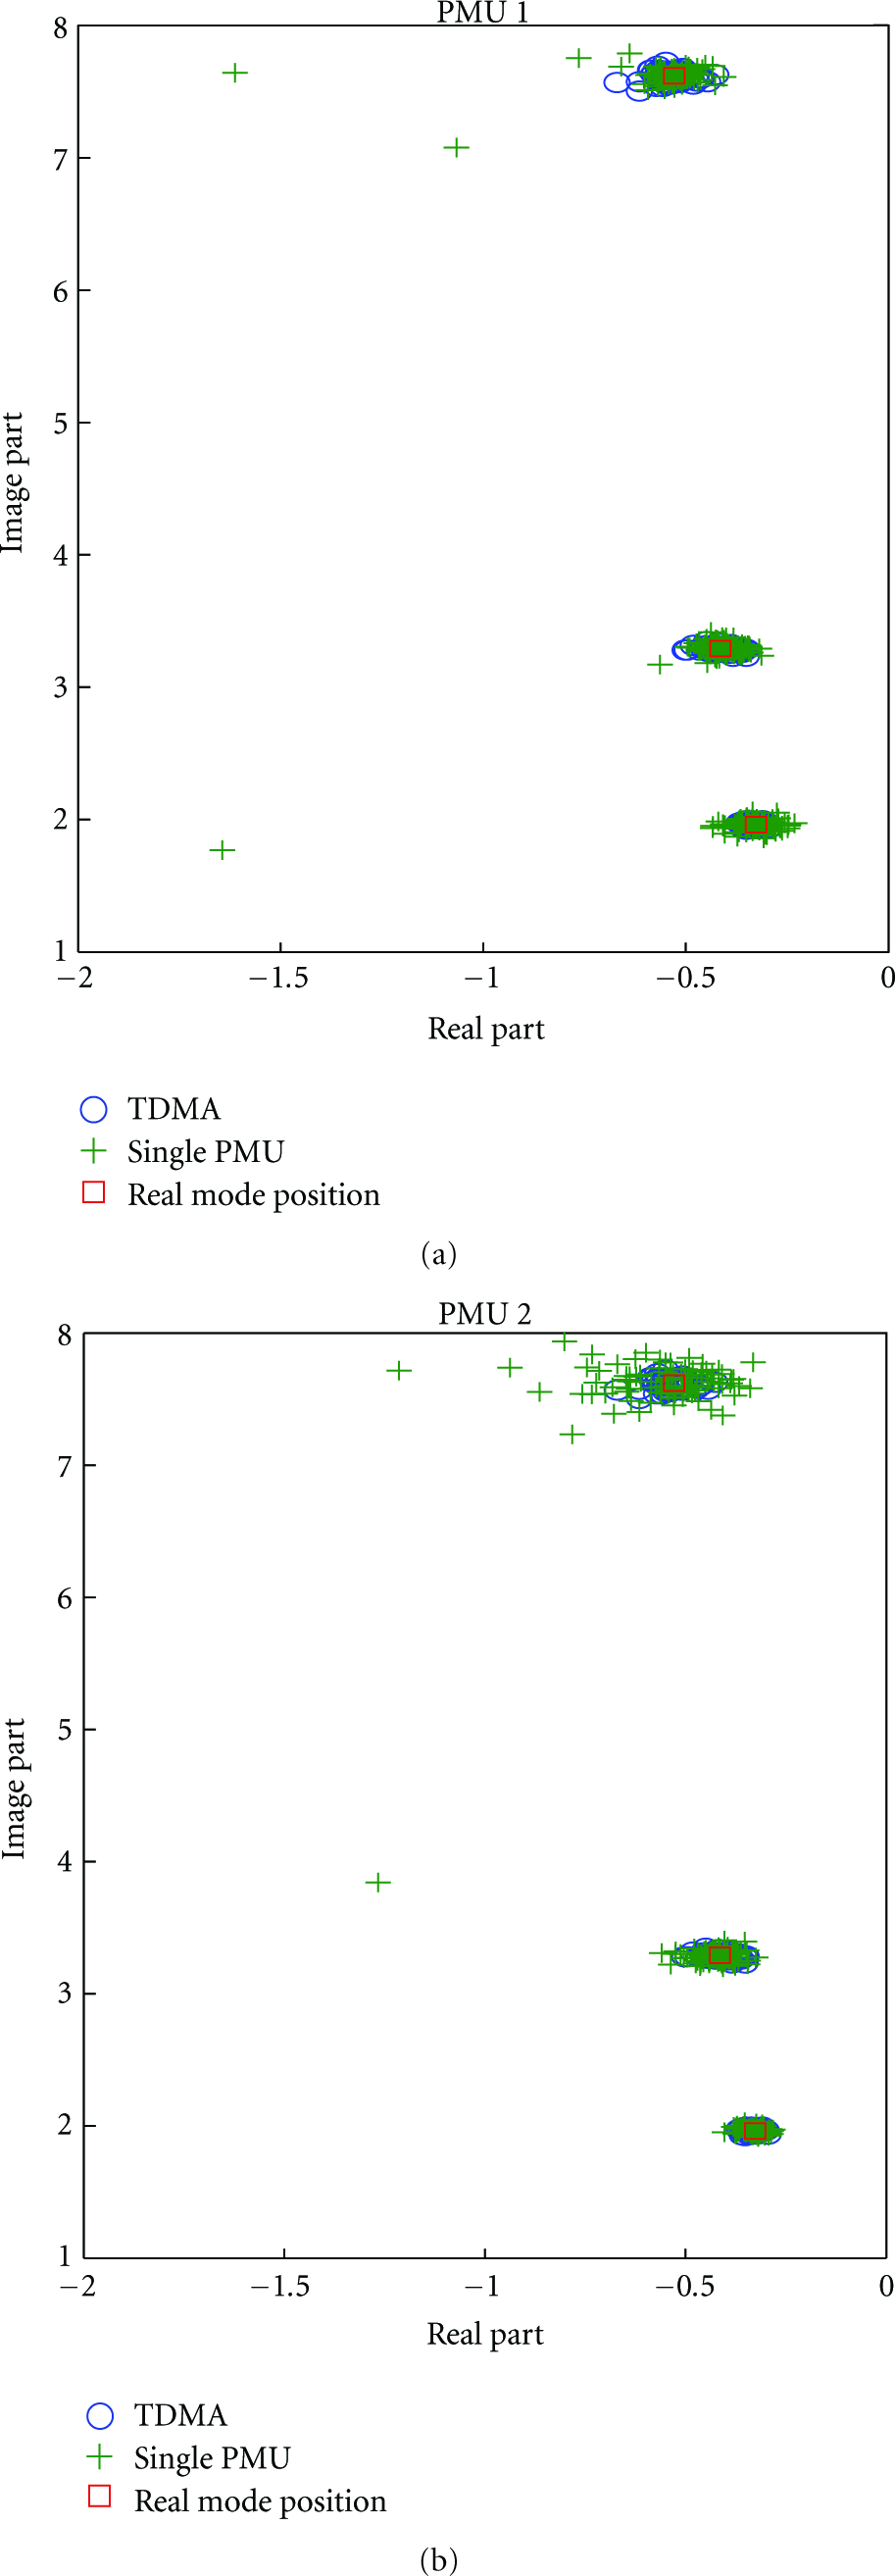
An illustration of modes distribution for TDMA with 2 PMUs, SNR = 20 dB.

An illustration of modes distribution for CDMA with 2 PMUs, SNR = 20 dB.
In order to further compare the performance of Prony analysis for TDMA, CDMA, and single PMU, the mean square error (MSE) of Prony analysis is illustrated in Figure 8. Here, MSE is defined as the average square error between the estimated modes and the real modes. As shown in the figure, the performance of both TDMA and CDMA is better than that of either PMU 1 or 2. Therefore, the Prony analysis for TDMA and CDMA has performance gain from multiple signals and has more capability to combat the noise, compared with Prony analysis for single PMU.
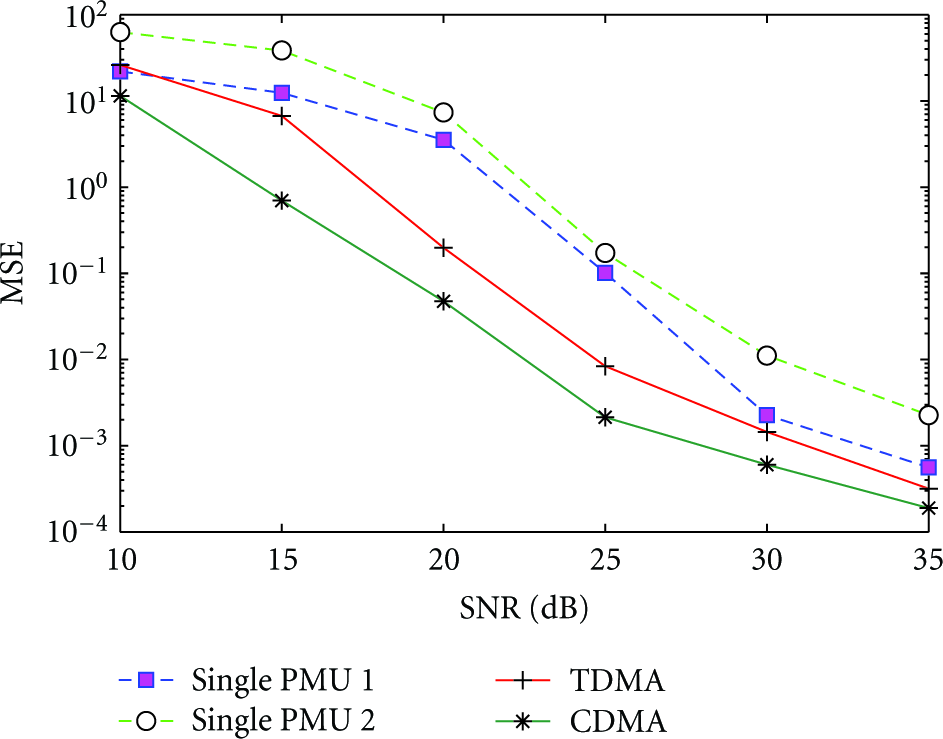
MSE comparison between TDMA, CDMA, and single PMU based Prony analysis.
7.2. Countermeasure for Attacks
As the performance of MMRM or VM of CDMA is similar with the result for TDMA, only simulation results for TDMA are provided in this part. Besides signals

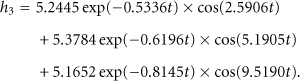
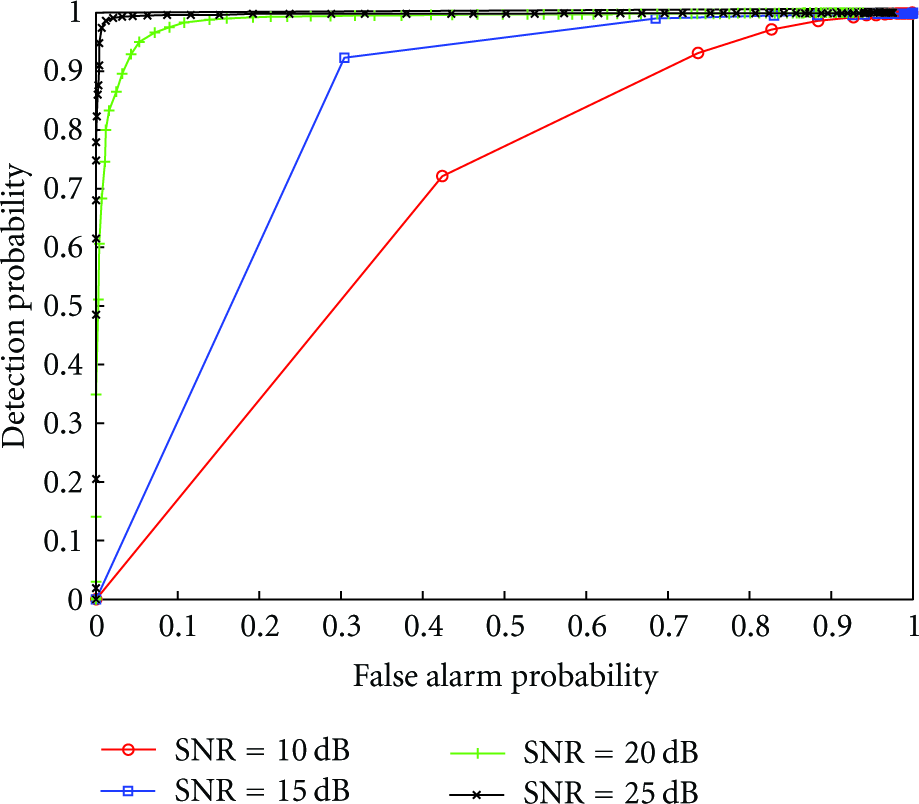
Figure 9 shows the performance of MMRM with different

Performance of attack detection with max-min ratio measure for TDMA, SNR = 20 dB.

Performance of attack detection with max-min ratio measure for TDMA,
Figure 11 shows the performance of VM with different

Performance of attack detection with variance measure for TDMA, SNR = 20 dB.
Performance of attack detection with variance measure for TDMA,
8. Conclusions
In this paper, TDMA and CDMA are proposed to transmit measurements of different PMUs to a processing center. In both schemes, the Prony algorithms using the received signal to estimate the system state, including the eigenvalues of the linear system and the amplitudes of different response modes, are proposed and analyzed. The simulation results have demonstrated that the performance of Prony analysis for TDMA and CDMA is better than that for single PMU. In addition, two countermeasures, MMRM and VM, are proposed to detect possible attacks of false reports. Numerical simulations have verified the effectiveness of MMRM and VM based attack detection.
Footnotes
Appendices
Acknowledgment
This work was supported by the National Science Foundation under grants ECCS-0901425, CNS-1116826 and UTORNL Science Alliance JDRD Award.