
Abstract
Video surveillance system, which can provide real-time display of the monitored scene and video playback, has been employed in many areas including commercial security, accident investigation, law enforcement, and emergency response. However, audio which carries important information not available in video is usually not taken seriously and used effectively. In this paper, we develop an enhanced surveillance platform by organically integrating the low-power wireless audio sensor network (WASN) with the traditional visual surveillance network. We can obtain more comprehensive and precise monitoring without the limitation of the line-of-sight and lighting condition. Moreover, this platform is designed and built for providing key support to varieties of applications in wireless multimedia sensor networks. This paper describes the platform architecture, including design, implementation, and performance. We describe the hardware and software components of the audio/video sensors. Then, we present the multimedia synchronization mechanism in the heterogeneous network which is the foundation of applications in the proposed platform. Besides, we describe a sample application and data management mechanism that we have implemented to show the usefulness of our platform. Our experiments include an in-depth analysis of the bottlenecks within the platform as well as measurements for the various components.
1. Introduction
Video surveillance system plays a very important role in modern life. There are many applications that significantly benefit from the present of video information, including environmental monitoring, health-care monitoring, personal security, law enforcement, and emergency response [1–3]. However, there exist many drawbacks only employing the video signal in the traditional surveillance system. For example, in the smart monitoring application, the special event is detected through analyzing the sequence of video frames. The detecting algorithm is complex and the analyzing result is often affected by the lighting condition and obstacle. In the accident investigation, the police is often confused by the incomplete video recording. Because the suspect may move into the blind area of the camera. Audio which carries important information not available in video is usually ignored. Compared to video, audio has the advantages of (i) not being affected by lighting condition, (ii) not being limited by the line-of-sight limitation, (iii) having reduced computation due to the much lower sampling rates, and (iv) being captured secretly. Thus, introducing the audio information will greatly improve the efficiency and flexibility of the surveillance system.
Currently, some advanced cameras can capture the audio signal by integrating the microphone interface. The audio and video streams are encoded together and delivered over 802.11 networks. However, the deployment strategy and coverage area between these two kinds of sensor are significantly different. The camera is often deployed sparsely for the infrastructure requirement and environment limitation. The visual range of the camera can reach 40–100 m, but, the sampling radius of the microphone is usually only 10 meters. There will exist many white spaces without the audio surveillance in the monitor area. As shown in Figure 1(a), when the target falls into the coverage of the camera, but outside of the microphone sensing range, we can hardly hear anything from the target. So, this solution does not make full use of the audio information.

Two surveillance modes. (a) Monitoring the corridor with the advanced camera. (b) Monitoring with the plain camera and wireless audio sensor network.
Our alternative approach is made possible by the emergence of Wireless Audio Sensor Network (WASN). Unlike the current solutions, in our platform, the audio/video sensors are deployed in a distributed way and audio sensors can be scattered densely for providing much better coverage (Figure 1(b)). WASN works in an energy-efficient and self-organizing manner which put little requirement on the environment. By organically integrating the WASN with the traditional surveillance system, we can obtain more comprehensive and precise monitoring without the limitation of the line-of-sight and lighting condition. Hence, the proposed platform will be very helpful in many areas with security requirement such as the airport (Figure 2), frontier, and subway station. Besides, this platform is designed and built for providing a foundation for varieties of multimedia applications that employ the cross-modality. Multi-model fusion and cross-modality have been researched in many applications (event recognition, object tracking [4]) for increasing in accuracy and reliability. But, they usually assume that the audio and visual streams have been obtained and synchronized. Our platform provides the key middleware services, network, and data supporting for these researches.

One scenario of employing the proposed enhanced surveillance platform: in the airport which requires high security, we want not only to watch what the suspected targets are doing, but also to listen what they are saying.
In this paper, we will present the design, implementation, and performance of the platform. We describe the hardware and software components of the audio/video sensors. The sensor software consists of the component-based infrastructure that can be configured flexibly. We also describe the multimedia synchronization mechanism that can provide a foundation for the audio fusion and sensor collaboration. Finally, we describe a surveillance application that we have developed. In this application, we have designed an efficient data management mechanism to allow the synchronized Audio/Visual (A/V) streams to be queried flexibly.
The rest of this paper is organized as follows. Section 2 highlights the related works. In Section 3, we provide an overview of the platform and describe the requirements of a typical surveillance application. We describe the hardware components of the audio and video sensors in Section 4. In Section 5, we elaborate on how the individual software components of the platform contribute to comprehensive and energy-efficient surveillance. In Section 6, we describe a scalable monitoring application that has been designed to show some of the features of the proposed platform. We report our experimental results in Section 7 and summarize the lessons learned from our experience in Section 8. The paper concludes with Section 9.
2. Related Works
There are a number of related technologies to the proposed platform detailed in this paper.
2.1. Video Surveillance System
Commercial video surveillance platform has been used in many areas, for example, the elder care monitoring, the cashier surveillance, restaurant security surveillance, and warehouse video surveillance. Companies like EZWatch and VIGILANCE&SECURITY have developed wireless hidden cameras, night vision cameras, and high-resolution cameras for different scenes. Based on the surveillance platform, many researches [1–3] have been done on the smart monitoring through analyzing the captured video stream. However, these algorithms are often complex and easily affected by the lighting condition and obstacle. Audio which carries important information not available in video is seldom considered.
2.2. Multimodal Fusion and Sensor Collaboration
A greater understanding of the human perception has led researchers to use cross-modality in numerous projects for increase in accuracy and reliability [5]. Authors of [6] proposed an algorithm to track humans in an indoor environment based on the vision and microphone array and discuss the general problem of the information fusion in multi-modal systems. In [7], authors treated the microphone arrays as generalized cameras and employed computer-vision inspired algorithms to treat the combined system of arrays and cameras. Reference [4] presented a new method to integrate audio and visual information for event recognition. Visual information was analyzed by a standard visual background/foreground (BG/FG) modeling module, coupled with an audio BG/FG modeling scheme. Authors of [8] presented a software framework for embedded online data fusion, called I-SENSE and discussed the decision modeling approach to identify the vehicle. These works mainly focused on the fusion mechanism based on the audio and visual signal processing and often assumed that the audio and visual streams have been reported and synchronized. In this paper, we discuss the sensor hardware designing and the key supporting technologies. We expect that the work presented in the literatures can be implemented on our platform.
Many researches related to the sensor collaboration have been proposed. In [9], authors proposed a cost-effective solution to synchronized audio-visual capture by employing the trigger input and output interface of the camera. But the number of synchronized sensor is usually limited by the maximal output current of one camera. In [10–12], authors employed a multi-modal detection and tracking algorithm. They localized the audio source by estimating the time difference of arrival and improved trajectory estimation in networks of nonoverlapping cameras using audio measurements. The sensor used is composed of a camera mounted between two microphones. However, the coverage area and the price of the microphone and camera are greatly different. The audio sensor may need to be deployed more densely than the camera. Integrating these two types of sensors together is not a reasonable choice. In this paper, we explicitly consider this problem and introduce the low-power WASNs to the surveillance system. The audio sensor can be deployed randomly.
2.3. Power Management
Power management is a key problem for long-lived sensors. Many techniques have focused on overall system power management. Examples of the work include the automated sensor-specific power management system [13], Qos-driven dynamic power management framework [14], and context- and power-aware-based task manager [15]. We have done some work on the power management of the audio sensor. Considering the video node is often power supplied, we have not implemented power control routines within the video platform. We expect that the work proposed in these papers can be employed to control the frame rate of the captured video and when the network shall be turned on and off to save energy.
2.4. Audio/Visual Synchronization
There have been a large number of efforts focused on A/V synchronization in the traditional TCP/IP and 802.11 networks. The related applications mainly include audio/video conference and online video-on-demand (VOD). In [16], authors proposed an adaptive delay and synchronization control scheme for audio/video conferencing applications over campus-wide WLANs. By employing a distributed timing mechanism, the scheme monitored the synchronization errors and estimated the delay jitters in real time. Authors of [17] presented a synchronization scheme in emerging wireless environments which requires no feedback and at the same time minimizes the required buffer space. In [18], considering that jitter degrades the timing relationship among packets, authors investigate an active buffer management scheme for gateway-based congestion control in packet-switched networks. Authors of [19] proposed a multilayered audiovisual streaming scheme to deliver layered audiovisual data synchronously, which is called ML-AVSS. Authors of [20] proposed an automated synchronization approach based on detecting and matching audio and video features extracted from the recorded content. These work has focused on the multimedia stream synchronization within the traditional and homogeneous networks. But, for the heterogeneous Wireless Multimedia sensor Network (WMSN), audio and video sensors are deployed in distributed way; the processor capacity and network environment of the two kinds of sensors are also different. Thus, the synchronization problem differs significantly. In this paper, we propose a new synchronization algorithm based on the analysis of the audio/video features in WMSN.
3. Platform Overview
The platform consists of two kinds of network: WASN and visual surveillance network. As shown in Figure 3, video sensor as the terminal of the visual surveillance network connects with the server through WLAN/LAN. At the same time, the video sensor also acts as the sink node in the WASN to aggregate the audio streams. Audio sensors are scattered randomly and connect with each other in the self-organizing way. Once some events are detected, the audio sensor will report streams to the sink node through multihops. In the platform, the visual surveillance network works as the backbone to undertake the transmission of all the streams to the server and the WASN is like the outspread nerve endings which can capture even tiny exception. By combining the advantage of these two kinds of network, we developed a robust and efficient surveillance platform.

Network structure of the enhanced surveillance platform.
Our platform is motivated by the requirements of more precise and comprehensive surveillance application. During the platform designing, we had a number of design goals that we were trying to accomplish including the following.
(i) Low Power
Wherever the surveillance system is deployed, minimizing the amount of power required is important. For environments where power is scarce, the power may be generated dynamically via solar panels or wind-powered generators. Minimizing energy usage can significantly increase the time that sensors operate and improve the stability of the system. For environments where power is plentiful, video sensors can be power supplied. But, for the densely deployed audio sensors, it is unrealistic to provide so many power interfaces. Minimizing energy cost of the audio sensor can greatly increase the system usability. The administrator may be willing to charge the batteries every month. However, they will be exhausted by replacing the battery every week.
(ii) Power Management
Low-power sensor is just one component of the surveillance platform. The platform also needs to be able to match the number of sensor that is working to the amount of power that is available. A flexible power management is expected. For example, in some scenarios, the application may require that all the sensors capture as much as it can regardless of the energy cost. While in another scenarios, we balance the SNR of the captured signal and the rest energy in each sensor to keep all the sensors alive.
(iii) Configurable Multimedia Stream Synchronization
We expect that the proposed platform is also built for providing scalable and flexible supporting for different applications. This will require a configurable multimedia stream synchronization. For example, in the scenario of law enforcement, people will be not aware of the out-of-step, even when the audio and video skew is as large as 80 ms. But, in the application of target tracking and localization, the performance of the system is directly related to the synchronization accuracy. We shall try our best to synchronize the stream precisely.
(iv) Effective Data Management
For the proposed platform, data management is an important component which will affect the system performance greatly. For example, in the target tracking application, once event occurs, several audio and visual streams will be reported simultaneously and video sensors cooperate with different audio sensors. When the target moves, different audio sensors work alternately and the cooperative relationship among sensors varies with time. Effective and scalable data management is desirable for the precise object locating and tracking.
In the following section, we will present the hardware of the audio and video sensors which serves as the basis of the platform. Following that, we will describe the software components to help address some of the application requirements above.
4. Hardware Platform
4.1. Video Sensor
There are a lot of options available to us on designing the video sensor. The StrongARM-based Compaq IPAQ PDA is the most prevalent platform. It has been used in many research projects, including some at MIT and ISI. But, this platform performs not very well in multimedia processing. Because the Intel-based embedded processors such as the StrongARM processors and the Xscale processors do not support floating point operations. In the video compression algorithms, they need to convert the floating point operation to integer equivalents. Besides, many embedded processors only support USB1.0. The bandwidth of the USB interface limits the frame rate of the uncompressed video stream from the camera to the processor. So, in the traditional video sensors, video stream is often compressed in the camera and transferred through the USB interface to the processor. Then, the video stream is decompressed and some motion and event detection algorithms are performed. Before reported to the server, the video stream needs to be compressed again. A number of latency and energy cost are introduced in the process.
In this platform, our video sensor employs the Samsung S3C6410 800-MHz embedded processor (Figure 4(a)). It has ZC301 USB-based video camera, 256 Mbytes of memory, and the Linux-2.6.28 operating system kernel. The video sensor consists of two RF interfaces: ZigBee and WIFI. The ZigBee module connects with the video sensor through a serial port with the band rate of 115200 bps. We have implemented the filtering and compression mechanism in the audio sensor and data fusion procedure in the cluster head. Hence, the transmission rate of the serial port is enough for audio streams aggregation in many applications. In addition, we receive the uncompressed video stream from the camera and perform the video compression algorithm in the processor. The sensor supports USB2.0 interface; the bandwidth can reach 480Mbps. It means that the sensor can support uncompressed transmission of 320 × 240 pixel video at full-frame rate. The processor also supports hardware codec of H263, H264, MPEG4, and VC-1. Based on the multiple format codec interface, we can configure the compression mechanism adaptively. This designing improves the flexibility of the sensor and greatly reduces the latency on the sensor side without increasing the energy cost obviously.
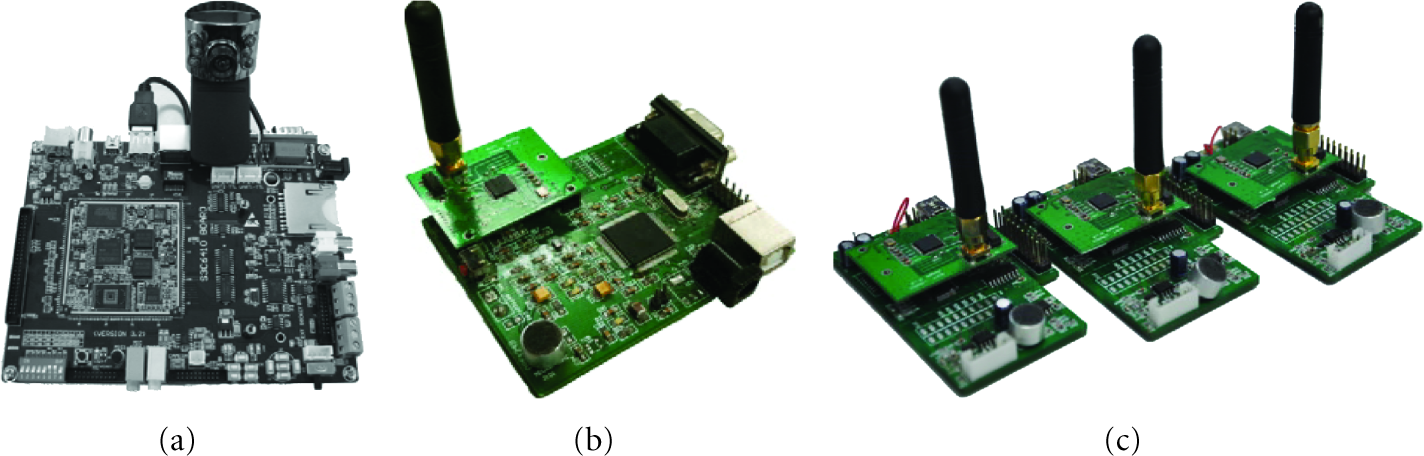
Hardware of the surveillance platform. (a) Video sensor. (b) Audio sensor with AT91SAM7X256 chip. The board is approximately 3.2 inches long and 2.4 inches wide. (c) Audio sensor with STM32F103C8 chip is about 2.7 inches by 1.5 inches in size.
4.2. Audio Sensor
Energy consumption is the main concern in designing the audio sensor. We often try to save the energy from two aspects, RF module, and processing module. For the scalar sensor, we know that the energy spending on the radio is much more than that on the processing. However, for the audio sensor, our initial investigation uncovers that the conclusion is not always true. We find that, in a typical office building monitoring scene, the energy cost of the processing module accounts for more than 95% of the total energy in the audio sensor. This is because when the audio sensor does not detect any event, the RF module will be in the idle state. The radio is turned off and goes to sleep. But the processing module still keeps working. It samples all the time and performs the event detection algorithm. The radio is waked up only when some exceptions are detected.
S3C2440 chip from Samsung is employed in many audio processing areas, including the mobile communication, Voip, and so on. Although it can support many complex audio encoding algorithms, the energy cost in the processing is very high. Under the normal model, the current consumption of the S3C2440 chip can reach to 200 mA. It is nearly 8 times more than that of the CC2430 RF chip in the TX mode (24.7 mA). MSP430 from TI with the maximum frequency of 25 MHz is a little weak in the proposed platform. It can only handle the simple event detection algorithm and thus lack of scalability. Our first design (Figure 4(b)) utilizes a AT91SAM7X256 50-MHz processor chip with 32-bit RISC architecture. The single-cycle access to the SRAM at maximum speed can reach 64 Kbytes. Relative complex algorithms can be implemented on the board. While this design can satisfy the requirement of a general WASN testbed, suboptimal power consumption of the processing unit severely constrains the usability of the audio sensor in the real system. The current consumption of a completely running sensor with 3.3 V reaches 94 mA. In addition, the size of the board is another handicap in the sensor deployment.
To overcome these limitations, the second generation of the audio sensor has been developed. We select the STM32F103C8 embedded chip which can support the audio signal processing effectively with low energy cost. When it runs completely from RAM with 48 MHz, the current consumption is only 22 mA. The audio sensor consists of a microphone, 60 KB of SRAM, and CC2430-based radio transceiver. The dynamic power consumption is less than 55 mA when processing module and RF module run at full speed. By implementing the G.726 encoding algorithm on the sensor, 64 Kbps of sampling data rate can be reduced to 16 Kbps. Although more complex encoding algorithm can be implemented on the Mini2440 board with S3C2440 processor, our experiments show that the whole performance of the proposed audio sensor outperforms that of the Mini2440 board in different monitoring scenes.
5. Software Architecture
Flexibility and scalability are the main goals in the software designing of the enhanced surveillance platform. We build the software architecture with the modular and hierarchical design. As shown in Figure 5, the platform consists of data preprocessing in the sensor side, control protocol during the transmission, and stream management in the server. We will summarize several key components in the rest of this section.

The software components of the surveillance platform.
5.1. Data Acquisition
The data acquisition including sampling, filtering, and encoding is a basic component of the surveillance platform. It greatly affects the processor and network payload and thus the whole platform energy consumption. In the sensor side, we initially capture the audio or video signal with a low sample rate and perform the event detection algorithm in the filtering component. If some events are detected, a higher sample rate will be triggered, then, the data stream shall be compressed and transferred. Otherwise, the sampled data will stop at the filtering stage without any further processing. Having the uninteresting data filtered without encoding and transmitting allows the platform to be more flexible than if it just transmitted all data upstream. Besides, there is another component which can be configured optionally during the data acquisition. This component is employed to extract the useful information from the raw data streams. We can only transmit the extracted results to save the communication overhead. For example, in the decision fusion scheme, each sensor makes a local decision based on its measurements. Then, the cluster head can make a system decision according to the reported data.
5.2. Router Scheduling with Multicoverage Consideration
Routing algorithms in wireless sensor networks usually focus on minimizing the communication overhead and time delay. They often assume that the network is synchronized, sensors sleep and wake up simultaneously, and all nodes keep active during the data reporting. However, in our platform, audio sensors often work in the event-driven mechanism and turn on the radio interface only when some events are detected. To support the random data reporting, some sensors need to keep awake and work as the router. But, always-on routers will be down quickly. In this section, we propose a router scheduling scheme with the multicoverage consideration to extend the network lifetime.
In a local WASN (The platform consists of many local WASNs (Figure 3) where one video sensor acts as the sink node and receives streams from the audio sensors.) of the platform, we firstly synchronize the audio sensors roughly. All the sensors wake up periodically and report the neighboring tables to the sink node. We can get a hierarchical graph (Figure 6(b)) in the sink node according to the aggregated neighboring information. By analyzing the graph, we can find several sensor lists in each layer which can cover all the audio sensors of the next layer. For example, the sensor lists in the third layer include

The router selection mechanism in the proposed platform. (a) Sensors report the neighboring tables to the sink node. (b) A hierarchical graph is constructed in the sink node. (c) The hierarchical graph can be updated when some nodes fail.
Specially, if one node is singly covered by only one parent, we define this parent node as the crucial router, for example, the nodes G and node K in Figure 6(b). The crucial router has to keep awake all the time for relaying the data reported from the child nodes. It is usually considered as the weak energy point of the network. We can deploy more sensors near the crucial router. The forwarding task can be shared with several routers by performing the router scheduling. Obviously, the proposed router scheduling scheme will work better in a dense network.
There may be a temporary transmission fault in the case of node failures. But it can recover from the failure once the hierarchical graph is updated. For example, in Figure 6(c), after the crucial router K fails, the hierarchical graph will be updated with the neighboring table reporting. The child node O can continue to report the data through the node J and P. The neighboring table updating may lead to some communication overhead. But, our performance measurements of the router scheduling shows that no more than 0.1% transmission overhead is introduced. We believe that the additional flexibility and prolonged network lifetime gained by such a mechanism is worth the overhead.
5.3. Multimedia Stream Synchronization
Multimedia stream synchronization is important for a number of reasons. First, in the law enforcement, we need to match the reported audio and video streams for a better understanding of the recorded accident. Second, for the event recognition or target tracking [9, 10], the cross-modality is usually employed to improve the precise of the recognition and location. Finally, to reduce the redundant audio streams transmission [21] and save the energy consumption, audio fusion shall be performed during the data reporting.
5.3.1. Audio Synchronization
Extensive researches have focused on the audio synchronization in the target location and tracking applications [11, 12]. TDOA-based scheme is usually employed to synchronize the streams from the microphone array under the assumption that the router is stronger and power supplied. However, these conditions can not be satisfied in many cases. The router is often plain and battery-powered, especially in the wild environment. On the other hand, although the timestamp-based synchronization scheme has been used in many traditional multimedia applications, it ignores the audio signal propagation delay and the synchronization precision is usually not enough for the cross-modality applications.
Based on the audio endpoint, we propose a distributed audio synchronization scheme which can share the synchronization task with all the reporting sensors, save the energy of the router, and hence prolong the whole network lifetime. The endpoint is an audio feature usually employed in the application of speech recognition to decide the word boundary. As shown in Figure 7, at the reporting sensor, through analyzing audio signal in the time domain, we detect the endpoint of the audio stream dynamically and incorporate our designed symbol sequence to mark the synchronization point. Then, we search, align, and adjust the symbol to synchronize the reported audio streams accordingly in the router or cluster head. Since the start point of the audio synchronization is marked before the transmission and the symbol sequence is robust to partial losses due to the burst of data and low bandwidth, we can synchronize the audio streams with minimum effect of the communication interference. The initial investigation of the scheme is described detailedly in [22].

The structure of the audio synchronization mechanism.
Background noise may lead to a little error in the endpoint detection. To reduce the interference, based on the signal amplitude, we introduce a fingerprint matching scheme which consider the macrofeature of the sound. Specifically, we divide amplitude in X equal intervals (
5.3.2. Audio/Visual Synchronization
Many A/V synchronization algorithms [16–18] for traditional wireless network mainly focus on the synchronization control in the server. These algorithms can be implemented in our platform. But, one important difference is that in the traditional schemes, microphone and camera are integrated into one node, audio and video sensors have a unique clock reference from the same processor, and the sampled data is transmitted through the same network. For the distributed surveillance platform with heterogeneous networks, the processor capacity, the local clock of the sensors, and the network environment are greatly different.
We introduce a clock synchronization scheme between the audio and video sensors which can effectively support the stream synchronization in the heterogeneous network. The clock synchronization in the platform consists of two phases. First, we synchronize the audio sensors with the sink node (video sensor) in the local WASNs. Then, video sensors synchronize with the gateway (server) through our backbone network, which can support the synchronization of the whole platform.
In the local WASNs, clock synchronization is triggered by the audio event detection. We integrate the synchronization message with the audio stream by inserting the Sync-Notice beacon into audio packets. The Sync-Notice beacon includes the send time recorded in the MAC layer and an age field which contains the elapsed time since the packet transmission. Each intermediate router measures the elapsed time from the reception of the message till its retransmission and updates the age field using a precise time stamping method proposed in [23]. When the audio packet arrives at the video sensor (sink node), the age field contains the sum of the offsets measured by each of the routers along the path. Hence, we can obtain the current time of the reporting audio sensor by subtracting age from the arrival time of the message in the video sensor.
Video sensors synchronize with the gateway by utilizing a NTP similar protocol. The gateway sends a Sync-Beacon to the video sensor and records the send time

Finally, in the gateway, based on the clock synchronization between the audio and video sensor, an adaptive and configurable A/V synchronization control scheme can be implemented.
5.3.3. Synchronization Control with Multilevel Buffer
Many researches have been done on the synchronization control of the distributed multimedia systems in the traditional networks. In most of the multimedia systems, such as Audio/Video (A/V) conference, Video On Demand (VOD) and distance learning, media streams are usually synchronized for fluent playback of the presentations under the assumption that the synchronization controller is powerful. A large buffer is maintained in the controller to eliminate the delay jitters and provide the smooth synchronized streams. However, in the proposed enhanced surveillance platform or WMSNs, we synchronize the captured multiple streams not only for playback, but also for supporting the various in-network processing (data fusion, target localization, etc) which requires more flexible control. The in-network processing of the multimedia content is usually performed based on the resource-constrained sensors traditional synchronization control algorithms fail to run on the low-end hardware platform with limited memory and processing capacity.
In this paper, we propose an adaptive synchronization control scheme with multi-level buffer to support the in-network processing. Initially, the in-network processing executor (control node for the specific in-network processing) acts as the synchronization controller (Figure 8(a)). In the synchronization controller, by analyzing the reported streams, we allocate several buffer pairs ((a1, a1′), (a2, a2′), …) to hold the media units from different sources. In each buffer pair, two buffers (a1, a1′) receive the reported packets alternately. For example, when the buffer a1 is full, the reported stream will be directed to the alternate buffer a1′. Diverse network links and the network traffic bursts always disturb the temporal relations of the media units (data packets of the multimedia stream). We reorder the packets and eliminate the jitter through the buffer management, then align the corresponding media units among various streams.
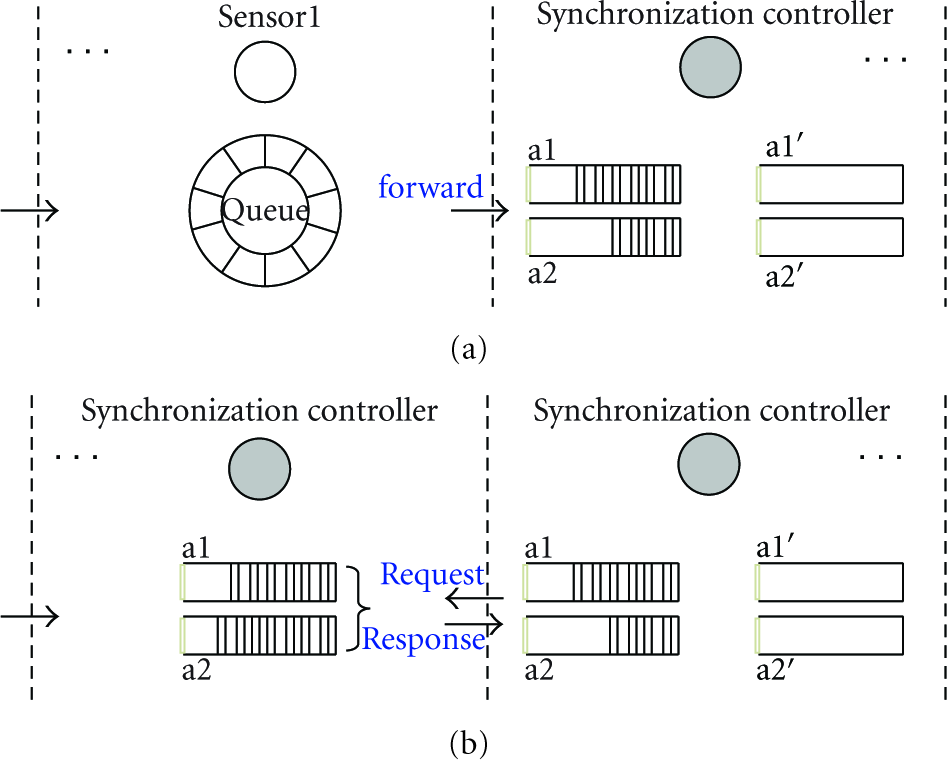
The architecture of the adaptive synchronization control with multi-level buffer in WMSNs. (a) Initially, the in-network processing executor acts as the synchronization controller. (b) When the buffer space in one node is not sufficient, we combine the sensors in the stream transmission path and construct a multi-level buffer.
When the network channel condition degrades and the traffic becomes serious, the buffer required for synchronization controlling will increases constantly. However, in WMSNs, sensors usually work with little resource. A single node with the limited memory can hardly undertake the synchronization controlling task. In this case, we combine the sensors in the stream transmission path and construct a multi-level buffer to overcome the memory constraint. The organically integrated sensors perform jointly as the synchronization controller. As shown in Figure 8(b), when the buffer required for synchronization controlling surpasses the memory constraint of the in-network processing executor, a new node is added in the integrated controller. The integrated controller consists of one master and several slave nodes. The in-network processing executor works as the master and the new added nodes perform as the slave nodes. In the master, we maintain a group of buffer pairs ((a1, a1′), (a2, a2′), …). A pair of buffer works alternately for receiving the packets and performing the synchronization. But, in the slave node, only a group of buffer (a1, a2,) is maintained for holding the media units.
5.4. Stream Control
In traditional multimedia applications, adaptive stream control schemes based on the buffer management [16, 19] are often employed to balance between the delay and delay jitter. Packets that have accumulated too much jitter will be rendered useless and discarded when received by the server. However, in this situation, these jitter-corrupted multimedia packets actually are continuing to consume the network bandwidth. For the WASN with low bandwidth and “chaotic” transport channel, the influence of the jitter-corrupted packets transmission becomes serious. The quality of service (QoS) in the enhanced surveillance platform will be affected greatly due to the network congestion and high packet loss rate.
To solve this problem, we introduce an active jitter detection mechanism which can immediately detect and discard the packets that accumulate enough jitter during the transmission over WASN. Figure 9 illustrates the operation of the proposed scheme. Once some events are detected, audio sensor opens up its radio module. As described above, Sync-Notice beacon will be inserted into each audio packet before the sensor reports the stream. During the transmission, we perform the jitter detection in each router. The current delay of the audio packet can be obtained from the age filed of the Sync-Notice beacon. We compute the different value between the current and the average delay to evaluate the jitter of the packet. By comparing the jitter value to a threshold, we can immediately detect and discard the packets that accumulate enough jitter. Thus we can maintain a high bandwidth for packets within the jitter tolerance. When the QoS requirement changes, we update the threshold of the jitter detection for all the routers.

The active jitter detection scheme.
6. Sample Application
In order to demonstrate the usefulness of the proposed platform, we have implemented a surveillance system in our laboratory building, which consists of 10 audio sensors and 3 video sensors. The components of the system are shown in Figure 10 and described in the rest of this section.
The software components in the sample application.
6.1. User interface
The user interface for the surveillance system is shown in Figure 11. In the top left of the window is a list of the video sensors that are available for the user to see. When we select a video sensor, corresponding audio sensors (audio sensors that report the streams to the specific video sensor (sink node)) can be listed. By clicking one of the audio sensors in the list, we can monitor the area real-timely with the synchronized audio and video streams. The lower-left is a list of events that the sensors have captured. We can query the historical recordings through this interface.

A simple surveillance client we developed in the little sample of the platform.
6.2. Sensor Software
In the application, audio sensors are battery powered. Each audio sensor can automatically select one of the video sensors as the sink node based on the shortest route mechanism. We implement a volume detector in the audio sensor. Once some events are detected, 16 kbps of the compressed audio stream will be reported to the sink node through the multihops ZigBee network.
Video sensors are fully powered. They connect with server through 802.11 wireless network and perform a change detection filtering algorithm. The video stream transmission can be triggered not only by the change detection, but also by the audio events. When audio streams reach the video sensor (sink node), we evaluate the capturing time of the audio events, mark the audio packets with a new timestamp, and report to the server through the 802.11 network. Then, the audio and video sensors will work with the same network environment and consistent clock.
Upon activation, the sensors read their configuration file to set up the basic parameters including sample rate, filtering scheme, compression algorithm, and address of the aggregator. While the sensors operate with the predefined parameters, we can change them manually during the runtime. Besides, one can easily imagine incorporating other techniques for managing the sensors automatically.
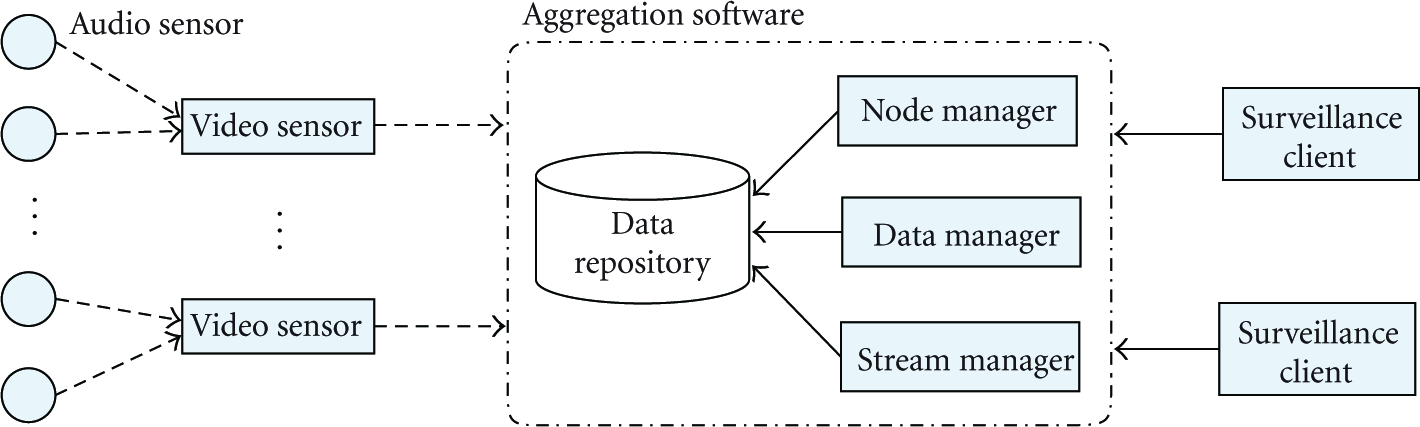
6.3. Aggregation Software
The aggregation node is not only responsible for the receive and storage of the multimedia data from the sensors, but also for the streams retrieval from the surveillance clients. There are a number of components within the aggregation node. The three principle parts are the node manager, stream manager, and data manager.
The node manager is responsible for dealing with all the audio and video sensors. Upon activation, sensors register themselves with the node manager. The registering information includes the name, address, sampling rate, and filtering scheme of the sensors. Through the node management interface, we can configure these parameters dynamically. In addition, a simple network management (node state, network topology, packet loss rate, etc) is also included in this module.
The data manager is responsible for organizing and associating the multimedia data and handling the data requests from the surveillance clients. In most of multimedia applications, the reported audio and video streams are stored in the data file. A lot of fragments will be produced when sensors work with the event-driven mechanism. Effectively organizing these fragments is significant for the service provision. We perform the data management by utilizing the data structures, node mapping table, and event management list. First, we build the association among the audio and video sensors in the node mapping table. When we select one video sensor, corresponding audio sensors can be listed (Figure 11). In this sample application, audio sensors are only related to their sink nodes. Other association strategies can also be implemented. For example, for the position-based strategy, several cameras may cover the same subset of audio sensors (Figure 12(a)). So, there will exist many-to-many relationship among the deployed sensors. In addition, we also construct a single linked list (event management list) for each sensor to organize the reported events. Each node of the list includes four fields: startTime, length, handler, and next (Figure 12(b)). startTime field indicates the event occurrence time. Duration of the event is stored in length, handler and next point to the data file of the event and the next node in the list, respectively. All the events can be listed by traversing the event management list. Based on the two data structures, the data manager can quickly respond to the query from surveillance clients.

The data structures in the management of the reported streams. (a) Node mapping table. (b) Event management list.
For the stream manager, there are two major functions. On one hand, it is responsible for dynamically balancing between synchronization requirements and latency requirements in real-time monitoring scenes. On the other hand, it is responsible for streaming events of interest to the surveillance clients. We have implemented the node, data, and stream managers as separate components in order to maximize the scalability of the system. It is easy to have them on geographically separated host.
7. Performance Evaluation
In this section, we will describe the experimental results that we obtain from the various components in the platform.
7.1. Power Measurements of Audio Sensors
First, we focus on the energy consumption of the proposed audio sensor. We evaluate it from the processing and radio modules. Then, we compare the energy cost with another two kinds of audio sensors, the first generation board with AT91SAM7X256 processor and Mini2440 board with S3C2440 processor. In the experiment, we deploy these sensors in the same environment. The software deployed on the sensor board is also the same except the compression algorithm. Mini2440 board employs G.723 scheme; another two boards use G.726 scheme. The experiment time is 60 minutes. During the experiment, once the sensors detect any event, they report audio streams to their respective sink nodes. We have measured the current consumption of these processing boards running completely without RF unit by an ammeter. The AT91SAM7X256 board, the new designed STM32F103C8 board, and Mini2440 board are 65.1 mA, 26 mA, and 221 mA, respectively. When the radio is opened and transmitting data, the measured current is fairly variable over time. So, we evaluate the radio consumption according to the energy model described in the cc2430 datasheet (TX: 24.7 mA, RX: 27 mA, Idle: 0.6 uA). The average throughput of the radio can be measured and the reported data size in the sink node is known; thus, the energy cost of the radio module can be computed.
From Table 1, we find that the new designed STM32F103C8 board can save energy greatly. The energy costs of the STM32F103C8 board in the processing and radio modules are about 308.88 j and 10.76 j, respectively. Comparing with another two boards, the processing cost is very little. This is because, we employed a low-power processor and optimized the circuit design of the board in the new sensor. For the communication cost, the simple compression algorithm of the new sensor may introduce a little more overhead. However, by analyzing the ratio of the communication overhead to the processing cost in the experiment, we find that, the processing cost accounts for main part of the energy consumption in the audio sensor and the communication overhead holds a very small proportion. Hence, we expect that the proposed STM32F103C8 board can prolong the network lifetime of our platform effectively.
Energy consumption of audio sensors.

Next, we also employ the voltage drop of the batteries as an indirect way to measure the energy dissipation. We extend the experiment time in the office building scene and measure the voltage for each sensor every half hour. From Figure 13, we can see that the Mini2440 board with fully charged lithium battery works no more than 13 hours, the battery is drained quickly. Our new designed audio sensor can maintain about 110 hours. In practice, we often set a duty cycle for the sensor processing unit according to the specific application. The audio sensor switches to completely running only when some events are detected. In the experiment, we set the duty cycle to 50%. The audio sensor sleeps for one second, then wake up and works for one second. We find that the lifetime can be extended to 213 hours.
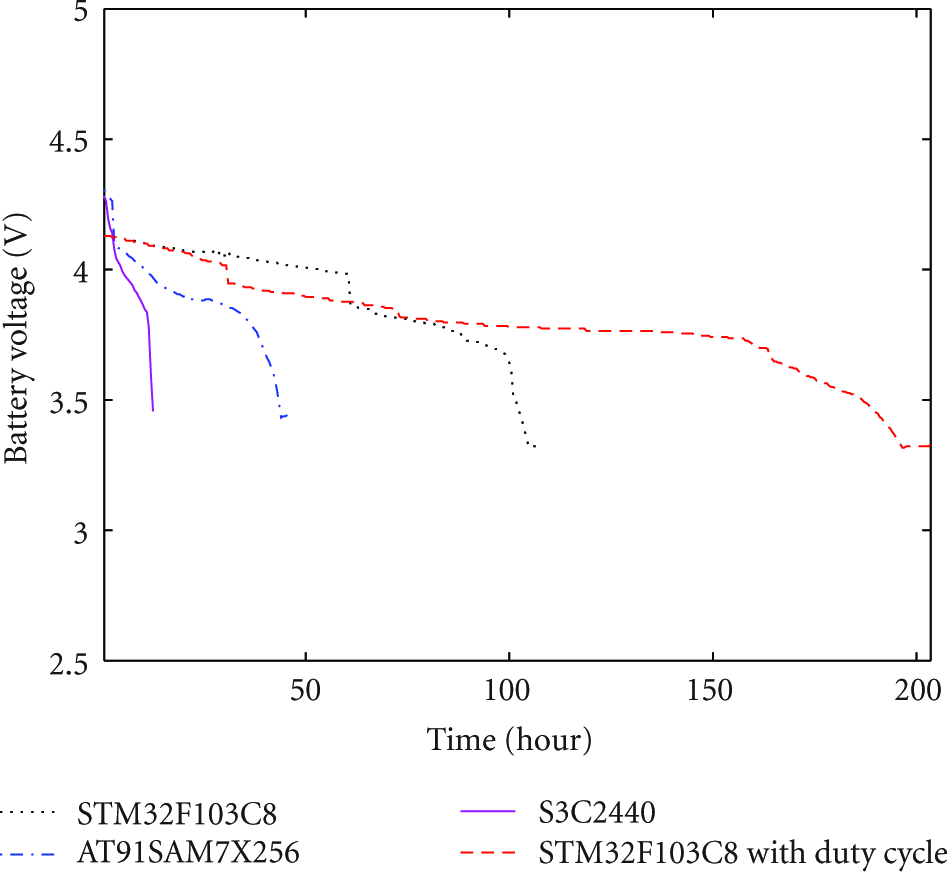
Energy dissipation of the three kinds of audio sensor.
7.2. Evaluation of Router Scheduling
Then, we evaluate the router scheduling mechanism in the platform. We deploy two networks in the experiment and employ a simple network structure to clearly represent the experiment results. Six audio sensors report streams to the sink node through two routers. Each router can cover all these six sensors. In one of the networks, we deploy the router scheduling mechanism. Each router (R1, R2) only keeps active during its allocated time slot, then returns to a normal audio sensor. In another network, two routers (R3, R4) keep always on. In the experiment, we set the duty cycle of the processing board to 50%. The cycles of clock synchronization and neighboring table updating are 10 minutes.
We compare the energy dissipation of the routers in two networks. From Figure 14, we can see that routers R3 and R4 work for about 110 hours during the lifetime. In another network, by performing the proposed router scheduling scheme, routers turn off the radio alternately and the network lifetime can be extended to 150 hours. The reported data size is nearly equal in the two networks. The energy cost difference mainly comes from the different duration of the active state in the RF module. When the radio is active, even there is no data transmitting, about 13.4 mA shall be consumed by the RF module. But when the radio is in the idle state, the RF module only consumes about 0.6 uA.

Energy dissipation of routers.
Next, we evaluate the additional communication overhead introduced in the router scheduling mechanism. During the network lifetime, we compute the reported data size for different kinds of packet in the sink node. The size of audio data including the sequence number and timestamp is about 146075 KB. The data size of neighboring table updating is about 88.25 KB. The clock synchronization and rerouting messages are no more than 25 KB. The ratio of the additionally introduced overhead to the audio data is 0.0775% approximately. We believe that the extended network lifetime is worth the overhead.
We also investigate the effect of neighboring table updating on audio stream transmission. In the experiment, sensors report the data packets continuously. The data reporting rate is set to 2 KBps. First, we measure the average packet loss rate (PLR1) when different number of sensors are deployed. Then, we set the deployed sensors to update neighboring table periodically. The updating cycle is 2 s. We record the packet loss rate again (PLR2). From Table 2, we can see that the neighboring table updating has little influence on the continuous data transmission. It is worth noticing that, in the real applications, audio sensor usually works with event-driven mechanism. Sensors report audio streams only when some events are detected. Besides, the neighboring table updating frequency is often set to a low value. Hence, we can consider that the proposed router scheduling mechanism will perform well in the proposed platform.
Effect of neighboring table updating to the packet loss rate.

7.3. Evaluation of Audio Synchronization
In this section, we evaluate the performance of the proposed audio synchronization algorithm and compare with the traditional TDOA-based scheme. We divide the amplitude into 100 intervals in the fingerprint matching scheme. To represent clearly, in this experiment, we set audio sensors report data to the sink node directly with a single hop.
First, we evaluate the audio synchronization schemes in the speech laboratory. We compare the synchronization accuracy and the necessary processor capacity between the two synchronization schemes. From Figure 15, we can see that the synchronization error introduced in the proposed endpoint-based scheme is relatively stable and unrelated to the type of audio sources. It is about 2–4 ms. This error is mainly caused by the different sensitivity of microphones. But, for the TDOA-based algorithm, it performs badly when the car engine is set as audio source (Figure 15(b)). On one hand, the induced error is related to the different sensors sensitivity. On the other hand, the TDOA-based scheme works based on the correlation of the continuous audio signal. The intermittent signal feature of the car engine also contributes to the poor synchronization. As to the complexity evaluation, we find that the TDOA-based scheme nearly requires 20% of the processor capacity in the sink node. This algorithm involves complex processing, including the FFT of the whole reported audio stream, cross-correlation processing, delay evaluation, and alignment. But for the endpoint-based scheme, we only need align the symbol sequence and perform an adjustment based on the local audio streams. The necessary processor capacity is less than 3%.
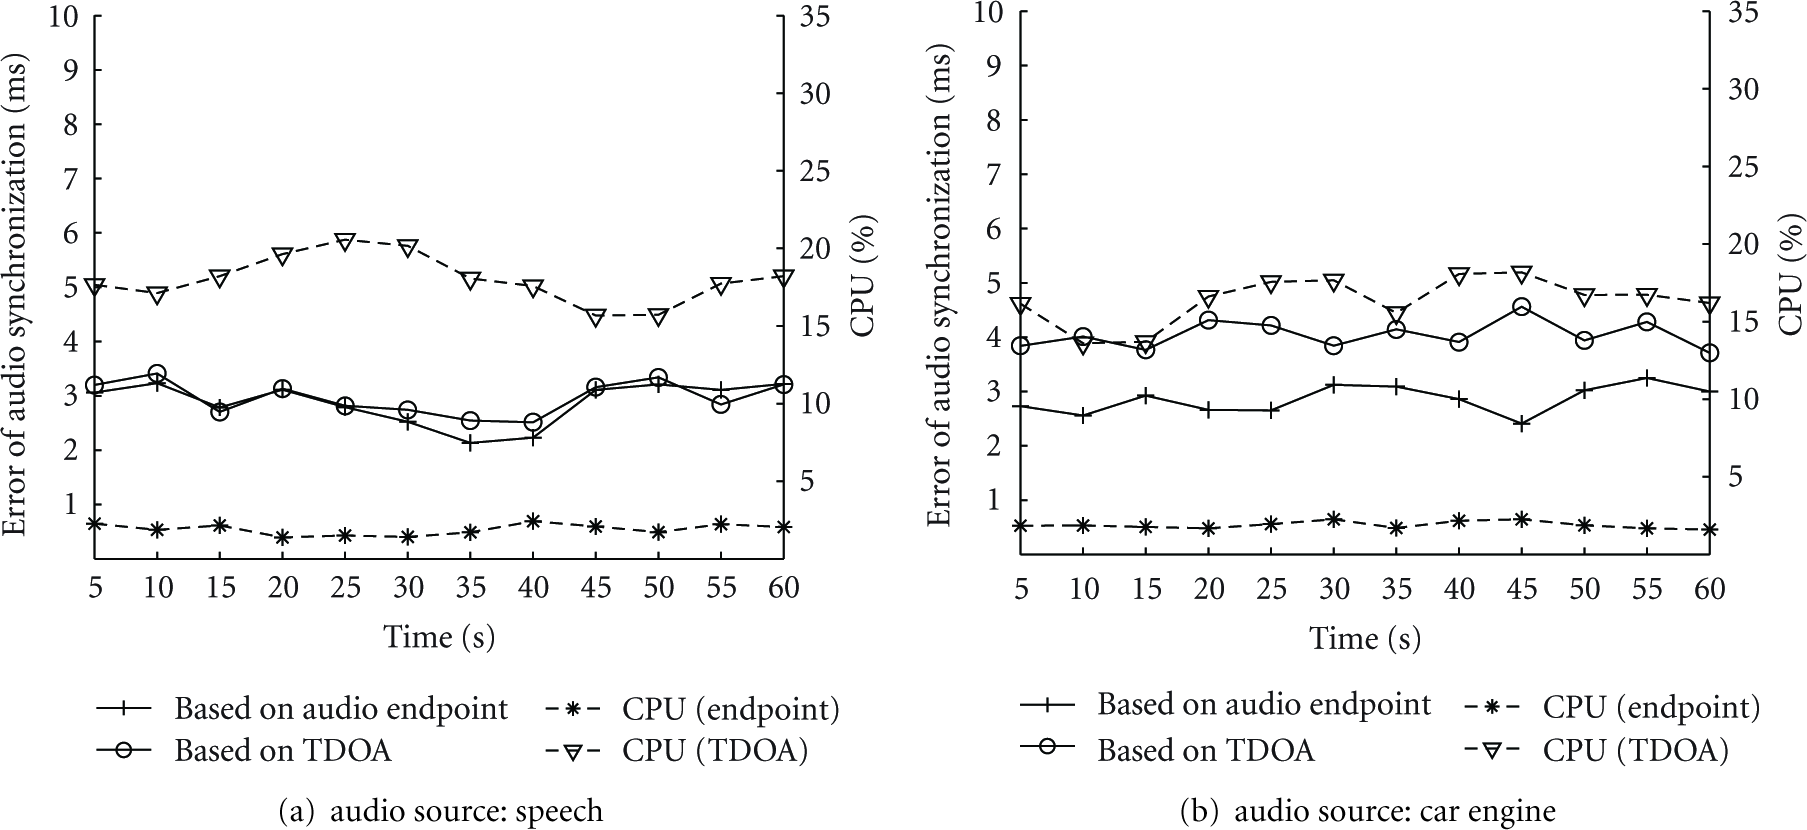
The performance of the audio synchronization in the speech laboratory when different audio sources are deployed.
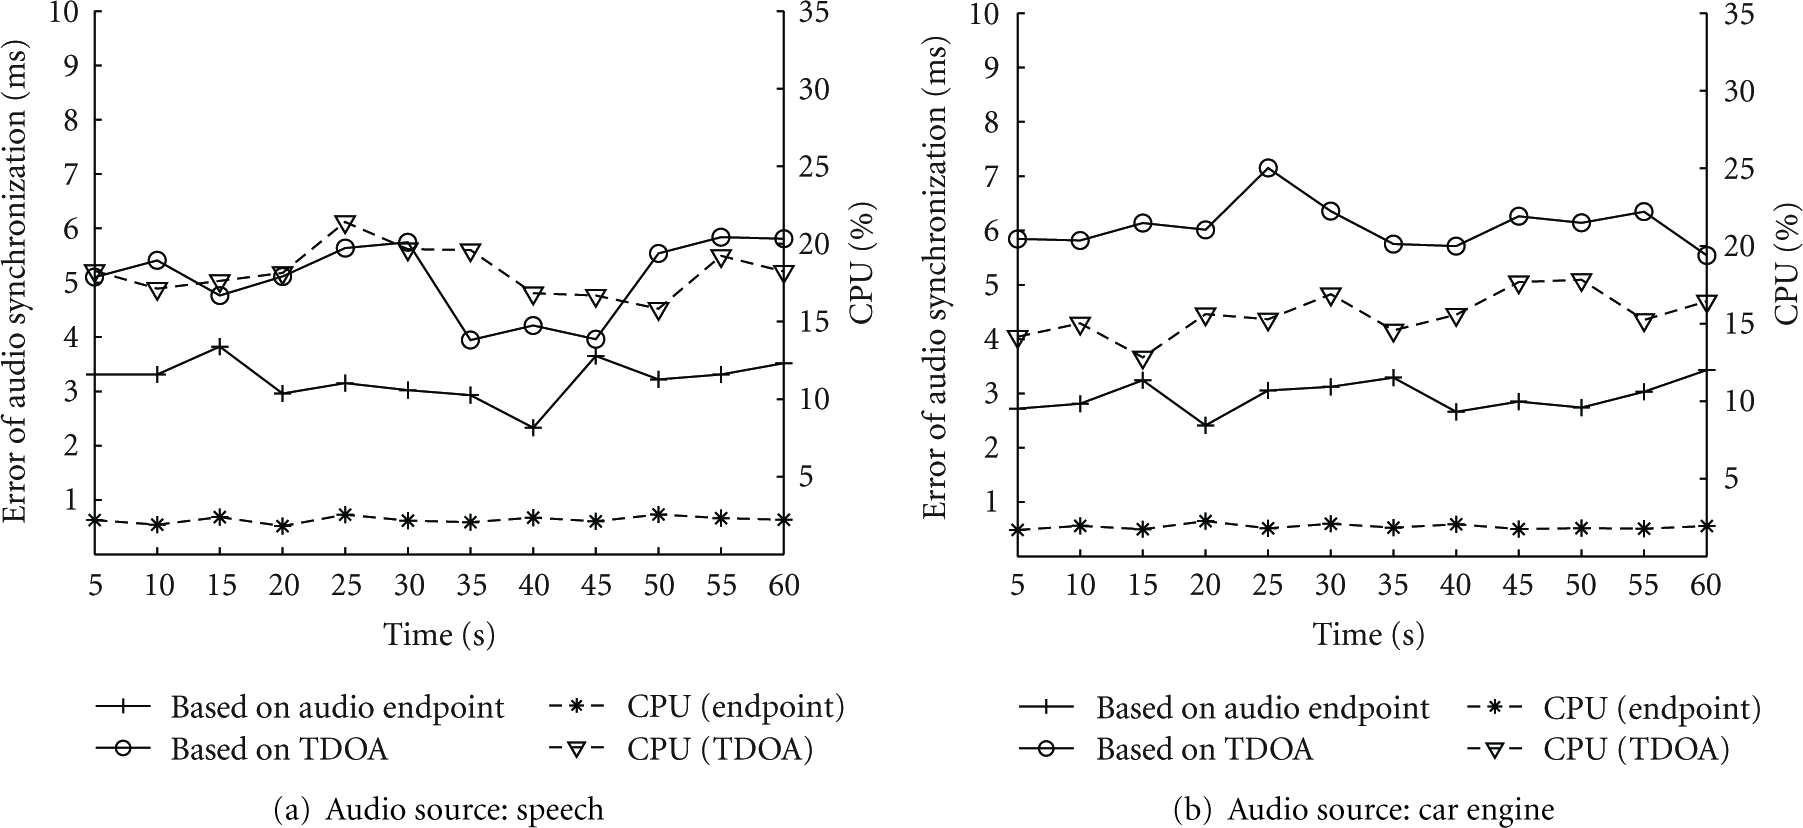
Next, we do another set of experiments to evaluate the performance of the scheme with the background noise. The TDOA-based scheme synchronizes the audio streams based on the audio features of the frequency domain. There exists some frequency components difficult to separate from the background noise. Thus, a little more synchronization error is introduced in the experiment (Figure 16). The interference of the background noise is also reflected in the time domain. However, for the proposed scheme, we have synchronized the audio streams roughly by aligning the symbols. The adjustment scheme can be performed in a small range, which greatly reduce the effect of the noise on the synchronization. Besides, the proposed fingerprint matching scheme employs the macrofeature of the audio signal, which can also help synchronize the audio streams precisely.

The performance of the audio synchronization in the street with environment noise when different audio sources are deployed.
Finally, we evaluate the performance of the audio synchronization schemes under the poor network condition. At the sensor node, the packet in the captured stream is discarded randomly before reporting. As shown in Figure 17, the TDOA-based scheme is affected greatly. The different packet loss and different loss count in the audio streams have great influence on the signal correlation. But, the proposed endpoint-based scheme performs well under this condition. On one hand, the endpoint detection is performed before packet transmission. It can be hardly affected by the communication interference. On the other hand, the fingerprint matching in the adjustment algorithm is also immune to the high packet loss.
The performance of the audio synchronization in the speech laboratory with the random packet loss rate.
7.4. Performance of Clock Synchronization
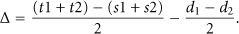
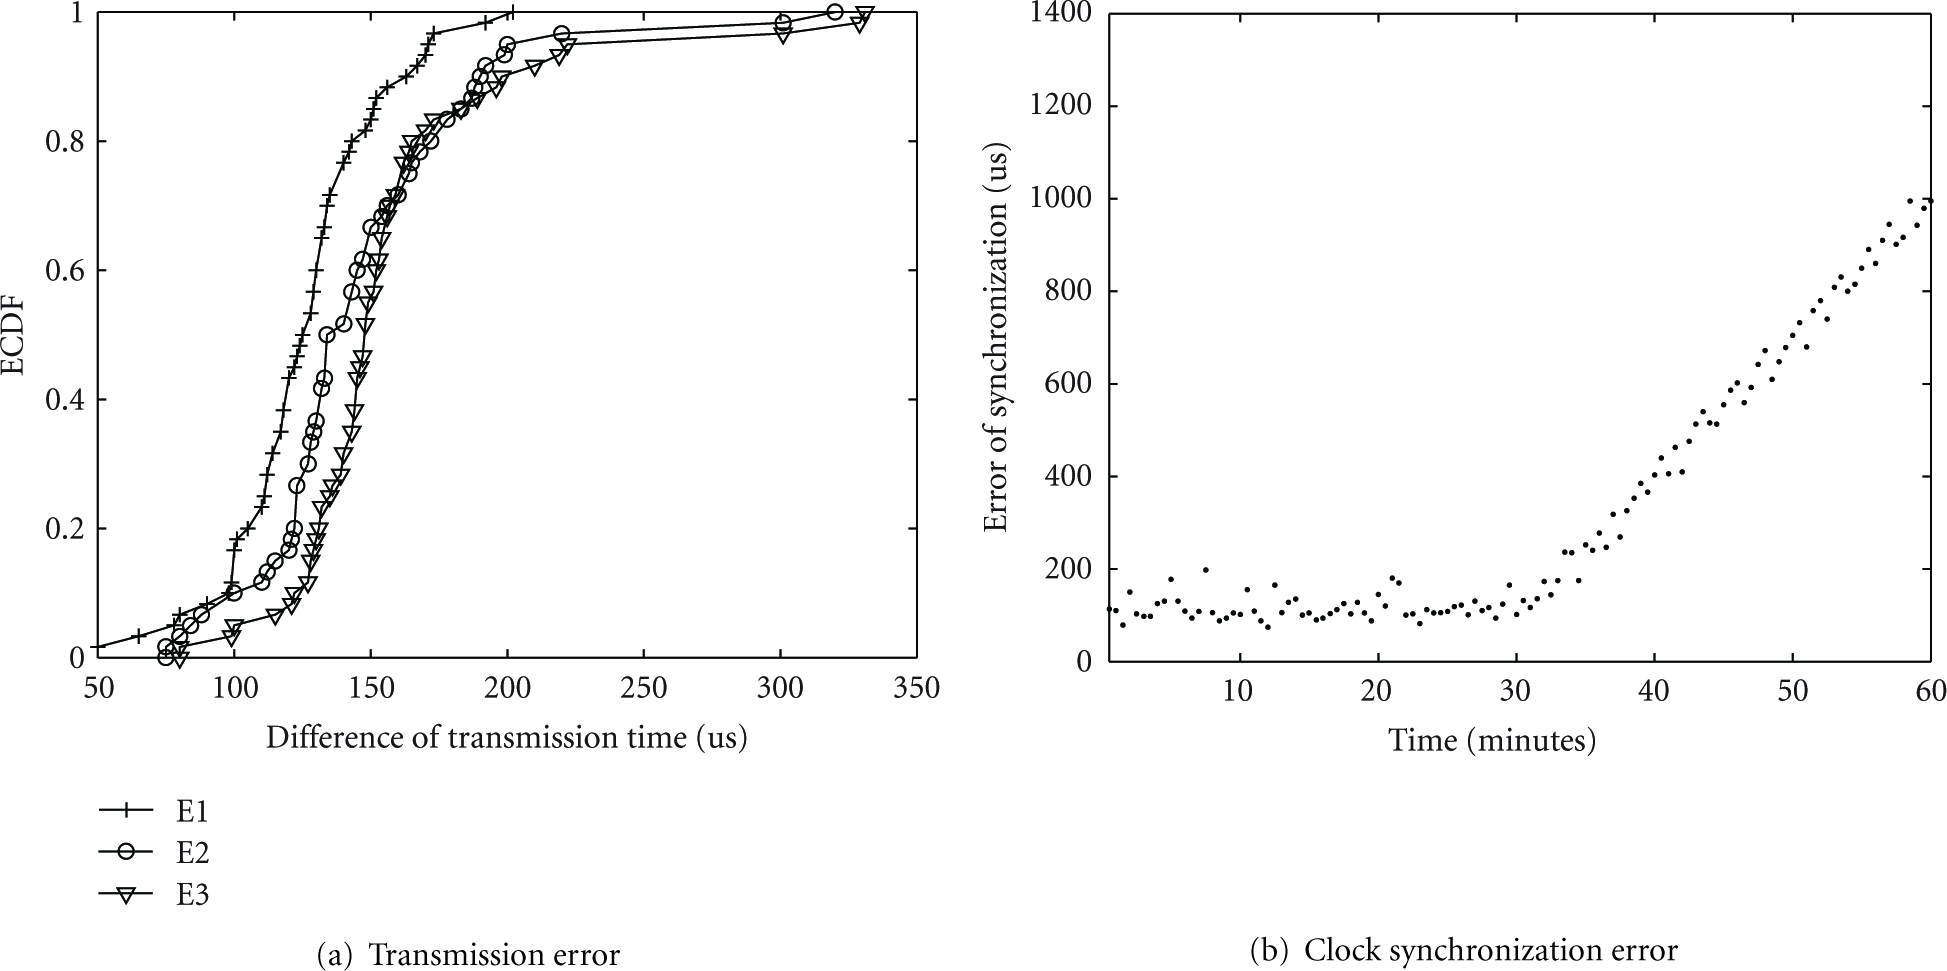
First, we evaluate the synchronization error introduced by different transmission delay in the Wlan under different traffic load (Table 3). In the experiment, one video sensor and gateway connect with Ap1 (access point) and Ap2, respectively, the video sensor sends two messages quickly to the gateway at the interval of 2 ms and the different transmission delay can be calculated according to the receive time of these two messages. We use empirical cumulative distribution functions (ECDFs) to quantify the synchronization error induced by the different transmission delay. In Figure 18(a), the x-axis denotes the difference of transmission delay and y-axis denotes the ECDF. For example, a point with value (230,0.95) on x- and y-axes, respectively, indicates the fact that 95% of the time, the different transmission delay is less than 230 us. As shown in Figure 18(a), the error maintains between 80 us and 250 us in most of the time and when the traffic load becomes heavier, there is little change of the error distribution. In our platform, the synchronization error of hundreds of microseconds can be acceptable for many applications.
Traffic load.

Evaluation of the performance for the clock synchronization.
Next, we also evaluate the accuracy of the synchronization between the audio sensor and gateway. In the experiment, the video sensor resynchronizes with the gateway every 30 seconds. As Figure 18(b) shows, at the first half an hour, the maximum synchronization error is less than 200 us. We deduce that the main error comes from the synchronization between the video sensor and the gateway which is introduced by the different transmission delay. To evaluate the skew compensation, in the gateway, we stop synchronizing with the video sensor at the 30th minute. We find that the error increases to 1 ms at the end of the experiment. In our platform, we can configure the resynchronization period correspondingly according to synchronization requirement of different applications.
7.5. Evaluation of the Synchronization Controlling with Multilevel Buffer
Currently, we have implemented the proposed synchronization control scheme in a general WMSNs platform, in which the multimedia sensor consists of an S3C2440 chip, a microphone, a USB-based camera, and a wireless network card. The experiment will be performed on the enhanced surveillance platform in the future. In this section, we test the performance of the proposed scheme and compare with the traditional scheme proposed in [16]. The metrics used in the experiment are as follows: (1) average packet loss rate, defined as the mean value of the packet loss rate caused by the synchronization control; (2) average delay: the mean value of the delay consumed by each packet of all the reported streams.
In Figure 19(a), we evaluate the average packet loss rate during the experiment. When the data transmission rate increases, the traffic burst will lead to more packet loss rate for lack of free buffer space. As the buffer size is adjusted, the packet loss rate reduces adaptively. In the proposed scheme, we always try to keep the average packet loss rate below the predefine threshold (5%). But, for the traditional scheme, it is designed to run on the powerful synchronization controller. When it is deployed in the resource-constraint sensor, the allocated buffer size can not always match with the data transmission rate, so, the high packet loss rate will be introduced (e.g., the time from 110 s to 250 s in the experiment).
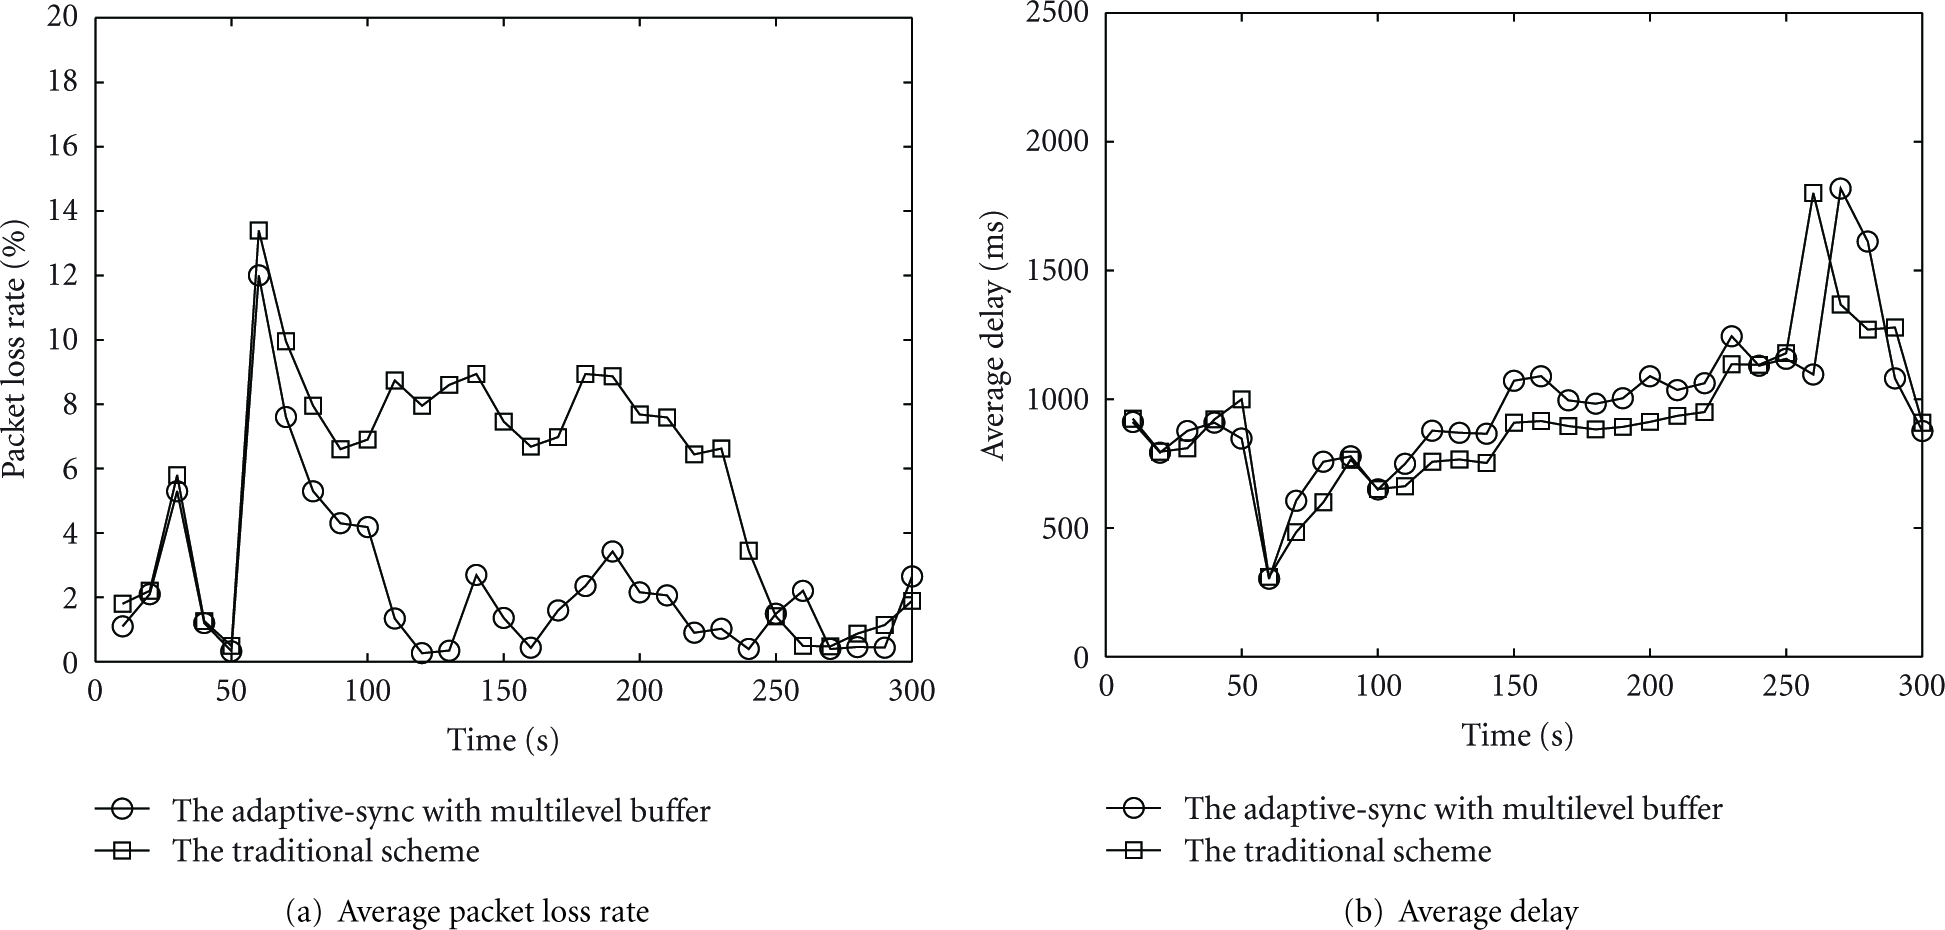
The performance of adaptive synchronization control scheme.
In Figure 19(b), we describe the average delay of the received packets. In the first 60 seconds of the experiment, the average delay for the two schemes is about 900 ms. At about the point of 60th second, the average delay decreases sharply. This is because, when the buffer size is small and data reporting rate increases, less buffering delay will be introduced. As the buffer size is adjusted adaptively, the average delay is recovered to about 800 ms. In the experiment, we find that, from the time 110 s to 250 s, the proposed scheme consumes a little more delay. By analyzing the mechanism of the two schemes and combining the metrics of the average packet loss rate and the buffer size, we know that the additional delay may be caused by the request/response communication among the master and slave nodes. The introduced delay overhead is no more than 200 ms. It can be acceptable in most of applications. Finally, when the data transmission rate decreases, a large buffer size also leads to a big delay (e.g., at about the point of 270th second).
From the experiment above, we find that a low packet loss rate with little delay and communication overhead can be maintained in our scheme. Actually, we can also implement the proposed scheme in the traditional network. With abundant memory resource in one node, it will perform like the traditional synchronization control algorithm.
8. Lessons Learned
Developing a nontrivial multimedia surveillance platform with the resource constrained wireless audio sensor network has taught us many lessons. The most important one is that there are lots of special features which make the real deployment of WASNs difficult. So, what are the special characteristics?
8.1. Sensor Design
In designing the audio sensor, there are many factors needed to be considered, such as the current consumption, processor capacity, operating system (OS), and scalability. A few classic sensors (micaz, telosb, and eyesifxv2) with 8/16 bit processor have been developed for traditional Wireless Sensor Network (WSN). These platforms support the operating system of TinyOS. The simple audio sampling and transmission can be undertaken by these sensors. But they can hardly handle the complex filtering and encoding. Hence, these off-the-shelf nodes lack scalability for the proposed platform. Powerful processors with the embedded Linux OS is also not suitable for the audio sensor since the serious energy cost in processing. As far as we know, currently, there is no one processor that satisfies all the listed factors. After weighing the pros and cons, we set the priority of these factors from high to low: processor capacity, current consumption, scalability, and supporting OS. The building of both audio and video sensors in the platform follows this rule.
8.2. Energy Cost
For the traditional scalar sensor, it usually sleeps all the time and only wakes up periodically to report sampled data. Most of the energy consumption is spent on the communication. However, our experiment results reveal that this conclusion is not always true for the multimedia sensor. For example, audio sensor usually works with the event-driven mechanism. It opens the radio and reports audio streams only when some events are detected. In most of time, the radio module keeps sleep, but the sampling and filtering components work all the time. From our experiment in the laboratory building, we find that, for audio sensor, the energy cost in communication accounts for less than
8.3. Transmission Power
We utilize the CSMA/CA protocol in the MAC layer of WASN. This protocol is flexible and suitable for the audio sensor with the event-driven mechanism. But, one problem induced is that if the sensor sends data with a high transmission power, many neighboring sensors even with different destination addresses will be affected and prevented from reporting. The reason is that neighboring sensor performs the clear channel assessment before transmission and will postpone the reporting once detecting interference in the channel. When the transmission power of the sensor is set to higher, more neighboring sensors will be interfered. The influence of the high transmission power is often ignored in the traditional WSN for the low communication traffic. But, in the WASN, when one event occurs, there may exist several neighboring audio sensors capturing it and these sensors will report continuous audio streams simultaneously. The transmission power is a key parameter in WASN which affect the network throughput greatly. Our experiment shows that nearly
8.4. Data Fusion
Our initial platform implementation reveals that data fusion is a necessary service that shall be performed during the audio stream transmission. On one hand, as the audio sensor reports stream hop by hop, higher packet loss rate will be induced at the router that is close to the sink. This is because streams from different sensors contend to transfer through the aggregation node. The situation will be worse if more audio sensors detect the sound event simultaneously. On the other hand, large number of audio streams delivery means more energy cost. Actually, there exists a lot of redundant information in the reporting streams. We need not have all the sampled data reported. Hence, data fusion is a key service that makes the platform work effectively and efficiently. We have developed an flexible audio synchronization scheme. Based on the audio synchronization, we expect that varieties of data fusion algorithms researched can be deployed in our platform.
8.5. System Scale
System scale is an important factor which decides the usability of the proposed platform. There are two aspects that affect the system scale: maximum hops count and network capacity. From the experiments, we find that, for one audio stream, about 6 hops of maximum transmission distance can be reached in the platform. Beyond this range, the quality of the received audio signal will be unacceptable. The limiting condition includes energy cost, bandwidth, delay, and delay jitter. We also evaluate the network capacity for one sink node (In the platform, the video sensor acts as the sink node and the network can be regarded as multisink structure.) Eight audio sensors can report the streams to the sink at the same time with the high signal quality. By implementing fusion schemes, the network can support more audio streams transmission. The current platform can satisfy most of applications. To further greatly improve the system scale and increase the usability and flexibility, a new radio chip with low power and high throughput is expected to be developed to support the transmission more efficiently.
9. Conclusion
Traditional video surveillance systems without making full use of audio information have many drawbacks. In this paper, we describe our initial design and implementation of an enhanced surveillance platform. There are a number of significant contributions that this paper describes. First, we developed low-power, high-quality audio, and video sensors which serves as the basis of the proposed enhanced surveillance platform. Second, we designed a specific router scheduling algorithm that can balance the energy cost of sensors and help to find the weak energy point in the network. Third, we designed a distributed audio synchronization scheme for the effective fusion and aggregation. Finally, we also proposed an clock synchronization algorithm based on gateway in the heterogeneous network which provide a foundation for the multimodal fusion of the reported streams. We also build a simple sample application in our lab building and share our lessons learned from the implementation. Currently, we are working on creating an open source platform that can be used by researchers to include the fruits of their research. The goal is to have the platform in use for research and industry areas such as animal science and security.
Footnotes
Acknowledgments
This work is partly supported by the National Basic Research Program of China under Grant No. 2011CB302701; the National Natural Science Foundation of China under Grant No. 60833009 and No. 61070205; China National Funds for Distinguished Young Scientists under Grant No. 60925010; the Funds for Creative Research Groups of China under Grant No. 61121001; the Program for Changjiang Scholars and Innovative Research Team in University under Grant No. IRT1049; the Research Fund for the Doctoral Program of Higher Education under Grant No. 20110005110007.