
Abstract
Abrasive processes, commonly employed in manufacturing, are difficult to model because they rely on brittle particles with unknown geometry and multiple points of contact. Newly developed microreplicated abrasives allow for control of abrasive grit properties such as size, shape, and distribution. This paper proposes and validates a parametric model of abrasive machining that allows for studying the interaction of this particular tooling with randomly generated surfaces. In this work, the parameters of a probability distribution function that represents the workpiece surface are approximated by profilometry data. Monte Carlo simulation is used to account for inter- and intraspecimen variability. A geometric representation is used to mathematically represent the interaction between workpiece and tool. The results show good correlation between theoretical and actual values. This approach could be used to aid in tool geometry design as well as in process parameter optimization.
1. Introduction
Most parts rarely obtain their final finish through manufacturing processes such as casting, forging, or machining. Secondary processes such as grinding, sanding, and polishing are typically used to impart the workpiece with its final surface quality. These abrasive machining processes rely on tooling that is highly variable with respect to particle size, distribution and density of the abrasive grits. Also, the orientation of the grits varies between tools and within the same belt of grinding wheel. This is mainly due to the nature of the process involved in manufacturing coated abrasives, whereby multiple layers of oriented grits of approximately the same size are attached to a substrate and further oriented with gravity or electrode-induced polarization. Consequently, it is not surprising that abrasive-based machining processes have been among the most challenging to accurately model and characterize.
Early modeling efforts have addressed this area by assuming specific tooling and workpiece conditions. Several researchers [1–4] have adopted a “single-grit” approach. These studies model the interaction between a single-point abrasive tool and a workpiece in a deterministic way. Extensions of this approach have produced contributions with respect to the ploughing phenomenon and elastic-plastic effects [3, 5]. Williams and Xie [6] developed a three-dimensional model that predicts the tangential force between a pyramidal asperity and a ductile surface. This work also investigates the interaction of several abrasive passes on wear tracks while determining the importance of the distance between tracks upon wear mode. Other efforts [7] have investigated the interaction between a geometric computer tool model on a perfectly flat surface. Bouzakis and Karachaliou [8] developed a computer model that uses the wheel cutting profiles to determine the chip geometry in the cutting edge of each grain. A different approach suggests modeling the variability in particle size, shape, and placement in the substrate by assuming statistical distributions [6, 9–11]. This stochastic approach is useful for developing input-output correlations that are the basis for predictive process capabilities. Sayles and Thomas [12] found that the initial height distribution of a grinding wheel is negatively skewed, but also that it will approach a Gaussian distribution with further grinding. The work by Jiang et al. [11] considers wear rate and size effect for multiple conical particles with round tips. However, the common gaps found in these studies include (i) the interaction between multiple layers and rows of abrasive grits has been studied in a limited way and; (ii) the initial condition of the workpiece surface (i.e., surface roughness) is usually not considered as an input.
In addition, technological innovations on the manufacturing processes of abrasives have allowed for precise location of the abrasive grits on the substrate. This technology, called microreplication, consists of precise casting of three-dimensional structures (such as pyramids or cones) onto a backing material (Figure 1). When compared to traditional coated abrasives, these structured abrasive tools are more deterministic with regards to shape, size, distribution, and orientation of the grits.

SEM micrograph of structured abrasives (20.0 kV).
The objective of this study is to develop and validate a parametric model of the engineered abrasives that allows studying the interaction of this particular tooling with various random surfaces. This would allow prediction of surface roughness from a given tool-workpiece pair as well as determining the appropriate tool geometry and process parameters for a specific application.
2. Materials and Methods
This work has been subdivided into four areas: (i) parametric modeling of abrasive tooling, (ii) generation of random workpiece surfaces, (iii) modeling of tool-workpiece interactions, and (iv) experimental validation.
The purpose of the first effort is to develop a computer model flexible enough to define, manipulate, and visualize the different geometric parameters of the tooling. The parameters of interest are the size, shape, and distribution of the abrasive grits as well as their relative orientation with respect to the feed direction. Since it is the predominant commercially available configuration, this study focuses only on pyramid-shaped grits with a rectangular base. The second effort seeks to develop a model capable of representing different random surfaces with the same profile roughness distribution prior to machining. Reverse metrology from specimens is used to obtain data and fit a probability distribution with its respective parameters. Random surfaces are then generated from these distributions. The third effort combines the earlier two outputs to model the interaction and produce the resulting surfaces. A graphical representation of this interaction is generated along with the assessment of the resultant profile after machining. All the computational models for the tool, workpiece, and tool-workpiece interaction were developed in Matlab. The final effort is directed towards validating the model with experimental data.
3. Parametric Modeling of Abrasive Tooling
One of the most commonly available engineered abrasives possesses pyramid-shaped grits with rectangular bases. The proposed tooling model is generated by characterizing and varying the geometric parameters such as the base widths, height, and the pattern of these pyramidal shaped abrasive grits.
The dimensions of the geometric parameters that are used as input to develop the tooling model were extracted from a micrograph of an actual abrasive sheet. Using image analysis software, base widths of the pyramid-shaped tool were measured and mapped into a computer representation (Figure 2). The tool model representation shown in Figure 2 is a 4×7 patch of pyramidal grits generated in Matlab. Two-scaling vectors characterize the deviations of each base width with respect to a predefined nominal square. This patch is the fundamental area to be replicated by the computer model several times across and along to form the virtual belt, thus imitating the manufacturing conditions that produced the tooling. The extent of the abrasive area can then be defined by determining the number of patches to be replicated, as well as by manipulating the scaling vector of the overall size of the patch.

Tool model representation of pyramidal grits.
It is also necessary to state the angles which these grits would have with respect to the feed direction (constrained along the Y axis in this model). This is determined by the attack angleα (Figure 3) which can be thought of as the take-off angle from the edge of the abrasive belt. The attack angle is used as an input to homogeneous transformation matrices to rotate the patch of pyramids about the Z axis

Two-dimensional representation of tooling matrix.
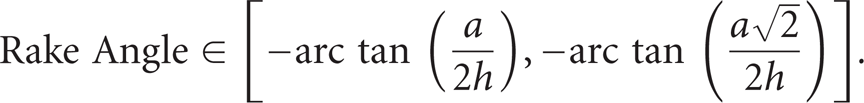
Every square in Figure 3 represents the projection onto the X-Y plane (top view) of a four-sided pyramidal grit. This can be specified in the model by selecting the number of grits per row (N), any number of total rows (M), and the base widths (a1 and a2). By selecting the appropriate pyramid height (h), it is then possible to completely define the pyramidal geometry. The rake angle is given by the parameters (a1, a2, and h) along with the orientation of the pyramid with respect to the feed direction (α). For a square-based pyramidal grit of length a, the rake angle is contained in the interval depicted by
At this point, it is possible to obtain a 3D graphical representation of the grits (Figure 4). In this example, the configuration is one patch of 7 grits per row, 4 rows, and 35° attack angle. From Figure 4, it can be noticed that projections of the grit matrix onto planes XY and XZ are calculated and plotted. The projection onto plane XY is developed for visualization purposes while the projection onto plane XZ is the foundation for obtaining the cumulative 2D tooling profile that would later be used to interact with the workpiece. Because the model of the abrasive matrix has a finite size, only the region that is swept by all rows of grits is considered for analysis.
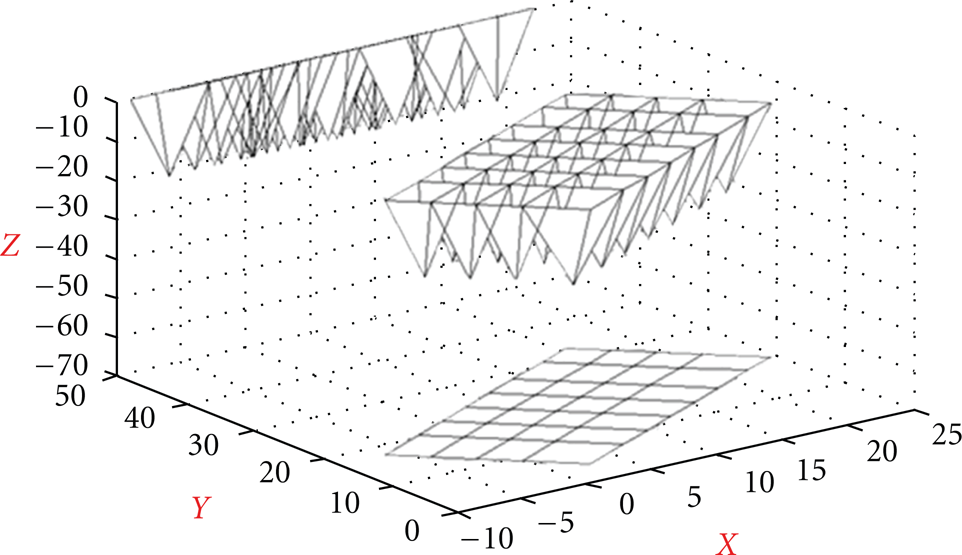
Isometric view of tooling matrix.
4. Generation of Random Work Surfaces
The next step after developing a model of the tooling was to represent the profile of the work surface. The underlying idea was to use reverse metrology to obtain the discrete and summary information of the roughness profile of actual surface specimens prior to machining. This information, in turn, was used to estimate the parameters of a probability distribution for further generation of random surfaces. This allowed for generation of multiple surfaces from identical profile distributions, thus accounting for the inherent random variability of the surfaces as well as the limitations of the measurement process. Figure 5 describes the surface generation process. Stylus-probe profilometry as well as light interferometry was used to collect the surface descriptors root mean square roughness (R q ) and profile skewness (Rsk) [13].

Generation of random work surfaces.
These surface descriptors were used to estimate the parameters of a gamma distribution. The surface parameters R q (root mean square roughness) and Rsk (skewness of the profile) are calculated according to the ASME B46.1 standard [13], as shown in

where Z represents the height deviations taken within the evaluation length (L) and measured from the mean line.
The probability density function of a gamma distribution can be described by two parameters as shown in

where b is the scale parameter and c is the shape parameter (

it is then proposed that the scale parameter can be calculated by approximating the variance by the root mean square (rms) average roughness obtained from the surface, as shown in

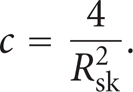
Similarly, the skewness of the gamma distribution is given by
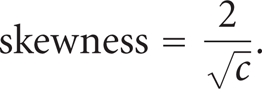
The shape parameter is then calculated by approximating skewness of the distribution by the skewness of the profile obtained from the surface scanning. This is shown in (7).
This process creates a distribution from which it is possible to generate pseudorandom points to fit new surfaces, which is suitable for a Monte Carlo simulation scenario. This random generation of surfaces allows for the incorporation of variability into the workpiece surface model while maintaining the average surface descriptors of the native surface.
The randomly generated sets of numbers are used to characterize the surface by fitting a 15-degree polynomial. The degree of the polynomial was chosen to be one of the largest that did not exhibit the edge oscillations known as the Runge phenomenon. Since the roughness data is typically presented in equidistant nodes, a polynomial interpolation greater than 20 degrees would cause severe oscillations at the edges of the interval, thus increasing the interpolation error. These oscillations can be minimized by using Chebyshev's nodes instead of equidistant ones or simply by increasing the density of the points towards the edges of the interval. Each generated random surface is then rotated via homogeneous transformations, projected in the XZ plane, and superimposed with the 2D-pyramid grits tool projection. The workpiece and tool are now projected in the same plane and their interaction can now be modeled, thus emulating the machining process.
5. Modeling of Tool-Workpiece Interactions
The first step in modeling this interaction was to develop an equation describing the amount of tool indentation as a function of the applied load. This was empirically obtained by performing controlled Vickers (pyramidal indenter) hardness tests on the material of interest and subsequently developing the load-indentation relationship. Afterwards, it was necessary to obtain the polynomial equation representing the work surface as well as the line equations from the abrasive tooling profile that were relevant. The latter consisted of the line equations for the edges of each grit that were boundaries in the XZ tool-workpiece projection. Finally, to obtain the surface profile left in the workpiece after M passes, it was necessary to calculate the intersection points between relevant surface profile and tool projections.
Since the relevant edges of the pyramid grits are represented by line equations and the surface by a polynomial equation, the intersection points can be obtained by numerical methods. In this work, a Newton-Raphson approach was used to approximate the relative roots of the surface polynomial with respect to the tooling edges. A compensation algorithm was developed and introduced to alleviate approximation errors. This process yields a point cloud that, once connected, depicts the resulting surface after machining. The machined profile is shown in Figure 6.

Model of a machined profile.
The assessment of the resulting profile was developed to resemble that of a profilometer. In order to calculate surface descriptors, the machined profile is scanned at a user-specified sampling length and the points stored in a database for surface descriptor calculation. For this study, the following surface roughness descriptors were assessed: average profile roughness (R a ), root mean square roughness (R q ), maximum profile valley depth (R v ), maximum profile peak height (R p ), and maximum peak to valley (R t ) as well as profile skewness (Rsk) and kurtosis (Rku).
6. Experimental Validation
For the purpose of model validation, a customized experimental apparatus was constructed and aluminum specimens were prepared. The abrasive tooling consisted of an engineered abrasive belt that is commercially available. The attack angle on these belts is 35°. The verification experiments included machining polished aluminum samples with strips cut out from the belts and under controlled loads. The two attack angles considered in this study were 0° and 35° as they were the two configurations most easily measured and setup with minimal error. Once the tooling was setup in position, the attack angle was verified by applying ink to the grits and pressing the belt against paper. The idea was then to produce samples at these two angles and for identical loads and number of passes and subsequently compare the trends from this experiment with those obtained from the model. A phase-shift interferometric microscope (wavelength 550 nm) was used to assess the surface topography and descriptors.
The testing apparatus (abrader) was custom designed and built. It was intended to hold a specimen in position while a controlled load was applied over a known area. It also had to be stiff enough to withstand the dynamics of an abrasive strip sliding between the workpiece and the lever mechanism with minimal lateral movement. The device consisted of a lever mechanism with a titanium shoe that pivots about a shaft. This allowed a more localized pressure and easier calculation of the area of contact. The specimens were mounted on a manually driven microstage. The area of contact was measured and found to be 1.16 cm2. There were six steel weights available for a combined total weight of 1350 grams. An abrasive strip was pulled at a constant speed to generate the abraded surface. Figure 7 shows a picture of this apparatus.

Abrader apparatus.
The specimen preparation involved machining of aluminum 2024-T351 bar stock down to a specimen size of
A correlation between the load applied and the indentation amount was developed for the material of interest. This was accomplished by a series of controlled Vickers microhardness tests with a 136° diamond indenter. The microhardness experiment showed a very linear relationship between the load applied and the depth of penetration between 50 and 1350 grams. Since the pyramid angle in the Vickers indenter is slightly different from that in the abrasive grit, this approximation had to be based on the assumption of equal energy required for displacing dislocations in the material by both pyramidal indenters. Also, in order to incorporate the depth of indentation into the model, another important assumption had to be made. It was assumed that the strain fields originated during abrasion were similar to those from the indentation experiment. Finally, the abrasive tooling utilized was silicon carbide A-110 (equivalent to a P180 FEPA).
Scanning electron microscopy was utilized for performing reverse metrology on the pyramids and for illustration purposes. The metrology for base width was performed by processing a nontilted image with measurement software. The average measurements from 28 pyramids yielded an average base of 843 μm and pyramid height of approximately 415 μm. This yielded a base-height ratio of approximately 2 : 1.
7. Results and Discussion
The model was run a total of 10,000 iterations. The configuration of the model was a grit matrix of 6×10, with base widths following a uniform distribution between 630 and 1000 μm. The virtual sampling length was set at 0.05 μm, while the indentation depth at 34 μm. Two attack angles were compared: 0° and 35°. Surface assessment on the actual specimens was performed before and after machining with a phase-shift interferometric microscope (wavelength 550 nm). The area of sampling was 500 μm × 500 μm. The starting roughness (R a ) for the polished specimens was measured at 0.032 μm. The results are summarized in Table 1.
Experimental and computer model results (values are R a in μm).

As seen in Table 1, the results obtained from the computer model correlate relatively well with those obtained with the instrumentation on the actual surfaces, especially at 35° attack angle. However, the model underestimates the R a roughness descriptor at 0° by 21%. Although this is a reasonable departure when modeling abrasive processes, the most probable explanation is related to the orientation of the grits. When machining at 0° attack angles, the grits line up parallel to the feed direction, superimposing their projections, thus creating fewer valleys in the surface. If the discrete virtual scanning misses such valleys, then a readout characteristic of a smoother surface will result. Although more general, other explanations for such discrepancies include the following.
The abrasive process is sensitive to wear and fracture, especially during the break-in phase of new abrasives. This would likely cause a change in geometry.
Mechanical and physical properties of the material are not necessarily homogeneous and may vary due to localized effects (e.g., residual stresses, hard spots, etc.).
The material removal mechanisms are not 100% efficient. It has been reported [14, 15] that approximately 15% of the groove volume is removed to form a chip and that the remainder forms ridges on the metal surfaces. The model assumes 100% material removal and thus could lead to discrepancies in final results.
The relative bluntness of nonideally sharp tip decreases with increasing penetration depth.
Further understanding of the individual effects of the parameters in the model (abrasive size, pyramid height, indentation depth, and attack angle) can be obtained by applying the model. Figures 8 and 9 depict the main effects of the abrasive matrix size and attack angle, respectively.

Main effect of the abrasive matrix size (number of grits per column and rows).

Main effect of attack angle.
Figure 8 indicates that the number of pyramid grits, a surrogate of machining time, presents a substantial influence on the surface roughness. Initially, as the size of the abrasive is increased, the surface descriptors R a , R q , and R t experience a decrease of as much as 57%. This behavior is expected and is the main reason for which abrasive operations are employed for surface finishing. The decrease in value of roughness descriptors, indicating a smoother surface, is due to the multiple pass effect: as the numbers of pyramids increases the number of grits interacting with the work piece also increases thus resulting in more material being removed. However, after certain abrasive size or, similarly, certain machining time, the surface roughness descriptors reach a plateau and no significant improvement is observed. This behavior is consistent with that reported in the literature [16], and its accurate characterization can be used to monitor abrasive use to optimally set machining times or cost-effective belt replacement policies.
With respect to the attack angle (Figure 9), the smooth roughness obtained at low attack angles (
Finally, the main effect of indentation depth, a surrogate of pressure, showed an initial linear increase but the descriptors quickly reached a plateau and stabilized. The initial increase in the descriptors can be explained by the fact that, initially, for small indentation depths, the grits are barely scratching the surface. This leaves untouched areas, which is obviously undesired, but roughness is low because the initial surface was highly polished. The reason can be geometrically described as having all the intersection points between the projections of different grits taking place above the surface level. On the other end, and after reaching a certain level of indentation, further pressure did not result in a better surface (as all the intersection points were already below the surface level and additional pressure did not generate any new surface profiles). This is consistent with the findings of Taylor et al. [17] in which the surface roughness did not improve when increasing the interface pressure after all grits were fully engaged.
8. Conclusions and Future Work
In this work, a parametric model of multiple-pass abrasive machining that employs reverse metrology as well as statistical and numerical methods is proposed and validated. The theoretical values correlate well with the actual readings. The model is flexed to analyze the individual effects of certain tool and process characteristics. The method shows potential for aiding in tool geometry design or process parameter optimization. Implementation of this model could lead into specific grit orientations on the substrate (belt or wheel) or grit characteristics (i.e., height or width) that would yield either the best surface quality (or a specific target surface roughness) or that would simply perform more robustly under specific process conditions. Also, the model could aid in determining process settings (such as pressure, machining time, etc.) that would allow optimization of abrasive life, process cycle time, and so forth. Finally, this model could be used to explore other geometrical shapes for the abrasives (e.g., cones, truncated cones/pyramids) and support design of customized abrasives for specific applications. Future work will focus on exhaustive validation of this model under additional conditions (i.e., loads, different materials, different tool geometries, etc.). Also, since this model focuses only on height variation aspects of the workpiece surface, future extensions should consider frequency (e.g., spectrum of wavelengths, etc.) and slope aspects of the resulting surface.