
Abstract
Infrared (IR) heating as alternative to forced air heating has been studied experimentally for 70 days in two identical, small-scale, experimental greenhouses. The two heating options were implemented with four IR electric lamps and an electric forced air heater correspondingly. The microclimate in the greenhouses was monitored with thermocouples. Parameters characterizing the outdoors macroclimate were also monitored. Lettuce was used as the test crop, and the two heating systems were operated automatically to maintain a suitable reference temperature at the canopy. The investigation focused on night heating needs. Results indicated that the internal air temperature in the IR-heated greenhouse was always kept several degrees lower than the value targeted for the canopy. This lower temperature resulted in 43% average energy savings for the IR-heated greenhouse, compared to the conventionally heated one. A simple numerical model was used to estimate the potential energy savings in a production-scale greenhouse.
1. Introduction
The objective of greenhouse heating is to maintain the canopy at a specified temperature range (often different for day and night) corresponding to the optimum growing conditions. To accomplish its mission a heating system has to supply the necessary heat to the canopy in order to compensate its losses. A heating strategy should therefore aim to minimize heat losses from the plants and provide the necessary heating to the canopy. In this context the greenhouse cover has a positive effect since it protects the plants from direct exposure to the weather (wind, rain, etc.) and to agents putting the production at risk (insects, pathogen, etc.). Since heat losses from the canopy include convection and radiation components, decreasing air circulation within the greenhouse is expected to reduce heat losses due to convection. Besides, depending on the properties of its material, the cover may also prevent radiation from the canopy to escape or/and present a low or high resistance to heat losses by conduction through the cover [1–3].
Conventional greenhouse heating systems are based either on circulation of hot water through a piping system or on direct use of air heaters [4, 5]. In these cases, heating is supplied to the greenhouse air that is maintained at temperatures close and a little higher than the value targeted for the plants. To avoid temperature stratification due to buoyancy, conventional systems have to be combined with horizontal airflow fans to circulate air and obtain an even temperature distribution. Apart from consuming energy, the fans increase heat losses from the canopy and the cover, and they may also increase the spread of disease. The design and operational objective of conventional systems is aimed to maintain air temperature in the greenhouse at values optimal for the plant growth. Although more efficient options for greenhouse heating have been suggested by several investigators [5, 6], forced air (FA) heating will be considered in this work as a reference conventional heating system due to its low cost and widespread use in greenhouses, and also its easy and efficient implementation to the experimental greenhouse of this investigation.
In the greenhouse industry, infrared heating is largely unknown or misunderstood [7], despite some early attempts to verify its advantages [8–10]. Current trends indicate that it is worth reconsidering as a reasonable alternative to conventional forced air or pipe heating [11–13]. Radiative heating is based on a different concept compared to conventional systems and therefore calls for a reorientation of previous analysis of energy fluxes in a greenhouse. Since radiation allows directional control, radiative heating can be used to focus the heat flux on the canopy, in order to maintain canopy temperature within the specified temperature range. To accomplish this goal, the heating flux should compensate for the canopy losses by convection to the greenhouse air and by radiation to the cover and the soil. Probably the most striking example of radiative heating concept is the Earth's heating by the Sun. Solar radiation establishes temperatures close to the ground suitable for sustaining the ecosystem, whereas at higher altitudes the atmospheric temperature is several tens of degrees lower.
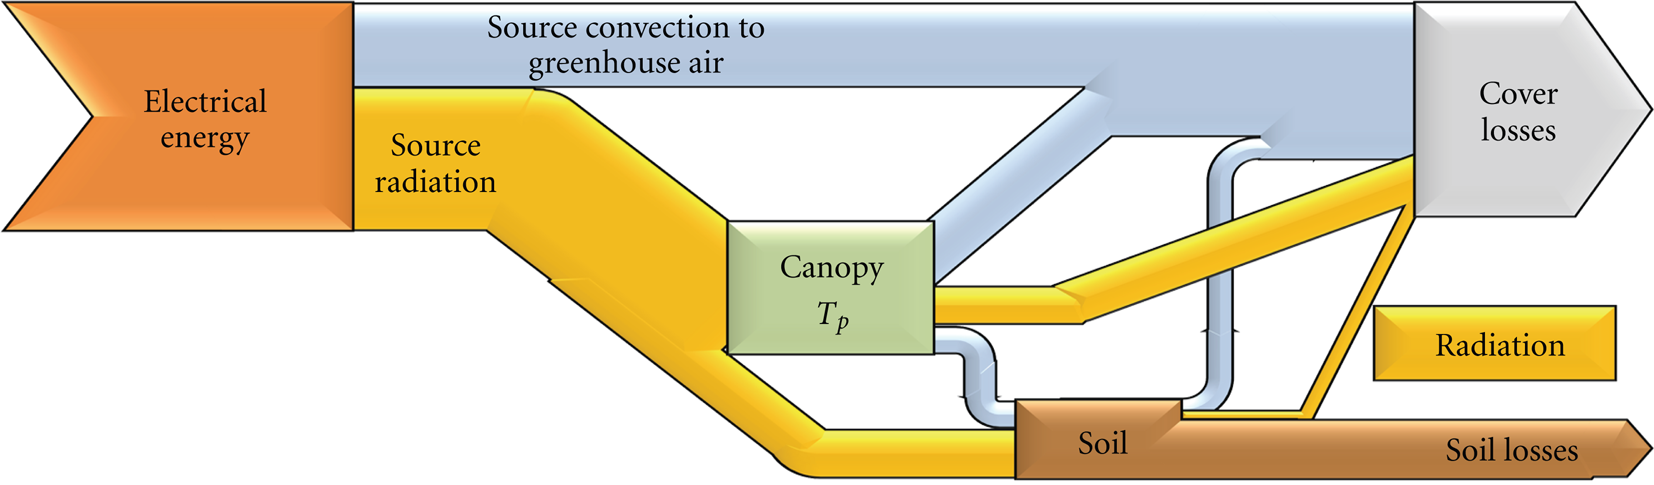
Energy flow within a conventional and an IR-heated system is outlined in the Sankey diagrams in Figures 1 and 2 [14]. The diagrams are based on calculations for the heating needs of the experimental greenhouses using electricity, and more specifically forced air (FA) heaters in the conventional system and Infrared (IR) lamps in the radiative system. The diagrams are qualitatively representative of the energy flow of systems utilizing burners, although in these cases secondary energy flows such as boiler and transmission line losses or losses due to high temperature of flue gases should also be taken into account. The diagrams in Figures 1 and 2 also include side-effect losses associated with each heating principle, the high convection losses due to the heating of greenhouse air in the case of conventional heating and the convective losses from the IR source due to its high temperature or radiative losses to the soil due to poor directionality in the case of radiative heating.

Sankey diagram for forced air heating.
Sankey diagram for IR heating.
Despite the fact that electricity is not currently the preferred option for greenhouse heating, in the present study electrical heating devices have been used because of ease and accuracy of implementation, control, and performance monitoring. However, most of the results and conclusions of this study are still valid for the corresponding gas or oil-fired alternative systems. In addition, central or distributed generation of electrical power using renewable energy sources seems to be the most realistic long-term alternative for clean energy, especially for static-land-based operations. Therefore, it is very likely that electrical heating will eventually become a preferred option for greenhouses.
In a previous paper the potential advantages of night-time heating of greenhouses by modern infrared (IR) radiative sources, instead of forced hot air, have been examined by preliminary experiments and by numerical simulation [13]. Specifically, measurements of indoor and outdoor conditions during typical cold nights in central Greece were conducted in a scaled down experimental greenhouse, which operated alternatively by forced hot air and by IR heating. A simple theoretical model that contains all the essential physics was also developed and used in parametric studies. Experimental and simulation results provided evidence that, with IR heating, inside air temperatures several degrees lower than the desired canopy temperature were obtained, and that this temperature difference increased proportionally to the nightly drop in outside temperature. However, the differences in outdoor conditions between nights with IR and with forced air heating, and the lack of energy consumption direct measurements limited the quantitative comparison of the two options. Thus, the model was validated by comparing predicted and measured temperatures and was subsequently used to estimate energy savings with IR heating in the range 45%–50%.
In the present work, results of the previous study are extended and strengthened by utilizing two identical small-scale greenhouses and by taking real-time measurements of the energy consumption. Parallel operation of the two greenhouses allows for a direct and accurate comparison of the two heating systems under identical weather conditions. The collected data also facilitate an assessment of the parametric dependence of the savings achieved by IR heating on the variation of the outdoor conditions during the nights of the campaign.
Although energy efficiency provides the main motivation of the present study, another favorable side-effect is worth noting. When the canopy is retained at a higher temperature than the rest of the greenhouse, the possibility of moisture condensation on plants’ surface is drastically reduced, that is, IR greenhouse heating is also expected to contribute to improved product quality [15].
2. Methodology: Experimental Setup and Procedure
Two identical small-scale experimental greenhouses were used, each one as the test bed of the two heating options that were considered, namely, forced hot air heating and IR heating. The system was an extension of that used by Kavga et al. [13] with the addition of a second greenhouse of exactly the same design, dimensions, and construction as the one previously available. Details and justification of the greenhouse design, instrumentation, and operational procedures can be found in the above-mentioned article. A brief outline including the main features of the experimental set-up and the differences with the previous installation is presented next for completeness.
Both greenhouses were constructed of aluminum framework, with 3 mm thick glass panels as covering material. They had the same orientation and were located in the same field with a sufficient distance between them to avoid mutual interference.
Maximum thermal requirements for the experimental greenhouses were estimated to be 1100 W for the forced air (FA) heated and 600 W for the IR-heated greenhouse. These estimates were reached by using the simulation model developed by Kavga et al. [13], under the following conditions: plant canopy temperature T p = 15°C, outside temperature T o = 0°C, and wind speed WS = 1 m s−1. Based on these heat losses estimates, different heating systems were implemented in each greenhouse. The first one was a forced air electric heater with nominal power levels, 1.0, 1.2, and 2.0 kW, accompanied by a small horizontal fan to circulate air and obtain even temperature distribution. The second utilized four incandescent IR lamps, with blown-bulb reflectors, of nominal power 250 W each and 50° beam angle, located at the four corners of the greenhouse, 1 m above the ground. Identical automatic ventilation systems were installed in both greenhouses to prevent overheating, but these very rarely turned on in winter and only during daytime.
The IR lamps were made of hard glass with high mechanical strength and resistance to thermal shocks (e.g., water splashes). They emit a high proportion of infrared light and a low proportion of visible light. The distribution of the heat flux in the greenhouse was measured with a thermopile-type Pyranometer and has a sufficiently uniform pattern [13]. The efficiency of electrical energy conversion to thermal radiation is estimated close to 63%.
Interior microclimatic parameters monitored in both greenhouses were the temperature at several locations of the canopy

where L d is the longwave radiation, σ is the Boltzman constant, and ε the emissivity of the sky.
Instrumentation and sensors used (symbols refer to Figure 3).

All instruments and sensors were calibrated either using corresponding certified instruments as reference or using standard samples traceable to European or International standards.

The small-scale experimental greenhouses and the location of the sensors (dimensions in m).
All data were scanned every minute, and 10 min averages were stored on a data logger that was also used for heating and ventilation systems control. Attention was focused on greenhouse performance during the night, when the heating systems were automatically turned on. Overall night-time mean values were also computed from the respective time series, based on the interval between the steep temperature changes at sunrise and sunset. Two electronic watt meters were used for energy consumption recording by the heating systems in the experimental greenhouses.
The crop tested was lettuce (Lactuca sativa L. var. Toledo, Romaine type), arranged with a density of 20 plants per square meter. Based on corresponding temperature recommendations [16] a night-time temperature of 15°C was chosen for the timely growth of lettuce and the heating systems were set to turn on when T p dropped below 14°C and to turn off when T p exceeded 16°C. The duration of operation for each 10 min interval was recorded and subsequently used along with the true power of each installation for the calculation of the energy consumption, allowing direct comparison of the two heating systems. During daytime, greenhouse overheating was avoided by automatic operation of the ventilation system as soon as T α rose above 22°C.
3. Experimental Results
Experimental results for the parallel operation of the greenhouses during a heating period of 70 days are presented next. The climatic conditions in the region where the greenhouses are located seldom require heating during daytime. Therefore, this work focuses on night-time heating, for which statistically significant measurements could be collected.
Measurements corresponding to a cold night (T
o
= 3.2°C) are shown in Figure 4 and indicate a more or less even distribution of canopy temperatures

Temperature variation at the canopy in (a) forced-air- and (b) infrared-heated greenhouses during a characteristic night (exact locations of thermocouples shown in Figure 3; outside temperature in Figure 7(a)).
3.1. Thermal Performance for the “Average” Night
Measurements of outside and inside conditions for the “average” night, along with variables related to the greenhouses energy losses, are presented in Figure 5, and illustrate the common trends shared by all nights of the campaign period. Values for the “average” night are defined by taking the mean of each 10-minute interval, and then averaging it over all the nights in the heating period. Thus, short-period fluctuations peculiar of a particular night are smeared out by the averaging. The averaged climatic conditions reveal the mild climate of the area where the greenhouses are located. A general trend of gradual outside temperature decrease from sunset to sunrise with a diminishing rate is clearly illustrated in the graphs, indicating a mean overall decrease close to 5°C. The temperature of the sky stays in the interval 272–275 K, with minimum values corresponding to the time periods after sunset and just before sunrise. Since rainfall took place only on very few nights, the averaged precipitation did not converge to a statistically significant result, and the individual characteristics of particular nights persist in the graph. The wind speed takes average values close to 1 m s−1 during the night, although higher values averaging to ∼2 m s−1 are observed just after the sunset. Absolute humidity is around 6–7 g m−3, whereas the relative humidity increases from 70% to 90% during the night due to outdoors temperature decrease.
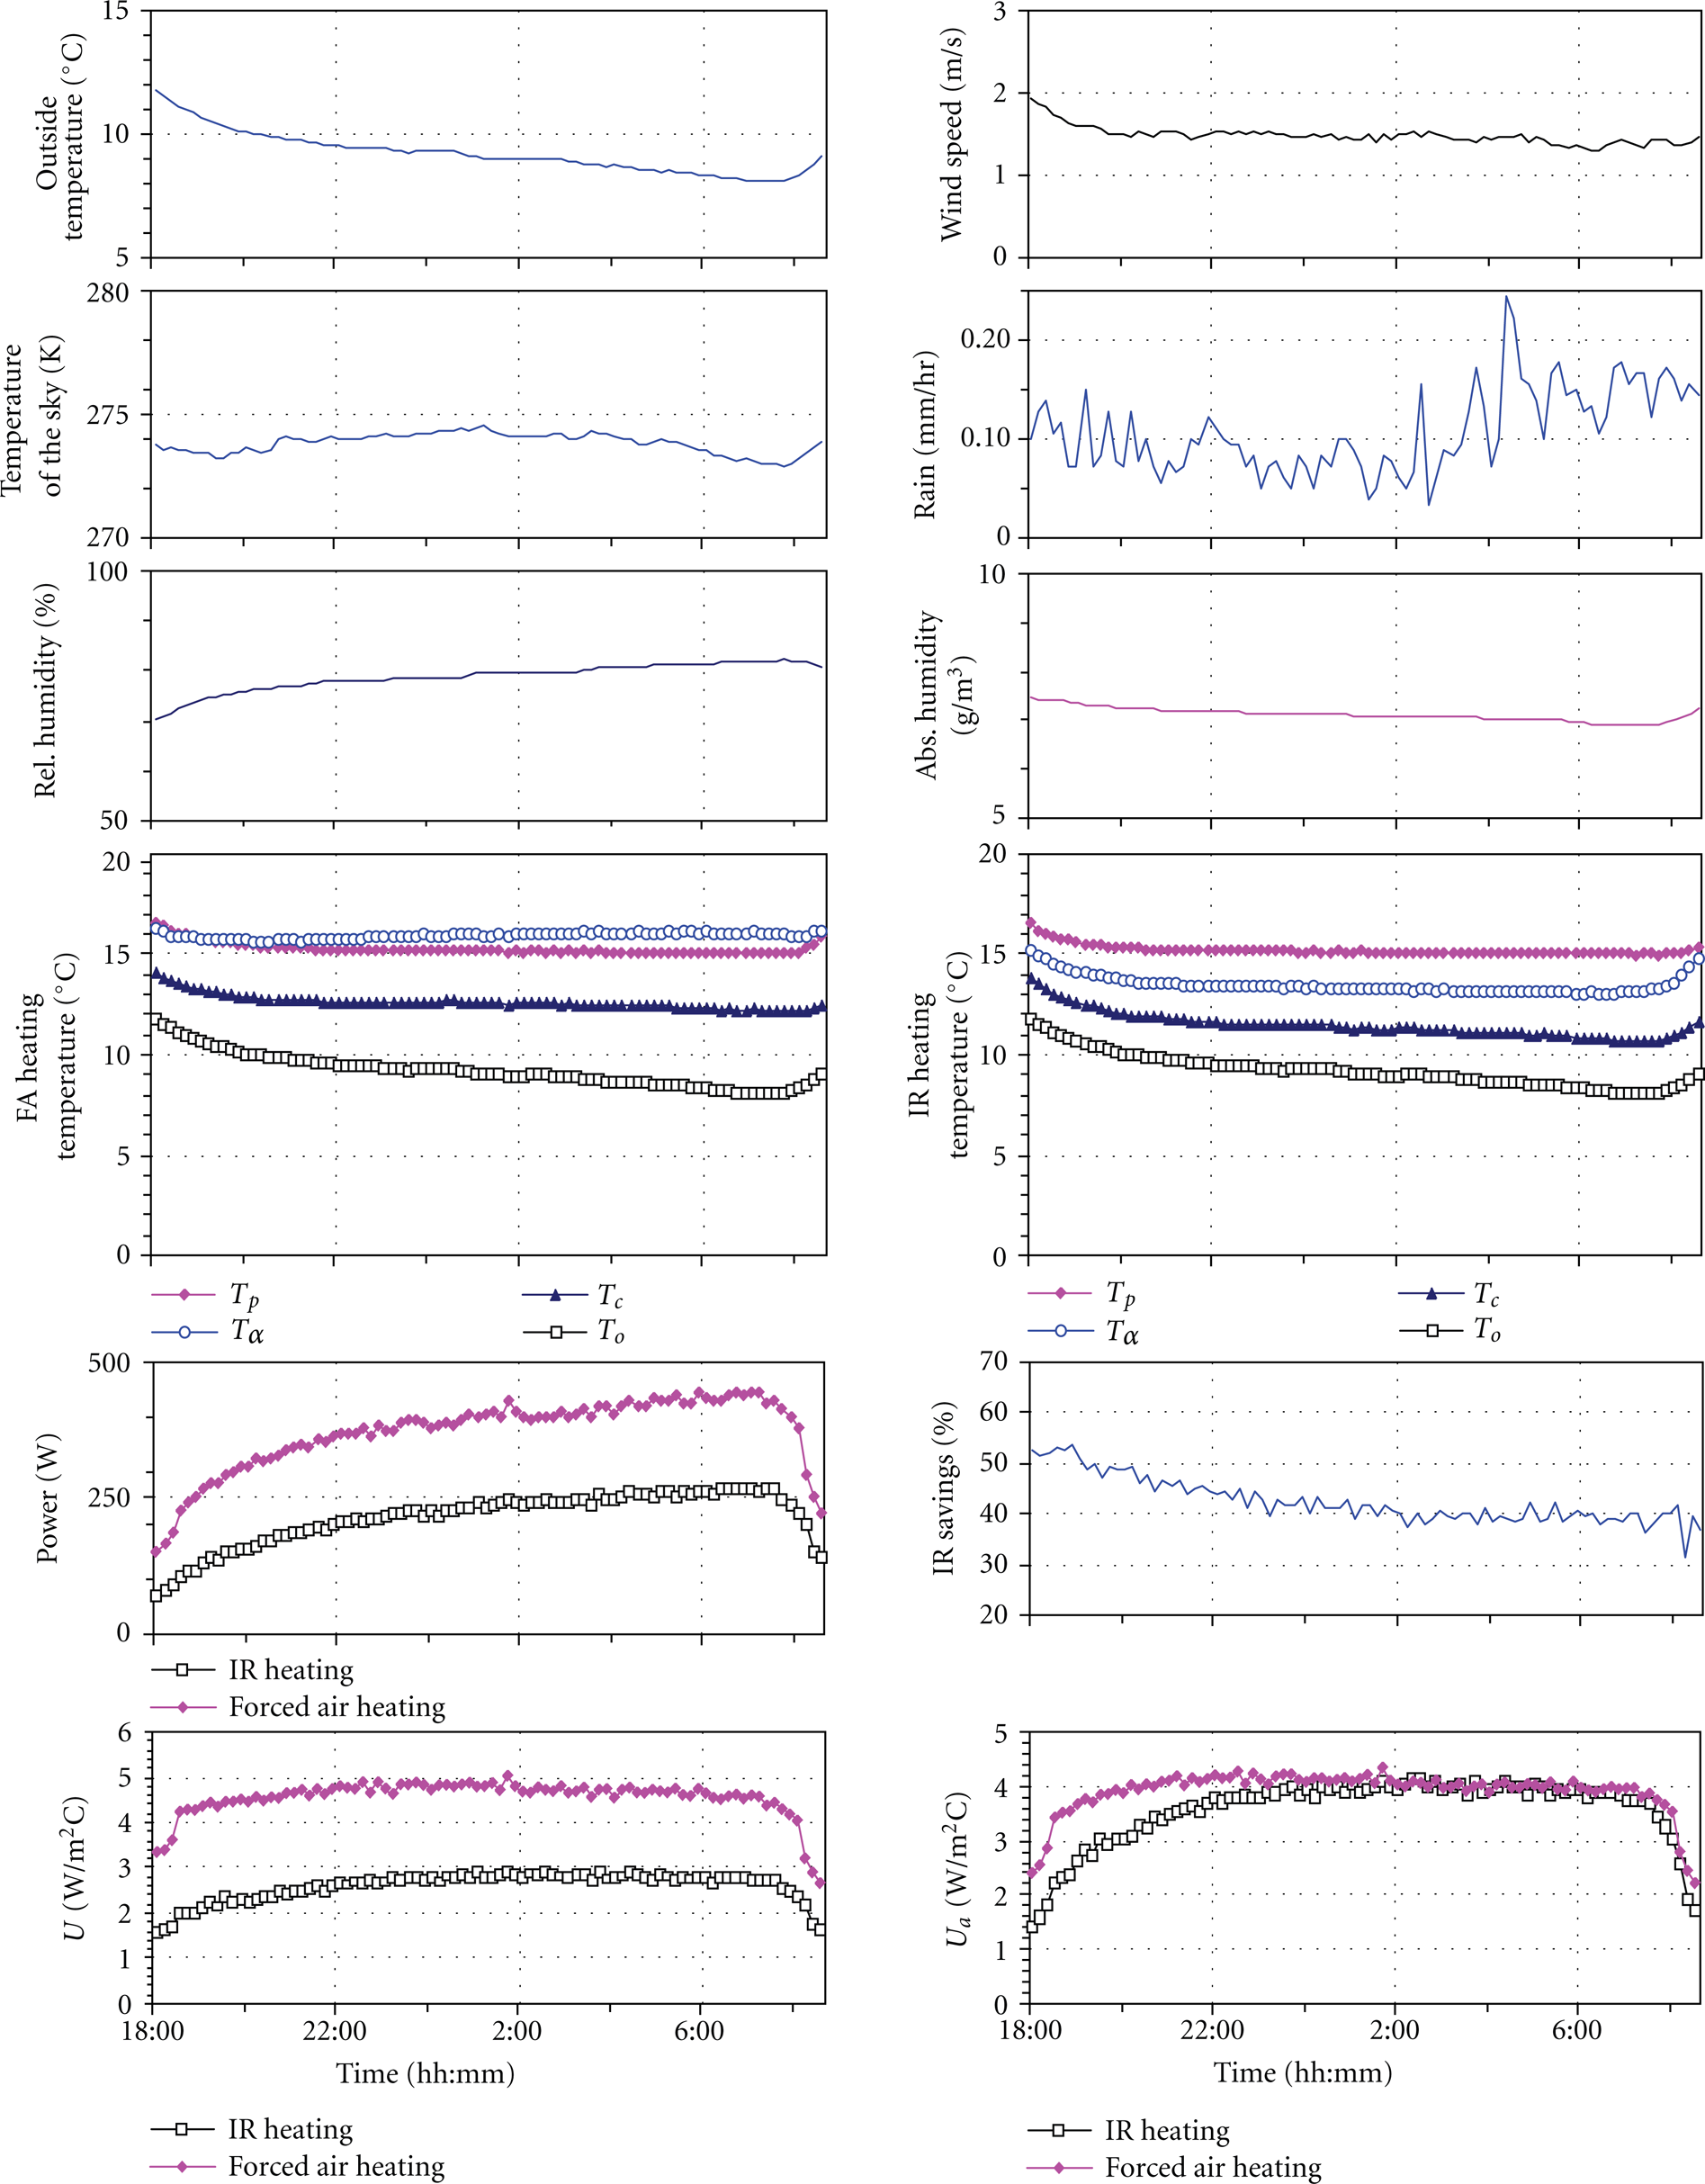
Mean night-time variations of climatic parameters between 18:00 and 09:00 hr.
Temperature results for the forced-air- (FA-) heated greenhouse indicate that the reference temperature, T p , at the canopy was successfully kept at 15°C. To compensate for the outside temperature decrease, the internal air temperature increases gradually to ∼16.5°C before sunrise, whereas cover temperature is in between the inside and outside air temperatures decreasing slightly during the night.
IR heating also kept reference temperature at the desired value, compensating the variation of outdoor temperature. The inside air remained always cooler than the canopy, its temperature falling with decreasing rate to ∼13°C, providing a clear indication in favor of the IR-heating concept. Cover temperature was also in this case in between the inside and outside air temperatures, decreasing slightly during the night, and taking always lower values than those of the FA-heated greenhouse cover.
The IR savings hinted by the values of the internal air temperatures are verified by the power consumption of the two systems. The power consumption graphs can also be used for estimation of the total energy needs of the greenhouses for the entire heating period. The IR savings are close to 50% just after sunset, decreasing after 22:00 to around 40%. This difference in IR savings is attributed to the time lag of the soil temperature, due to thermal inertia. Therefore, the lower air layers and the reference thermometer are kept at relatively higher temperatures as the bulk greenhouse air becomes cooler. When the reference temperature drops below 14°C, the conventional system has to reheat the greenhouse air at a temperature higher than that targeted for the canopy, a cost that the IR system does not have to pay.
A nominal overall heat transfer coefficient, U, based on the cover area, and the temperature difference between the value required for the plants and that of the outside air is usually determined to indicate resistance of the greenhouse to heat losses [2, 17–19]:

As shown in Figure 5, this variable is affected not only by the insulation properties of the greenhouse walls and the associated inside and outside heat convection coefficients, but also by the heating system attributes. Therefore the values corresponding to IR heating are significantly lower than those of the FA heating greenhouse despite the identical construction, due to the lower heat losses of the IR greenhouse.
A similar actual overall heat transfer coefficient, U a , expressing the greenhouse wall thermal resistance can be defined on the basis of the actual difference between the inside and outside air temperatures, which constitutes the “potential” driving the heat losses through the greenhouse walls:

The values of U a calculated for the two greenhouses, also depicted in Figure 5, are very close for both greenhouses (especially during the late night hours), indicating that IR heating system savings are primarily achieved by reducing the inside air temperature in the IR greenhouse. It has to be noted that since the equations for the evaluation of both coefficients,U and U a , are steady state equations, they should only be considered as approximately valid for slow varying processes. Despite this fact, the averaged values of U and U a turn out to be important parameters characterizing the thermal performance of the greenhouses as they are also suitable for illustrating the time lag effect during the first hours of the night which has been discussed previously.
As depicted in Figure 5, the transient effects due to the different thermal capacity of the ground and the greenhouse components are indicated by the gradual increase of U and U a during the first half of the night. During the second half when the heat capacities are becoming less significant the values of U are almost constant at 4.8 and 2.9 W m−2 K−1 for the FA- and the IR-heated greenhouse, whereas the corresponding values of U a are the same for both heating systems, equal to 4.0 W m−2 K−1. The advantage of the IR system during the first hours of the night is clearly illustrated in the U a graphs, where its values are always lower than those of the corresponding FA-heated system. The latter system reaches the steady state value of 4.0 W m−2 K−1 significantly sooner than the IR system.
3.2. Greenhouses Thermal Performance Using Night-Time Mean Values
The mean values for each night of the weather variables and the temperatures characterizing the climate in each greenhouse are presented in Figure 6. The mean wind speed was usually close to 1 m s−1 during the heating period and reached at most 5 m s−1 only for a few nights. Absolute humidity ranged between 4 and 9 g m−3and its lowest values may be associated with rather windy nights. Relative humidity was for several nights close to 90% and following the dips of the absolute humidity, in relation also to the outside temperature, reached values close to 50%. Sky temperature ranged between 255 K (during clear, cold nights) and 285 K (taking values close to the outside air temperatures on cloudy nights). The temperature results obtained in both greenhouses are in accordance with the observations discussed for the “average” night. Whereas in both systems the canopy temperature was successfully kept at 15°C the air temperature in the forced-air-heated greenhouse was always higher reaching in some cases values close to 2°C over the canopy temperature, especially on cold nights. The air temperature in the IR-heated greenhouse was always lower than the canopy temperature and the difference was increased during cold nights. The cover temperature in the case of the IR-heated greenhouse was usually close to the outside temperature, only a few degrees higher. Energy consumption for each night confirmed the advantages of IR heating. The corresponding savings varied between 38 and 52% with a mean value around 43%.

Mean night-time variations of climatic parameters over the 70-day measurement period.
Estimates of the overall heat transfer coefficients, U and U
a
, using average values for each night are also presented in Figure 6 for all the nights considered. The values of U corresponding to the IR-heated greenhouse follow the same variations as those of the forced-air-heated greenhouse, being lower by on average 43%. The average values for all nights are UIR = 2.9 W m−2 K−1 for the IR-heated greenhouse and UFA = 5.0 W m−2 K−1 for the forced-air-heated one (corresponding standard deviations 0.8 and 1.3, resp.), in agreement with previous comparable estimates [2, 17–19]. The corresponding values of actual heat transfer coefficients, which follow similar variations are
An interesting observation is related to the last 5–7 nights of the heating period when the inside air temperature in the IR heated greenhouse was consistently closer to the targeted canopy temperature than in the rest of the heating period despite the low outside temperatures (0.5–1.0°C higher than nights with similar climatic conditions). These nights correspond to the last stages of the lettuce growth, which are characterized by fast growth of the leaf area [20] increasing the depth of the canopy, and the reference thermocouple was covered by several layers of leaves. The heating system operation strategy using as reference the temperature under the lower leaves was the same during these days, since this was considered to be the safest option for the growth of the plants. Despite the larger internal air temperature, IR savings during the last nights were similar to those achieved over the rest of the heating period resulting in values close to 43%. These positive results (which have to be considered as preliminary since they do not refer to a statistically significant sample) indicate that in greenhouses with taller plants and denser canopies a similar range of IR heating savings may be expected.
3.3. Thermal Performance and Night-Time Variation during Specific Winter Nights
Measurements of outside and inside conditions along with variables related to the energy losses of the greenhouses, which were collected during specific nights and provide further insight to the comparison of the two heating options, are presented in Figure 7. The values are 10-minute averages, measured from sunset to sunrise. In these graphs, the power consumed by each system was calculated as the product of the actual power consumption of the heating system and the number of integer minutes it was turned on during the ten-minute averaging intervals. Since the canopy temperature did not present large variations from the targeted value of 15°C in either greenhouse, the heating strategy using one minute intervals proved to be adequate. On the other hand, the power measurements obtained in this way had a low resolution, and, therefore, the power curves in Figure 8 present stepwise fluctuations. Similar behavior is observed for the variables derived from these measurements, such as the IR system savings and estimates of the total heat transfer coefficients U and U a .

Typical night-time variations of climatic parameters for four different nights.

Temperature differences of the parameters using average values of every 10 minute period are indicative of the overall heating losses for IR and forced air heating.
The graphs presented in Figure 7(a) correspond to night number 3, a rather cold, clear and, windless winter night (mean values of outside temperature T o = 3.2°C, sky temperature Tsky = 260 K and wind speed WS = 0.38 m s−1). During this night, outside temperature followed the general trend gradually decreasing from sunset to sunrise with a diminishing rate. A large decrease from 9 to 0°C was observed that presented a plateau close to the minimum value between 5 : 30 and 7 : 30. Moreover, during this particular night short-period fluctuations with a period of 1 hr and amplitude ∼4°C were observed, correlated with corresponding fluctuations of the sky temperature, followed by time delay peaks of the wind speed, which remained always lower than 1 m s−1. The general trend of the sky temperature indicates a gradual decrease during the night from 263 to 257 K, similar to that of the outside temperature. No precipitation had been recorded during this night and the absolute humidity had a small continuous decrease from 5 to 4 g m−3, whereas relative humidity increased (and also showed some fluctuations) following corresponding changes of the outside temperature, T o .
Temperature results for the forced-air- (FA-) heated greenhouse indicate that the reference temperature, T p , was successfully kept at the desired value 15 ± 1°C and the internal air temperature at the measuring location always remained at a slightly higher value from the targeted canopy temperature value, reaching gradually a 2°C difference around 7 : 30 in the morning. The experimental observations justify the usual assumption of equal canopy and inside air temperature in a conventionally heated greenhouse. Furthermore the results show that temperature stratification has been adequately alleviated thanks to the horizontal fan.
The IR heating system was proven equally successful in keeping the reference temperature at the desired value, despite the outdoor temperature variation. Inside air remained always 2–5°C cooler than the canopy, providing a clear indication in favor of the IR-heating concept. It was further observed that, as the outdoor temperature dropped, the inside air temperature followed in the same direction. The cover temperatures T c were lower than the reference temperature in both heating systems, significantly (5–10°C) in the infrared-heated greenhouse, staying closer to the outside temperature, particularly during the first hours of the night. Cover temperatures in both systems followed the short-period fluctuations of the outside temperature.
The power consumed by the IR-heated system was always significantly lower than that required by the FA-heated system and the corresponding savings fluctuated between 30 and 55% with a mean value of 43%. Correspondingly, the nominal total heat transfer coefficient, U, of the IR system was significantly lower than that of the FA system, whereas the actual coefficients, U a , fluctuated due to wind speed variations and the transient effects of the outside temperature variations, attaining almost similar values for both systems during the late hours of the night as already discussed.
Results associated with the small period fluctuations of the outside temperature (red-dashed lines in Figure 7) indicate that the IR heating system needed to respond quicker to abrupt outside temperature drops, consuming energy quicker to compensate the temperature decrease. The FA heating system on the other hand presents a larger hysteresis probably due to the heat stored in the greenhouse air that delays the effect of the outside temperature drop to the reference thermocouple. This hysteresis results temporarily in a drop of the IR efficiency that is recovered in the mean since the FA heating system also has to compensate the increased heat losses.
The weather conditions and the data of the greenhouse performance for the night number 14, a windy night with significant rainfall are presented in Figure 7(b) (T o = 7.2°C, Tsky = 278 K, WS = 4.79 m s−1). Despite the rather high outside temperature, inside temperature of the FA-heated greenhouse is 2–3°C higher than the reference temperature and both U an U a attain relatively high values due to high thermal losses associated with the high wind speed. The difference in the response of the two heating systems to the weather conditions, mainly the fluctuations of the wind speed, are clearly demonstrated by the differences in the energy consumption curves and the corresponding fluctuations of the IR system savings. Sensitive indicators of these trends are the total heat transfer coefficients U a which fluctuate in a different way for the two systems.
Night number 53 (T o = 3.1°C, Tsky = 272 K, WS = 1.15 m s−1), whose data are presented in Figure 7(c), is one of those presenting the lowest IR savings. In addition, it illustrates not only the impact of the wind speed high fluctuations but also the effect of sky temperature significant variation. Unfortunately, the 1 kW power setting used during this night for the FA heating system proved insufficient to keep the reference temperature within the appropriate range especially during a probably cold, high speed wind gust followed by an abrupt drop of the sky temperature around 3:00 o'clock. During this incident, the IR savings reached low values.
The last night included in Figure 7(d) is one of the last nights of lettuce growth already discussed (no. 68, T o = 5.5°C, Tsky = 263 K, WS = 0.53 m s−1). Although inside air temperature in the IR-heated greenhouse is clearly higher than during nights with similar conditions during the earlier stages of plant growth, the consumption of the IR system is relatively low maintaining good IR saving performance through the night. Correspondingly the values of U a , IR, remain relatively small.
The merit of IR heating is to a large extent related to the ability of the system to maintain the desired canopy temperature, while the greenhouse air is at a significantly lower temperature. Data shown in Figure 8 refer to average values of all 10-minute intervals measured during all nights of the heating period. The difference between inside and outside air temperatures for both heating systems, (i.e., the actual potential for the heat losses), are plotted versus the difference of the targeted plant canopy temperature (15°C) and the outside air temperature (i.e., the corresponding nominal design potential). The diagonal represents the limit at which the actual potential is equal to the design potential. Both IR and forced air heating data are reasonably well fitted by straight lines passing from the origin, implying a proportionality relationship. The advantage of IR heating is clearly demonstrated: the inside air temperature is always lower for IR heating compared to the reference temperature indicated by the diagonal whereas the forced air heating values are always slightly above the diagonal. Comparison of the slopes of the two fitting lines indicates an advantage in energy savings of approximately 39% in favor of the IR system. For large
Figure 9 is similar to Figure 8 depicting the same parameters for each night's average values for both heating systems. Again forced air heating results fall above the diagonal, while those of the IR-heated greenhouse were significantly lower indicating the IR heating potential benefit. The slopes of the fitting curves are almost the same as for the corresponding curves of Figure 8. In Figure 9, the nights corresponding to the last days of the heating period can be easier identified and have been marked with an ellipse on the graph. Despite the small number of these results, it is rather clear that the difference between the inside and outside air follows different trends in IR heating in the presence of dense foliage.

Temperature differences of the parameters using overall night-time average values indicative of the overall heating losses for IR and forced air heating and achieved energy saving.
The direct comparison of energy consumption of the two heating systems presented in Figure 10 indicates a consistent linear behavior (with a remarkably high R-squared value). Energy savings deduced from this curve are in excellent agreement with the actual savings achieved during the heating period. Total energy consumption for both systems has been calculated on the basis of the consumption of each night estimated by summation of all the integer minutes of operation for each system. This procedure estimated the total energy consumption as 580 kWh for the forced-air-heated greenhouse and 333 kWh for the IR heated one, resulting in overall savings of the IR system equal to 43%. These estimates are within 1% of the corresponding energy consumption measurements obtained by the wattmeters.

Direct comparison of energy consumption of the two heating systems.
3.4. Dependence of IR Savings on Climatic Conditions
The statistical dependence of IR heating savings (Figure 11) and the corresponding dependence of the actual total heat transfer coefficients, U
a
(Figure 12), on the climatic and weather conditions is investigated next based on the average values for each night. In the graphs depicted in Figures 11 and 12, linear fitting curves are used to indicate possible dependences. Despite the rather small correlation, indicated by the low R-squared factor, Figure 11(a) probably indicates a weak dependence of the IR savings on the outside temperature in the current results. The savings seem to decrease slightly for lower outside temperatures, and linear regression analysis indicates a 0.4% reduction for every 1°C decrease of the outside temperature. It has to be noted that this trend may be at least partly attributed to the erroneous estimation of the savings during nights when the FA heating system was not able to provide the necessary heating to the canopy, as already discussed. In Figure 11(a), similar dependence of the IR savings on the sky temperature and the absolute humidity (relative humidity, not included in the graph, presents a lower R-squared factor) is also indicated, but these parameters are anyway correlated with the outside temperature (if the dependence on the outside temperature is taken into account by a simple linear relation then the
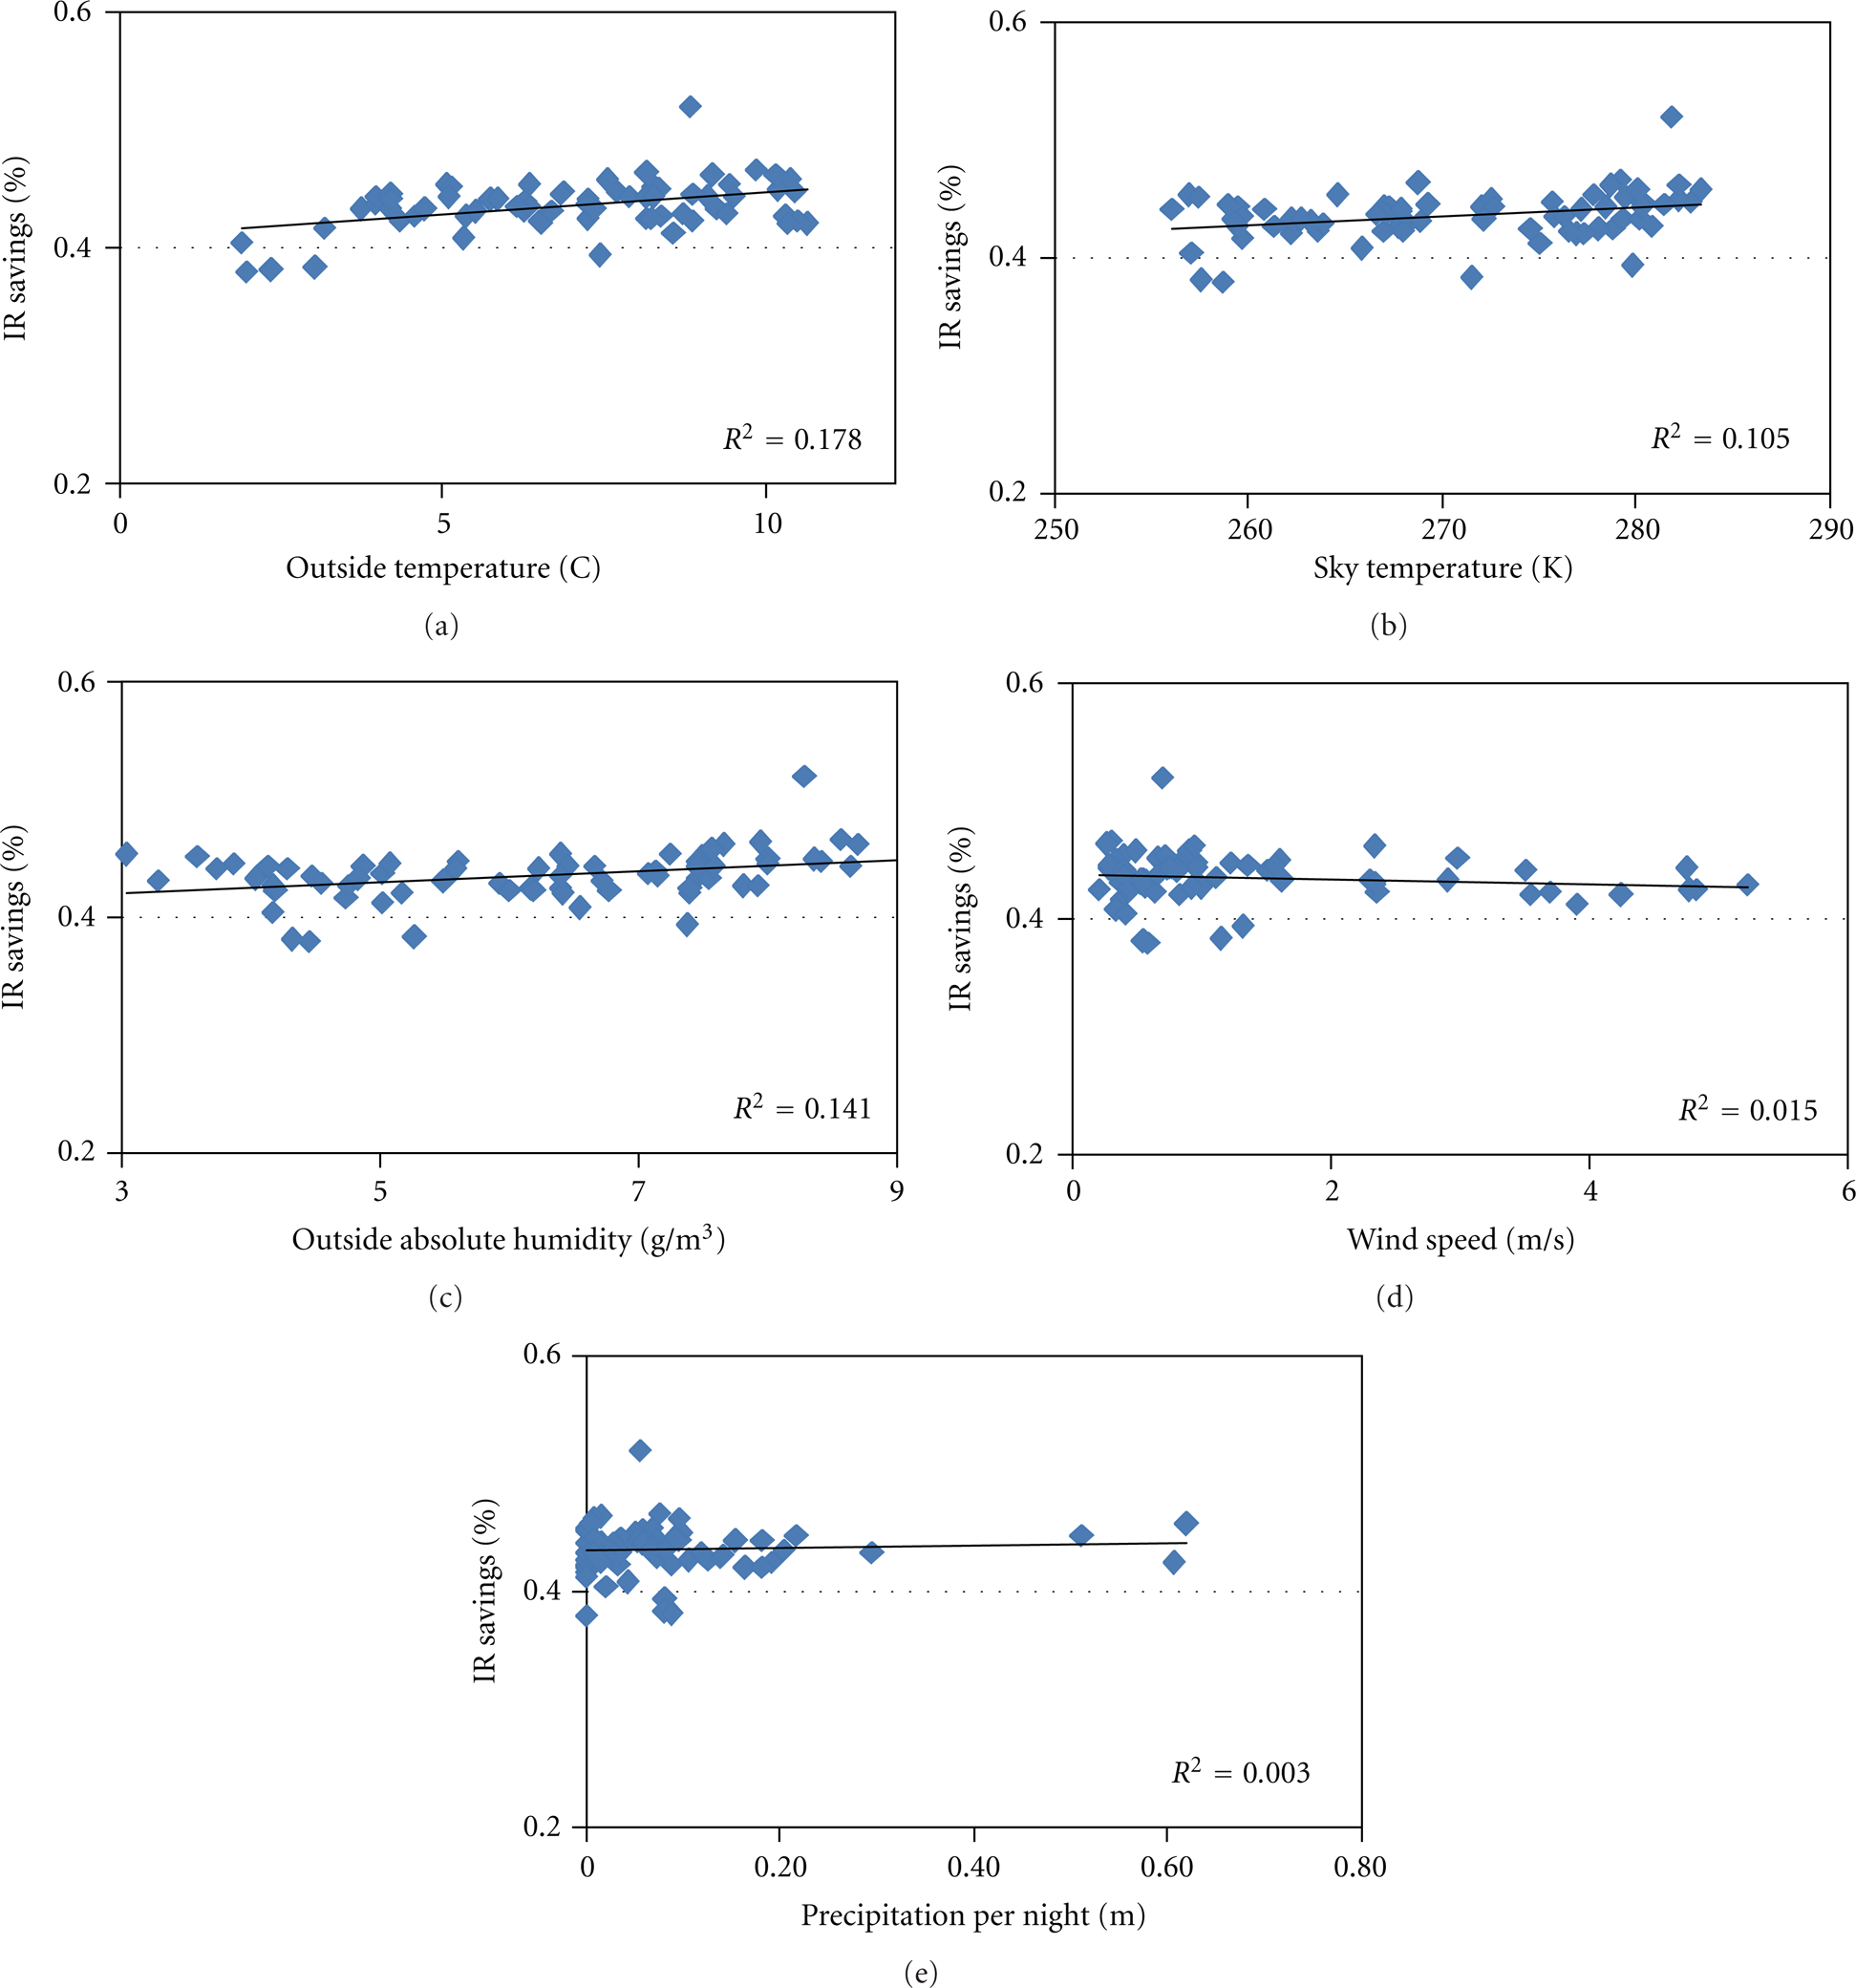
IR savings dependence on climatic conditions.

Actual overall heat transfer coefficient, U a , dependence on climatic conditions.
The results presented in Figure 11 further indicate that although heat losses increase with the wind speed, the latter has a negligible effect on the IR savings for the experimental greenhouses used in this work. This conclusion is contradicting a previous result of the authors obtained with use of a mathematical model developed for the numerical simulation of the experimental greenhouses [13]. This divergence should probably be attributed to the model assumption that infiltration increases proportionally to the wind speed. Although a dependence of infiltration on wind speed is reasonably expected, the solid construction of the presently used experimental greenhouses is probably defying the strong assumption used in the model.
The statistical dependence of the actual overall heat transfer coefficient, U a , on the weather and climatic conditions is presented in Figure 12 to demonstrate the suitability of U a to be utilized as a common mean variable evaluating the thermal resistance of a greenhouse when either FA or IR heating is used. The results in Figure 12 indeed indicate that the values of U a corresponding to the two heating options are well correlated attaining similar values and showing similar trends with the variation of the weather variables. As expected, U a as an overall heat transfer coefficient, besides its dependence on the wall material properties, is also a function of the outside wind speed and the sky temperature, although the results collected in this investigation are not suitable for defining the exact functional form. An interesting observation is that U a also depends strongly on the outside relative humidity (the R-squared value for the absolute humidity is significantly lower). This dependence, which may be related to latent heat transfers as well as to condensate accumulating effect on the wall surface, also has to be taken into account in the estimation of U a .
4. Estimation of Expected Savings in a Full-Scale Production Greenhouse
The positive results obtained in this experimental campaign have to be verified and demonstrated in full-scale production greenhouses, a task which is included in the short-term plans of the authors. Available technology already seems to provide the means for efficient implementation of an IR heating system in a commercial greenhouse. Problems associated with the spatial heterogeneity of current IR heating systems based on fire burners can be reasonably resolved with a design principles reconsideration taking into account the spatial distribution of the radiative fluxes in conjunction with the reflector design. Care should be taken so that shadowing effects of the IR sources do not reduce the global solar transmission during the day affecting negatively the crop productivity. Since the results obtained from the current experimental installation, that was forced to use a high lamp density (1 lamp per m2) to achieve a uniform canopy temperature, do not indicate any shadowing impact, it can be reasonably expected that correct selection of higher power density heaters (either gas fired or electrical) similarly will not introduce any shadowing impact in full-scale greenhouses. Currently the installation cost of an IR heating system based on gas fired radiators in Greece is around 10% more than the corresponding forced air gas fired system. Actual energy saving in the order of 30% would depreciate this installation cost difference in less than five years. Although, as already mentioned, currently electricity is not the preferred option for greenhouse heating, the technology is already available for energy efficient implementation of an electrical IR heating system in a full-scale greenhouse. The breakeven point for this technology to also become economically viable may not be very far away, given the current trends and the will to achieve clean energy solutions.
To estimate the expected energy savings from infrared heating technology in a full-scale commercial greenhouse, the mathematical model developed in a previous work is used [13]. The model is based on a set of two equations representing the energy balance of the greenhouse air and cover, respectively, used for the estimation of the respective temperatures. The total heat losses including convection to the soil, Q1, infiltration losses, Q2, and convection, Q3, and radiation, Q4, losses from the cover are calculated based on the temperature estimates. A four-span greenhouse (span width 9.60 m, length 100 m, gutter height 4.00 m and ridge height 6.50 m) is considered of total floor area (Ap) 3840 m2, cover area (Ac) 5533 m2, and volume (V) 2016 m3. Greenhouse air, cover temperatures and energy losses have been estimated for desirable canopy temperature 15°C and outside temperature in the range −6–10°C, assuming a wind speed 1 m s−1.
Figures 13 and 14 depict total heating needs predictions of the production and the experimental greenhouses when either FA or IR heating systems are implemented, along with the night average values of the actual measurements in the case of the experimental greenhouses. The predicted overall savings of IR heating for both systems, along with the savings corresponding to each particular component of the energy losses are presented in Figure 15. Convection to the soil, Q1, is the same for both heating systems since temperature close to the ground has to be kept the same (the possible benefit of an IR system which is designed to avoid unnecessary heating of ground with no plants—corridors, and so forth—or even better the use of hydroponics or aeroponics cultivation not in touch with the ground is not taken into account in this derivation). As shown in Figure 15(a) for the production greenhouse the savings related to infiltration are constant at about 31% of the infiltration losses of the FA-heated greenhouse, indicating a proportional reduction of

Predicted energy losses in productive (commercial) greenhouse using (a) forced air (FA) and (b) IR heating.

Predicted and actual energy losses of experimental greenhouses using (a) forced air (FA) and (b) IR heating.

Predicted energy savings using IR heating for the components and the total of the heat losses for (a) the production and (b) the experimental greenhouses.
5. Conclusions
The day-to-day comparison of the IR heating system performance with that of a conventional one in the twin greenhouses used in this study provided results supporting the advantages of IR heating. More specifically, whereas both heating systems have proven successful in keeping the canopy temperature at the desired level, the IR system resulted in inside air temperatures lower than the value targeted for the canopy, while the conventionaly heated system resulted in inside air temperatures always higher than the target. As a result of the above difference in inside-air temperature, savings of 43% have been measured for the entire heating period, whereas savings averaged either for specific time intervals during the night or for individual nights, range between 38 and 50%.
The IR-heated greenhouse benefits from the thermal inertia of the ground, which cools slower than the outside air at the beginning of the night, as indicated by increased energy savings during these hours. In general, the two heating systems showed a different response to changes of the weather conditions.
The IR system savings seem to be slightly dependent on outside temperature. Regression analysis indicates a 0.4% savings reduction for every 1°C decrease of the outside temperature. On the other hand, wind speed does not seem to have an effect on the comparative IR system efficiency. A total actual heat transfer coefficient, U a , may be defined for overall heat losses estimation. The coefficient U a attains similar values for the two greenhouses operating with FA and IR heating and depends, apart from the structure and covering material properties, on the wind speed and to a lesser extent on the sky temperature. An interesting observation is that U a also depends strongly on the outside relative humidity, affected by the latent heat transfers and the effect of condensate accumulating on the wall surface.
Data also provide some information regarding the effect of denser canopies. During the final nights of the cultivation, when the lettuce plants grew rapidly, inside-air temperature in the IR greenhouse was not as low as in the rest of the heating period. The available data for the heating needs indicate that this reduction of T α had no effect on the heating savings percentage. The issue has to be further investigated in relation with taller plants and denser canopies.
Implementation of IR heating in a production scale greenhouse has been assessed based on a simple numerical model. The results indicate IR savings in the range 35–41% for outside temperatures from −6 to 10°C. The reduction of the energy saving in the production scale greenhouse in comparison to the experimental greenhouse should be primarily attributed to an increase of soil losses as a percentage of the total, since in the production greenhouse the ground area becomes an increased fraction of the cover area.
In general, all data indicate that infrared heating is a reasonable alternative, with a potential for significant reduction in production cost and environmental impact.