
Abstract
Ubiquitous use of cell phones encourages development of novel applications with sensors embedded in cell phones. The collection of information generated by these devices is a challenging task considering volatile topologies and energy-based scarce resources. Further, the data delivery to the sink is delay tolerant. Mobility of cell phones is opportunistically exploited for forwarding sensor generated data towards the sink. Human mobility model shows truncated power law distribution of flight length, pause time, and intercontact time. The power law behavior of inter-contact time often discourages routing of data using naive forwarding schemes. This work exploits the flight length and the pause time distributions of human mobility to design a better and efficient routing strategy. We propose a Human-Mobility-based Sensor Context-Aware Routing protocol (HMSCAR), which exploits human mobility patterns to smartly forward data towards the sink basically comprised of wi-fi hot spots or cellular base stations. The simulation results show that HMSCAR significantly outperforms the SCAR, SFR, and GRAD-MOB on the aspects of delivery ratio and time delay. A multi-sink scenario and single-copy replication scheme is assumed.
1. Introduction
Cyber Physical Systems (CPSs) [1, 2] are prospective technologies of the next millennium, which encompasses the vision of merging communication, computing and control systems in such a manner that they become almost invisible to layman's life and still enhance their living quality. CPS, are a paradigm shift in the conventional object-oriented thought process. CPS enables many machine-machine, machine-human, and human-human interactions, both in physical and cyber world. CPS-based services such as traffic control, pollution control, automated highways, automatic chemical processes, and power grid control need extensive monitoring in real world. In order to capture physical reality into decision making and controlling aspect, CPS needs to interact with Wireless Sensor Networks (WSNs). However, lack of ubiquitousness of WSN prevents penetration of CPS systems. In such a scenario, cell phones that are now equipped with sensory functionalities such as Global Positioning System (GPS), audio processing, camera, pollution sensors, and accelerometers can be exploited. With the recent transition from the feature to the smart phone, the mobile phone has now extensive sensing capabilities and can work as a mobile sensing device [3]. Moreover, the number of smart phones has been rapidly increasing making cell phones an ideal ubiquitous platform.
Mobile sensing with smart phones has been explored extensively [4–9]. The pollution monitoring application using Cell-Phone-based Sensor Network (CPSN) developed in [10] uses short-range communication outlets such as Wi-Fi or Bluetooth. In this paper, we consider the same CPSN architecture as of [10] shown in Figure 1.
Cell-phone-based sensor network.
CPSN has many challenges such as volatile topology, limited buffer space and loose connectivity with neighboring nodes. Data gathering protocols used for traditional WSN are ineffective due to aforementioned issues. Albeit the cell phone user's mobility, enables a CPSN node to come in contact with other node and create opportunities to encounter any useful forwarder which can get their messages closer to its intended destination even in the absence of an end-to-end path [11]. CPSN can exploit these human interactions opportunistically to route the data to the sink or Base Station (BS). We assume CPSN as a type of delay-tolerant, intermittently connected, or opportunistic network [12–14] where end-end path is not available.
The common approach for data gathering in opportunistic sensor networks is directed transmission, where data is delivered to the sink when it is in its direct proximity. To be effective this scheme needs multiple sinks [15]. Another is flooding where messages are forwarded in multiple copies hoping to reach at the sink as early as possible. The third scheme is delay and fault-tolerant data delivery scheme (DFT-MSN) [16], where selected nodes are used as a forwarder of data messages. For CPSN environment, it is preferable to use this approach as energy consumption needs to be minimized.
The opportunistic data forwarding approaches [17, 18] identifies certain lead nodes that act as the relay point of communication between nodes and to be effective, they need good connectivity. These routing protocols select their relay nodes in such a way that the data packets are delivered using minimum hops to the destination. Connection and disconnection with destination node or sink, due to mobile nature of cell phone users, decide the protocol's performance. The mobility of cell phone users cannot be controlled, so the need is to select or predict an appropriate relay node, otherwise the overhead of forwarding data to wrong relay nodes will result in high energy expenditure and negate the benefits of opportunism.
Routing is an NP-complete problem, and a significant amount of research focuses on optimal methods for routing nodes in delay-tolerant Networks (DTNs) [19–24]. This DTN network scenario is of unicast transmission where message data are sent between pair of source and destination node, while the CPSN scenario is of convergecast transmission where all message data has common destination. Compared with DTN, new opportunities exist in CPSN for relay selection due to increased node density. Furthermore, the human mobility patterns show specific human walk characteristics; namely, truncated power law distributions of flight length and pause time [25]. Given this mobility pattern, it is possible to relay or route more intelligently and design a better routing method for cell phone environments.
Several methods were proposed for forwarding data in mobile sensor networks. Routing approach named Sensor Context Aware Routing (SCAR) [26, 27] uses prediction technique over the context of a mobile sensor node (such as previously encountered history with sink nodes, energy level of each node, and connectivity difference with neighboring nodes) to forecast the best relay node from the neighboring nodes. It uses Kalman-filter-based prediction approach. SCAR uses a replication scheme by which the master copy of the message is retained in the network till it reaches the sink. Secondary copies, sent to the relays, are deleted if buffer becomes full.
Recently authors of [28] have proposed the scheme named gradient-based routing approach incorporating node Mobility (GRAD-MOB). Performance is improved by predicting relay node based on their relative movement with respect to sink. The node moving away from sink is not preferred as a relay node.
The approach of Scale Free Routing (SFR) [29] improves performance with the use of ballistic nodes as relay nodes. The ballistic nodes exhibit sudden jumps of flight length as per TLW mobility model. Use of these nodes as relays, allows message data to be forwarded from the low to high utility area near sink. Our approach is to prevent nodes from forwarding messages in low utility area with a newly defined utility function.
Motivated by the SCAR and the SFR, we propose a Human Mobility Sensor Context-Aware Routing (HMSCAR) protocol tailored for CPSN architecture with multiple sinks. HMSCAR incorporates two new metrics based on human walk characteristics to predict best relays. The new parameters introduced in our algorithm is based on human walk characteristics; namely, truncated power law distributions of the flight length and the pause time. Use of these parameters is justified for cell phone-based wireless sensor networks as cell phone users exhibit human walk characteristics. SCAR assigns weights to mobile nodes based on metric-like change of connectivity, battery level, and collocation with sink. The newly introduced parameters operate on decision of super flight length and super pause time. A given flight length is super flight or super pause if the flight length or pause time is above certain threshold. The proposed algorithm is compared with SCAR, GRAD-MOB, and SFR using greedy prediction approach where node with highest weight value is preferred as the next relay. Moreover, we evaluate the performance of our algorithm with single copy replication scheme assuming single sink and multisink presence. Single copy replication schemes are basis of multicopy replication schemes. Relay node discard packets if its buffer becomes full.
In each sink or base station initiated round of data collection, the selected relays receive data samples from their surrounding members by 802.11-based Request to Send and Clear to Send (RTS-CTS) mechanism and store them in buffers. The stored data is again forwarded to the selected relays in next round of operation. The relay node uses a bloom filter to compress the data into L bits before it forwards to another relay in the path. Nodes that are in direct connection with the sink will finally send their stored data to it. Use of routing table at each node enables forwarding of message data from lowest utility node to highest utility nodes in each round of data collection.
We have presented the related work in Section 2. In Section 3, we discuss the system model. In Section 4, we introduce a definition of Super Pause Time and Super flight length and propose the HMSCAR algorithm. The performance metrics and simulation setup is described in Sections 5 and 6, followed by the results and conclusion in Sections 7 and 8, respectively.
2. Related Work
There are many approaches proposed for routing in Delay Tolerant Networks (DTN). A detailed survey of all these techniques has been done in [23, 24]. Forwarding strategies of DTN are either epidemic [21, 22] or probabilistic [19]. Epidemic protocols use varieties of replication schemes for reducing packet delay in the network at the cost of energy consumption. The probabilistic methods make smart decisions of packet forwarding so that the packet delivery ratio is increased. It is very difficult to achieve both high delivery ratio and low delivery delay for a given energy and storage constraints [23]. Probabilistic methods leverage on a utility function, which is either destination dependent, destination independent, or hybrid. The SCAR algorithm proposed in [26] is a probabilistic one and based on hybrid utility function. In [30] a content- and context-aware routing protocol (CCBR) for multi-sink scenario is proposed. CCBR provides good delivery ratio with low power consumption. In [31] a history-based routing approach named CHARON is presented, which estimates delivery delay (EDD) at each node and routes the messages towards the sink along decreasing delay gradient. CHARON utilizes EDD as a context parameter, instead of traditional metrics such as relative mobility or sink encounter frequency. It performs better with low-density network scenario. In [32] a DTN protocol called SMITE is proposed for efficient data delivery of data packets to a mobile sink. SMITE outperforms SCAR, DFT-MSN and sidewinder [33] on the aspect of delivery ratio, transmission overhead, and time delay. SMITE uses cluster-based aggregation mechanism coupled with angle-based transmission mechanism to deliver data to the mobile sink.
The authors of [34] propose a mechanism to calculate delivery probability based on node's moving direction, speed, and distance between node and sink. Similar approach called as GRAD-MOB is applied in [28], where in addition to gradient-based routing metric another metric, based on node's moving direction from the sink node, has been added. This algorithm has novelty of incorporating node mobility for DTN networks. All above approaches use either single copy, multi-copy, or hybrid replication scheme. Contrary to this, the authors in [35] has proposed a DTN routing protocol, which uses repetitive contacts and their time sequence. The protocol does not replicate message and hence can work for lower buffer size of mobile nodes.
Human-carried mobile devices have some specific movement patterns in real life. Some of the movement patterns have been studied in [36, 37]. In [11], the effect of human mobility was evaluated on two-hop relaying algorithm, which was proposed in [38]. The authors of [11] have analyzed the performance of two-hop relaying protocol in a network of nodes following power law intercontact time. Result indicates infinite delay if power exponent is greater than two, which is the case of light tail. The delay becomes finite if multicopy replication approach is used.
Authors of [25] have proposed Truncated Levy Walk (TLW) mobility model. The mobility traces generated by TLW with various combinations of levy exponent α and β fit real human walk traces for various outdoor settings. In [29] a Scale-Free Routing (SFR) scheme is proposed based on observation of flight length characteristics of TLW. Some special nodes called ballistic nodes or super nodes are identified and messages are forwarded, if such nodes are available as relays. The SFR claims to achieve lower delivery delay compared to traditional gradient-based utility schemes, which may lead to local minima. SFR approach is generalized and can be applied with any gradient-based scheme. However, authors of [29] have made assumptions of knowing mobility information of ballistic node, which is a strong one, and have proposed secondary means to predict it. Our work is also based on observation of TLW mobility model. We leverage both pause time and flight length distributions of human walk without using secondary means to predict it. Our proposed scheme HMSCAR is based on properties of heavy-tailed data called declining hazard rate and mass-count disparity [39]. We use a threshold-based approach to predict about super flight length or super pause time. Prediction of super flight length is based on declining hazard rate property of heavy-tailed data and that of super pause time is based on mass-count disparity property of heavy-tailed data.
The use of mobile phone for sensing was advocated in [40, 41]. Authors of [42] have used a layered approach for data monitoring application in multihop cell-phone based Sensor Network (MSCN). We propose a cluster-based data-gathering protocol for MCSN and Single-hop Cell-phone-based Sensor Network (SCSN) [43, 44], where the data gathering schemes are designed for nondelay tolerant monitoring application.
3. System Model
Mobility models emulate the behavior of real life mobile user as closely as possible. Truncated Levy Walk (TLW) mobility model proposed in [25] is based on, about one thousand hours of GPS traces, involving 44 volunteers in various outdoor settings. The TLW model captures movement of the people in various outdoor scenarios such as campus area, theme park, fair, and metropolitan area. As the cell phone users exhibit human walk characteristics, we have used TLW model as the mobility model for performance evaluation of HMSCAR.
3.1. Truncated Levy Walk Mobility Model
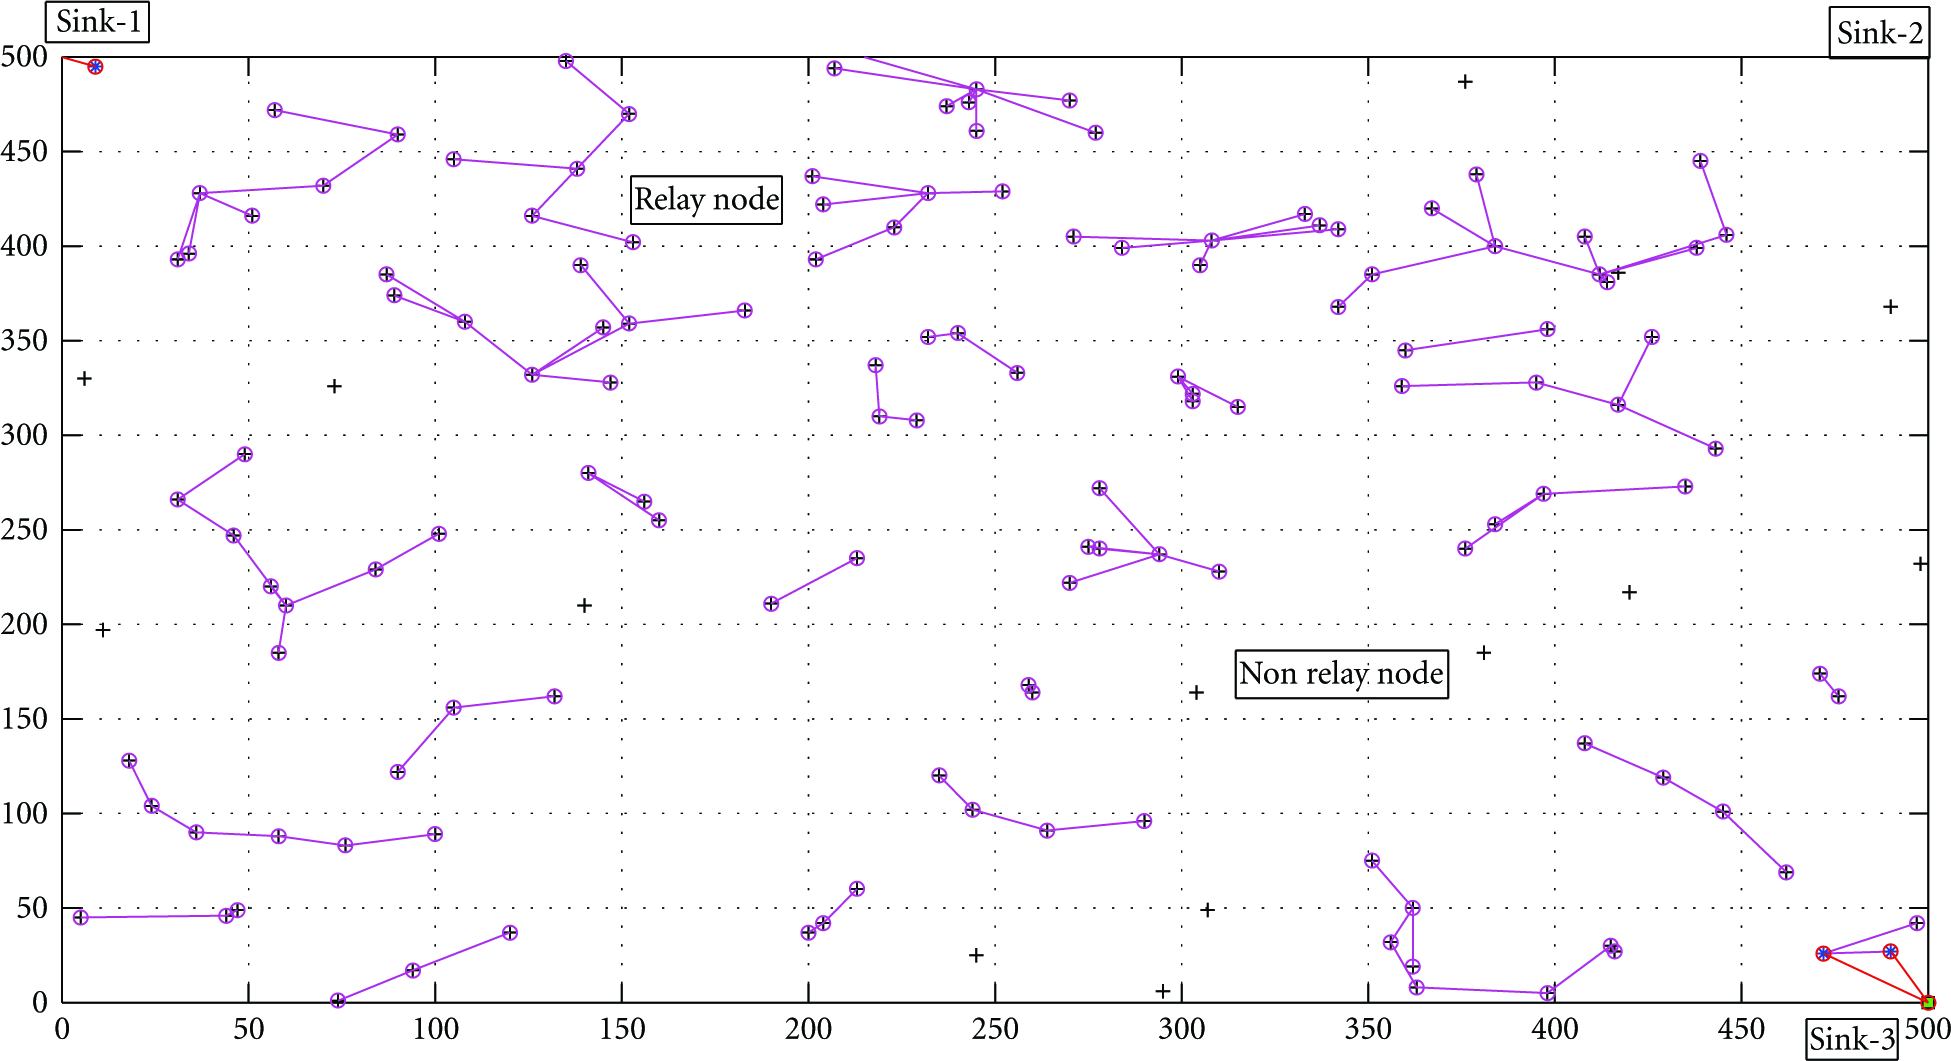
Recent findings of human walk characteristics show truncated power law distribution of flights (straight line trip without directional change), pause times, and intercontact times (the time elapsed between two successive contacts of the same pair of nodes). Figure 2 shows mobility traces of TLW mobility model.

Truncated Levy Walk mobility model's waypoints.
Flight lengths follow a truncated power law
Pause times follow a truncated power law
Turning angles follow a uniform distribution. Velocity increases as flight lengths increase.


3.2. Observations
3.2.1. For Flight Length Distribution
Power law distribution of flight length implies large number of frequent long flights as compared to Gaussian or an exponential distribution. For humans the duration of moves or the distance moved in one “step” (i.e., flight length) is limited owing to physical constraints. This results in truncated power law distribution for human flight length. Heavy tail of flight length implies the declining hazard rate and is captured in terms of conditional expectation [39]
The tail of the flight length distribution may be long or short and is related to the context of the location. Small and/or highly crowded area encourage shorter flights and discourage longer flights; thus the flight length distribution results in a short-tailed distribution. However, with a really large area the truncations will not be excessive. When truncations have less impact on flight lengths, the mobility of the nodes has a stronger power-law tendency [25].

From opportunistic forwarding point of view, node exhibiting large flight length should be chosen as a relay. Based on (3), the concept of “super length parameter” is incorporated in HMSCAR algorithm.
3.2.2. For Pause Time Distribution
Heavy tail of pause time implies the mass-count disparity
For small or crowded area, the truncation will be short tailed. High traffic will prevent the walker from halting at one location for a long time. For really large areas, truncation will be heavy tailed or even long tailed.

The main assumptions made for the system are as follows.
All N nodes are uniformly distributed. The Base Stations (BSs) are located at the edge of the region. Nodes can communicate with neighboring nodes, either using cellular bandwidth or short-range communication outlets such as WI-FI or Bluetooth. Nodes have finite buffer size and operate on limited power supply.
4. Human-Mobility-Based Sensor Context-Aware Routing (HMSCAR) Algorithm
Traditionally the SCAR algorithm is used for Mobile Sensor Networks (MSN). We have modified the SCAR protocol by adding two human walk context metrics called
4.1. Flight Length Parameter
The determination of parameter
4.1.1. Super Flight Length
Given a set U of mobile nodes following the flight length distribution as a truncated power law, then there exists a value ζ for all nodes u of such a subset, that if a flight length is above ζ, then based on (3) all nodes of such a subset again travels that flight length with high probability. Let
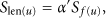
A plot of parameter

Hu parameter with respect to super length count value.
4.2. Pause Time Parameter
The determination of parameter
4.2.1. Super Pause Time
Given a set U of mobile nodes following the pause time distribution as a truncated power law, then there exists a value ξ for all nodes u of such a subset, that if the pause time is above ξ, then based on (4), that subset of node u pauses much more than ξ. We call all those pause above ξ as super pause


A plot of parameter

Count function with respect to super pause counter.
4.2.2. Relay Weight Calculation
The calculation of the delivery probability or relay weight is local, and it does not involve any distributed computation. Nodes exchange information about their current delivery probability and available buffer space, periodically with their neighboring node. This also includes routing information.
At the start of data collection round, each node finds all its neighbors (within transmission range After a certain time

The parameter Each node calculates the remaining battery parameter Each node u summarizes its history of collocation with a sink with parameter Each node finds Each node finds Each host calculates its delivery probability locally, based on observations related to the various context attributes. Our aim is the optimization of the bundle delivery process. To solve this problem, we apply the so-called weights method [26]. The values of these weights are same for every node.

All the nodes calculate their weight value A timer is used to transmit “

4.2.3. Data Transmission
After
4.2.4. Data Reception
The nodes are also waiting for incoming data. If it is a routing message, then it is processed and corresponding routing table entry is updated. If it is a data message, then an ACK is sent and the message is stored in the buffer. Messages are not deleted from the buffer unless they are acknowledged by some relay node or until the buffer becomes full.
4.2.5. Data Collection Phase at Sinks
Nodes will send their entire data to the sink when they arrive within the transmission range of the sink. Sink aggregates the data packets and sends them to the data repository through a wired network.
5. Performance Metrics
We have evaluated the performance of opportunistic routing algorithm based on received data messages or data delivery ratio and message delay. Moreover, the energy consumption and efficiency of nodes are also evaluated.
Number of Received Packets: it is a measure of the reliability, effectiveness, and efficiency of routing protocols. We mainly consider packet drop only due to nonavailability of end-end path. Other sources of packet drop due to collision, queue overflow, channel unavailability, and so forth are ignored. Delay: it is the time between packet generation and packet reception at the sink node or the BS. Energy Consumption: our energy model for the CPSN nodes is based on the first-order radio model described in [46]. A sensor consumes Network Lifetime (Energy Efficiency): the common definitions include the time until the first or the last node in the network depletes its energy. For CPSN, it is defined as the time until an α percent of sensors consume β percent of initial energy, where α is taken as 50 percent and beta is taken as 10 percent.


These parameters are studied for varying buffer size, transmission range, node density, and mobility patterns for single copy replication scheme.
6. Simulation Setup
We measured the performance of our proposed HMSCAR algorithm with SCAR, SFR, and GRAD-MOB on a MATLAB simulator developed to compare the performance of the algorithms. The simulator only simulates the core network characteristics, such as the nodes' connectivity and hello and data message transmissions as these are integral to the understanding of algorithms' behavior. Other details, such as the MAC level protocol, signal propagation, collisions, and realistic channel conditions, are ignored as they have lesser effects. All the algorithms are compared within the same simulation environment making the conclusions unbiased. Further we also assume that there are no obstacles that could limit node mobility or signal propagation.
Due to the importance of connectivity, the weight Simulation-1: a network of 150 nodes, which move in a rectangular area of 500 m Simulation-2: simulation scenario similar to part-1 is considered but instead of multicopy, the single copy replication scheme is implemented and performance of SCAR, HMSCAR, SFR, and GRAD-MOB is compared. Simulation-3: rectangular area of 500 m Simulation-4: here we vary the transmission range of the nodes from 20 meter to 50 meter for rectangular area of 500 m Simulation-5: here we vary the weight values of HMSCAR algorithm to see its effect on performance metrics. The transmission range is kept at 50 meter, and 150 nodes moving in a rectangular area of 500 m Simulation-6: authors of [25] has shown that the realistic human walk traces can be well fitted using TLW mobility model with various combination of α and β. Here we take different combination of β and α for 150 nodes having fixed buffer size of 900 with 3600 seconds of simulation time. Single-copy replication scheme is implemented and performance of SCAR, HMSCAR, SFR, and GRAD-MOB is compared for single-sink and multisink case.
Default simulation parameters.

7. Results and Discussions
7.1. Simulation-1
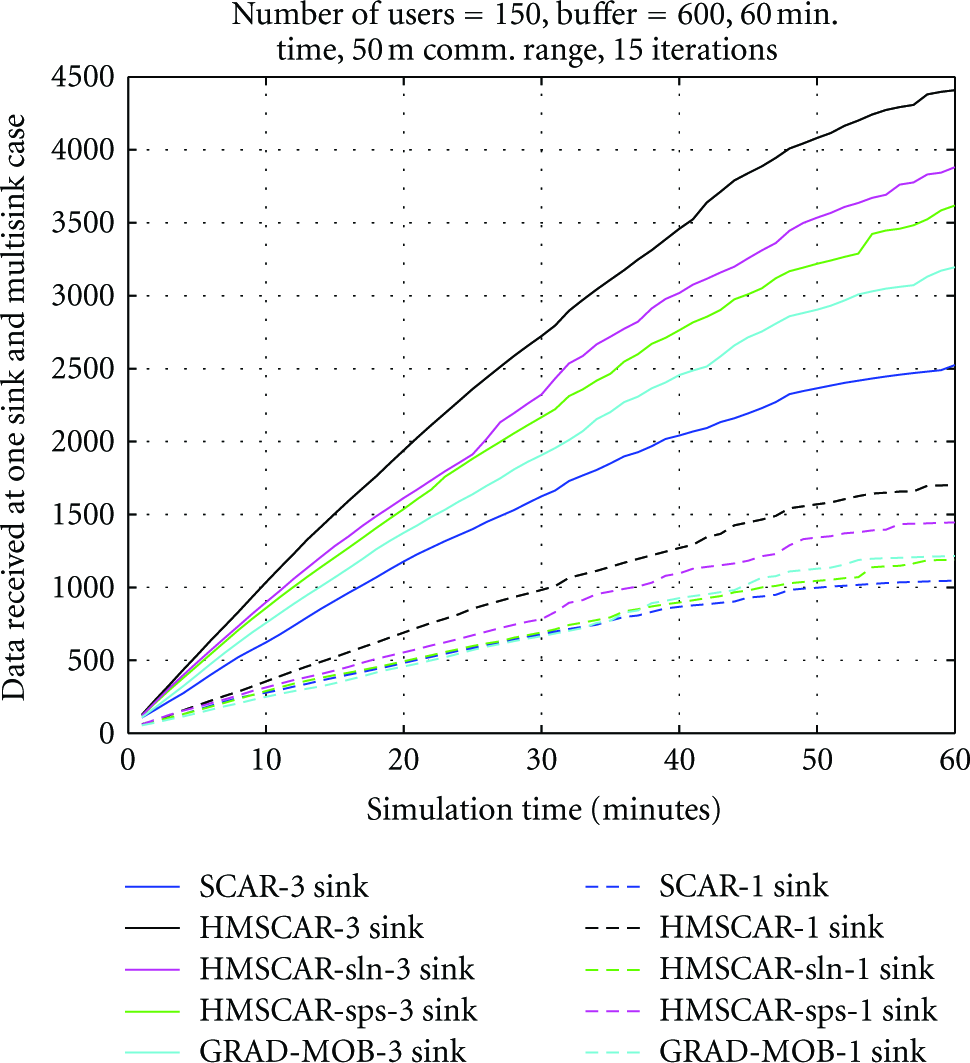
Figure 5 shows number of data packets received for SCAR, HMSCAR, SFR, GRAD-MOB, and HMSCAR-sps algorithms for single-sink and multisink case. The HMSCAR and HMSCAR-sps algorithm performs best among all the five algorithms. Data delivery is improved by 4% compared to SCAR and GRAD-MOB and 3% compared to SFR algorithm for multisink case. Improvement is negligible for single-sink case.

Data received at various sinks versus simulation time.
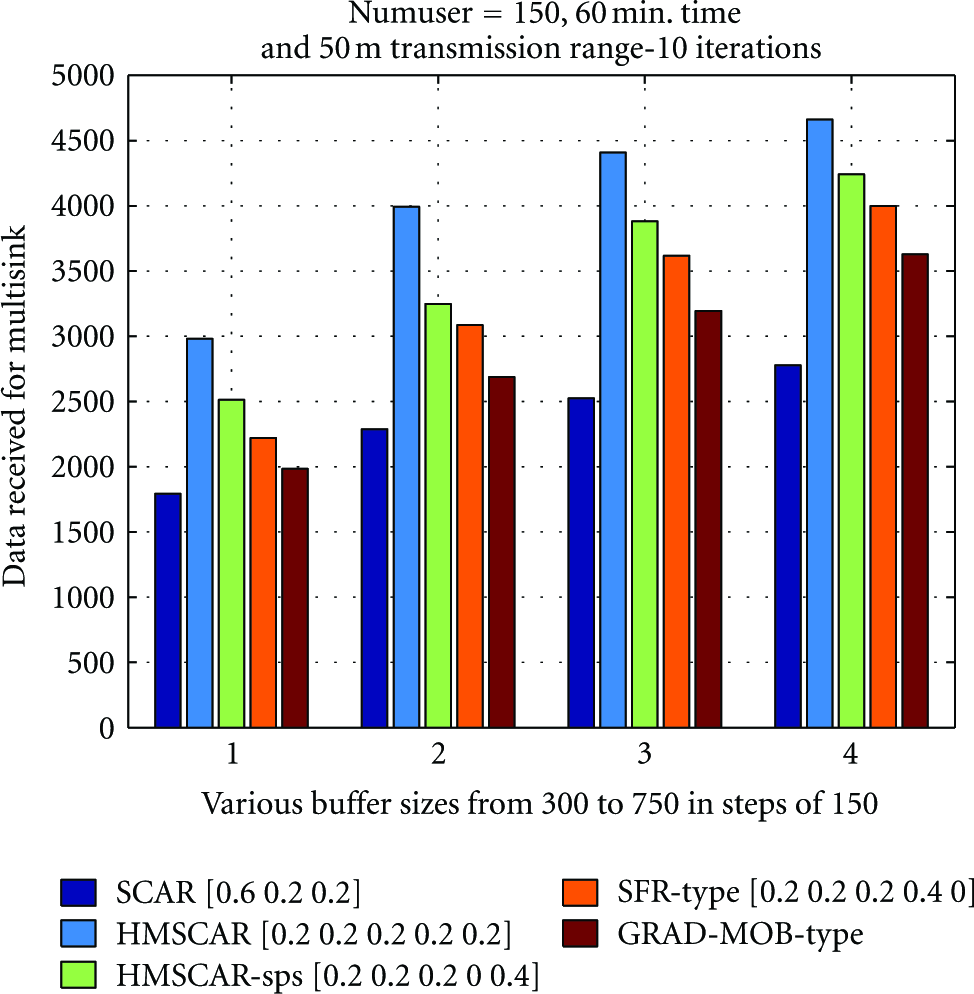
Figure 6 shows the number of packets received for SCAR, HMSCAR, SFR, GRAD-MOB, and HMSCAR-sps algorithms for various buffer sizes. The number of packets received is more for HMSCAR-sps and HMSCAR algorithms compared to other algorithms. HMSCAR has 5% more message delivery ratio compared to SCAR for buffer size of 750 and has 4% more for buffer size of 600.
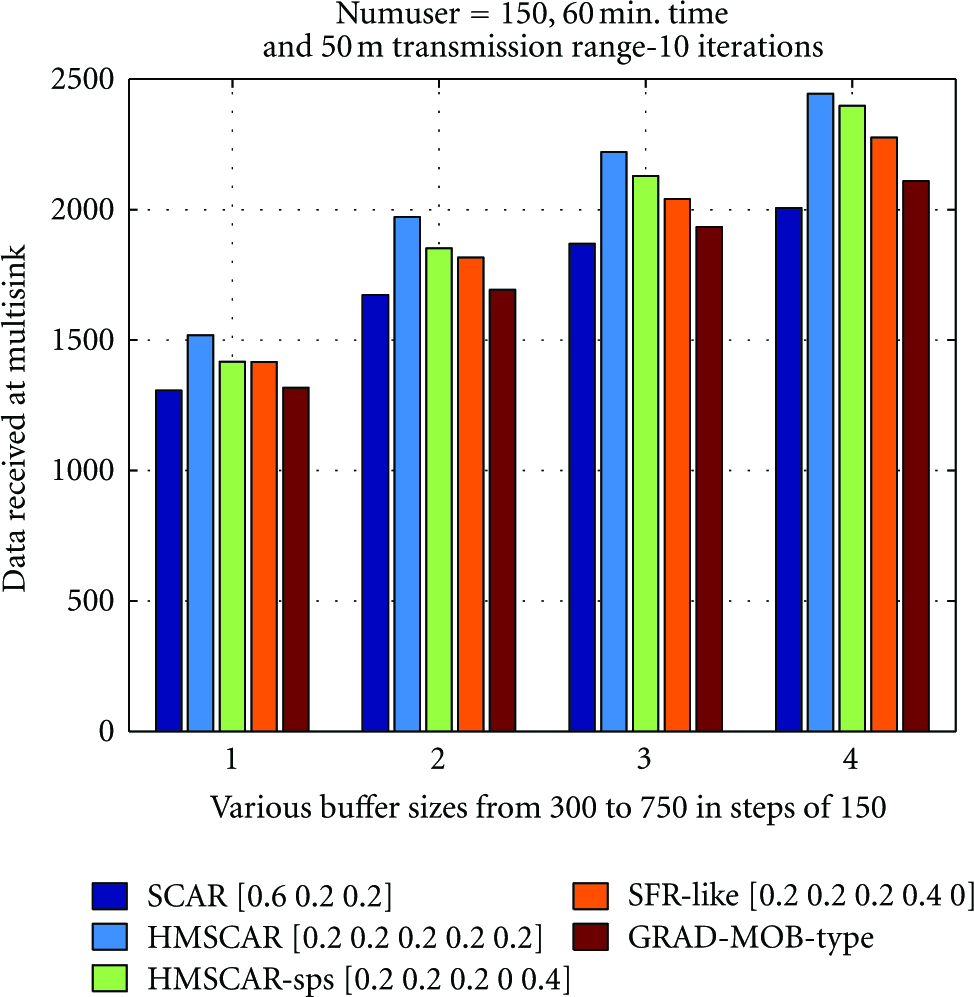
Data received at sinks versus buffer size.
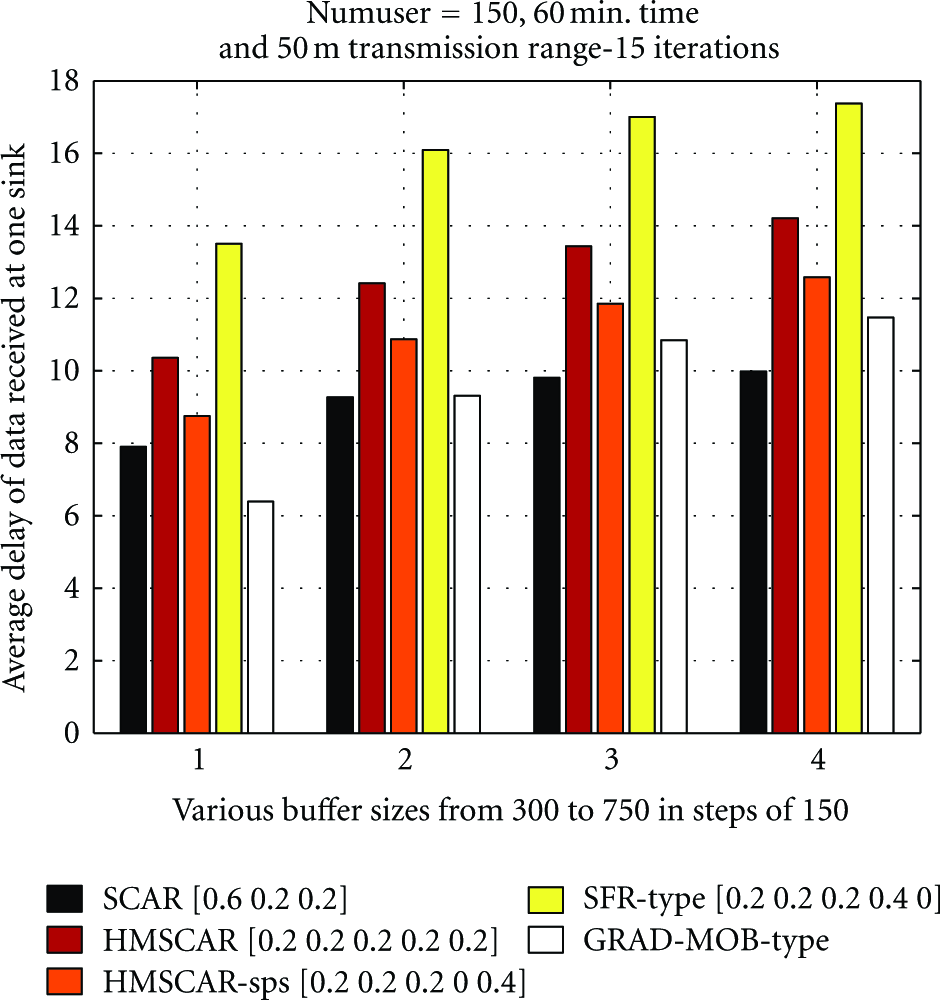
Figure 7 shows the number of packets received for various algorithms at single sink. The number of packets received is more for HMSCAR-sps algorithm for all buffer sizes. SCAR and GRAD-MOB have the least amount of received packets.

Data received at one sink versus buffer size.
Figure 8 shows average data delivery delay of the packets for SCAR, HMSCAR, SFR, GRAD-MOB, and HMSCAR-sps algorithms. Average data delivery delay is least for HMSCAR-sps algorithm as compared to other four. SCAR performs worst across various buffer sizes. HMSCAR-sps's performance decreases at higher buffer sizes. This is due to multicopy approach, which stores redundant data in the buffer.

Average delay of packets at multisinks versus buffer size.
Figure 9 shows average data delivery delay of the packets for SCAR, HMSCAR, HMSCAR-sln, and HMSCAR-sps algorithms. Average data delivery delay is least for HMSCAR, SFR, and HMSCAR-sps algorithms as compared to other two. HMSCAR performs the best across various buffer sizes. SCAR performs the worst among all algorithms.

Average delay of packets at single sink versus buffer size.
Figure 10 shows energy consumption of all the nodes for various algorithms. Average energy consumption increases with increase in buffer size. HMSCAR and its variants have minimum energy consumption compared to SCAR and GRAD-MOB.
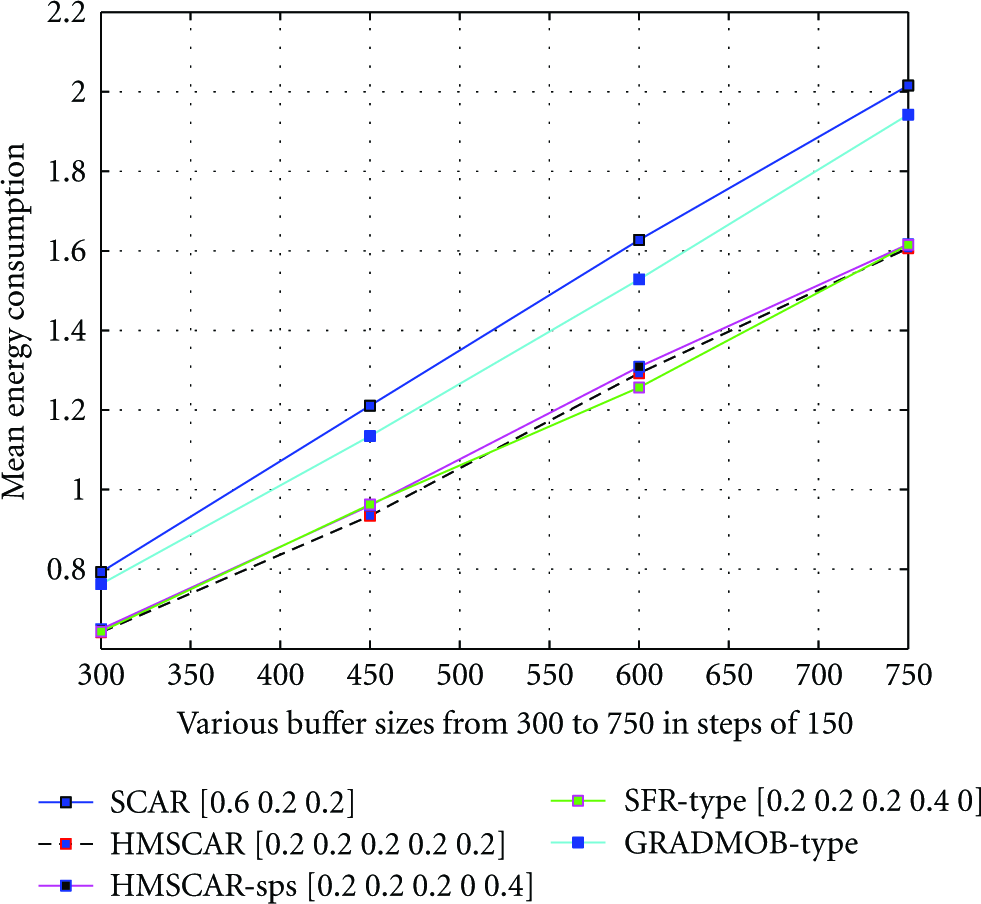
Average energy consumption of nodes versus buffer size.
Figure 11 shows energy efficiency for various algorithms. All the algorithms perform more or less the same. No algorithm has exceptional energy efficiency compared to others. Result shows that HMSCAR performs some what better compared to SCAR and others.
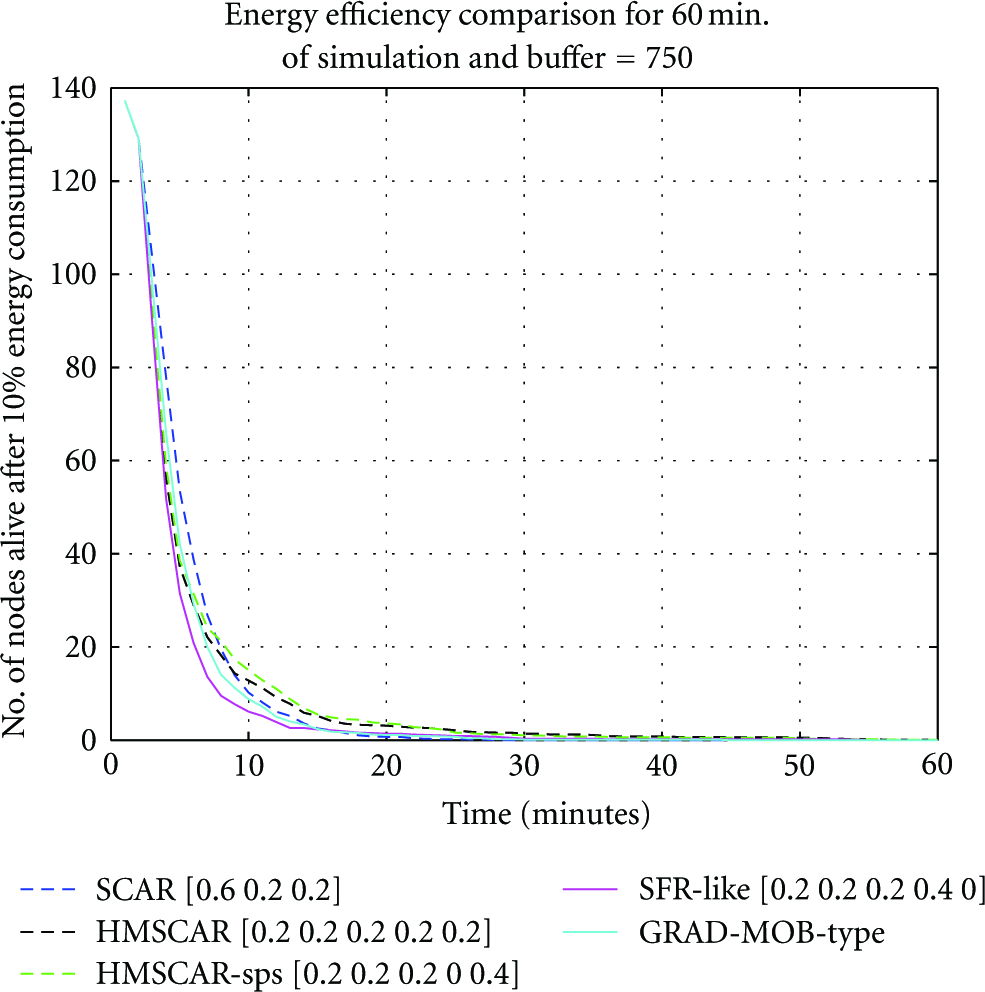
Number of nodes alive after 10% energy consumption.
7.2. Simulation-2
Figure 12 shows the number of packets received at the sink for single-copy replication scheme of various algorithms, with different number of sinks. HMSCAR outperforms SCAR almost 22%, and 15% to GRAD-MOB for fixed buffer size of 600.
Data received versus simulation time for single copy case.
Figure 13 shows the number of packets received for SCAR, HMSCAR, HMSCAR-sln, and HMSCAR-sps algorithms. The number of packets received is more for HMSCAR algorithm. Performance of all the algorithms increases as buffer size is increased. SCAR has the least amount of received packets amongst all the algorithms.
Data received at multisinks versus buffer size.
Figure 14 shows the number of packets received for SCAR, HMSCAR, SFR, GRAD-MOB, and HMSCAR-sps algorithms. The number of packets received is more for HMSCAR-sps algorithm for various buffer sizes. SCAR has least amount of packets received among all the algorithms. Performance of all the algorithms is improved with an increase in the buffer size.

Data received at one of the sink versus buffer size.
Figure 15 shows average data delivery delay of the packets of various algorithms for single-copy replication case. Average data delivery delay of HMSCAR-sps algorithm is the least. HMSCAR and SFR have poor performance for various buffer sizes. Increasing buffer size also increases data delivery delay. Increasing buffer size enables more messages to be delivered, which were dropped earlier due to insufficient buffer space, but now they are able to reside in the buffer long enough to be delivered to the sink. This incurs a larger delay for these messages and, therefor, increases the average data delivery delay.

Average delay of packets received for various buffer size.
Figure 16 shows average data delivery delay of the packets for SCAR, HMSCAR, SFR, GRAD-MOB, and HMSCAR-sps algorithms for single-copy, single-sink case. The SFR performs worst and so is HMSCAR. Performance of SCAR is the best for various buffer size.
Average delay of packets received for various buffer size.
Figure 17 shows energy consumption of data received at all the sinks for various algorithms. The HMSCAR-sln algorithm consumes more energy while HMSCAR-sps consumes least. For HMSCAR-sln, algorithm the nodes making super flight length are preferred as a relay, so they carry most of the load of the network. While HMSCAR-sps algorithm prevents certain nodes as a relay node and thereby improves data delivery by not carrying network load and therefore its energy consumption is minimum at the expense of data delivery delay.

Average energy consumption of nodes for various buffer sizes.
Figure 18 shows energy efficiency for various algorithms. HMSCAR is energy efficient compared to SCAR and GRAD-MOB. This is obvious as SFR and HMSCAR prefer nodes with long jump as relay nodes and most of the load is carried by these nodes, so these nodes will deplete their energy very soon. So instead of 10% node death, if first node death is considered as energy efficiency, then HMSCAR performs the best.
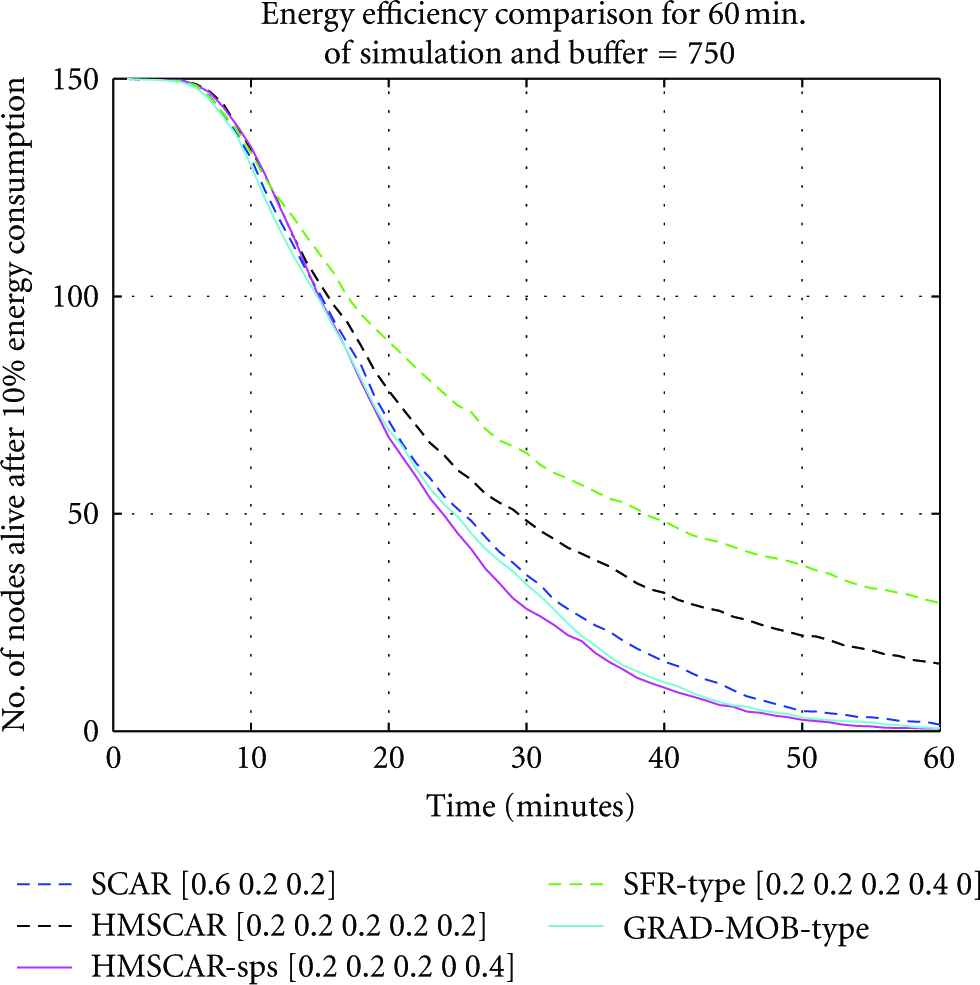
Number of nodes alive after 10% energy consumption.
7.3. Simulation-3
Figure 19 shows the number of packets received of various algorithms for various node densities with single-copy replication scheme. HMSCAR has the highest amount of packets received among all the algorithms at higher node densities. The number of packets received for HMSCAR is 15% more compared to SCAR for 150 number of nodes and higher by 5% at 100 number of nodes. Performance of all the algorithms improves as node density is increased.

Data received at multisinks versus various number of nodes.
Figure 20 shows average data delivery delay of the packets for SCAR, GRAD-MOB, HMSCAR, SFR, and HMSCAR-sps algorithms with various node densities with the single-copy replication scheme. Average data delivery delay is worst for HMSCAR and its variants at lower node densities. Performance of HMSCAR is improved as node density is increased. It is important to note that, although the HMSCAR performs poor, than GRAD-MOB at node density of 150, the delivery ratio of HMSCAR is 15% more compared to GRAD-MOB at this node density.

Average delay of packets received for various no. of nodes.
Figure 21 shows the average energy consumption of all the nodes for various algorithms. Mean energy consumption is reduced as node density increases. This is due to the decrease in internode distance, that a packet has to travel with relative increase in node density. HMSCAR has least amount of energy consumption among all the algorithms for various node densities.

Average energy consumption of nodes for various no. of nodes.
7.4. Simulation-4
Figure 22 shows the number of packets received of various algorithms for various transmission range with single-copy replication case. The number of packets received is more for HMSCAR-sps algorithm for higher transmission range. HMSCAR-sps has highest packet received amongst all the algorithms for transmission range above 30. At low transmission range, packet delivery is very poor. This is due to unavailability of super nodes as relays at lower transmission range.

Data received at multi sinks versus various trans. Range.
Figure 23 shows average data delivery delay of various algorithms for various transmission range with single copy replication case. Average data delivery delay is worst for SFR and HMSCAR algorithms when compared to other three at lower transmission range. Performance is almost equal at higher transmission range.
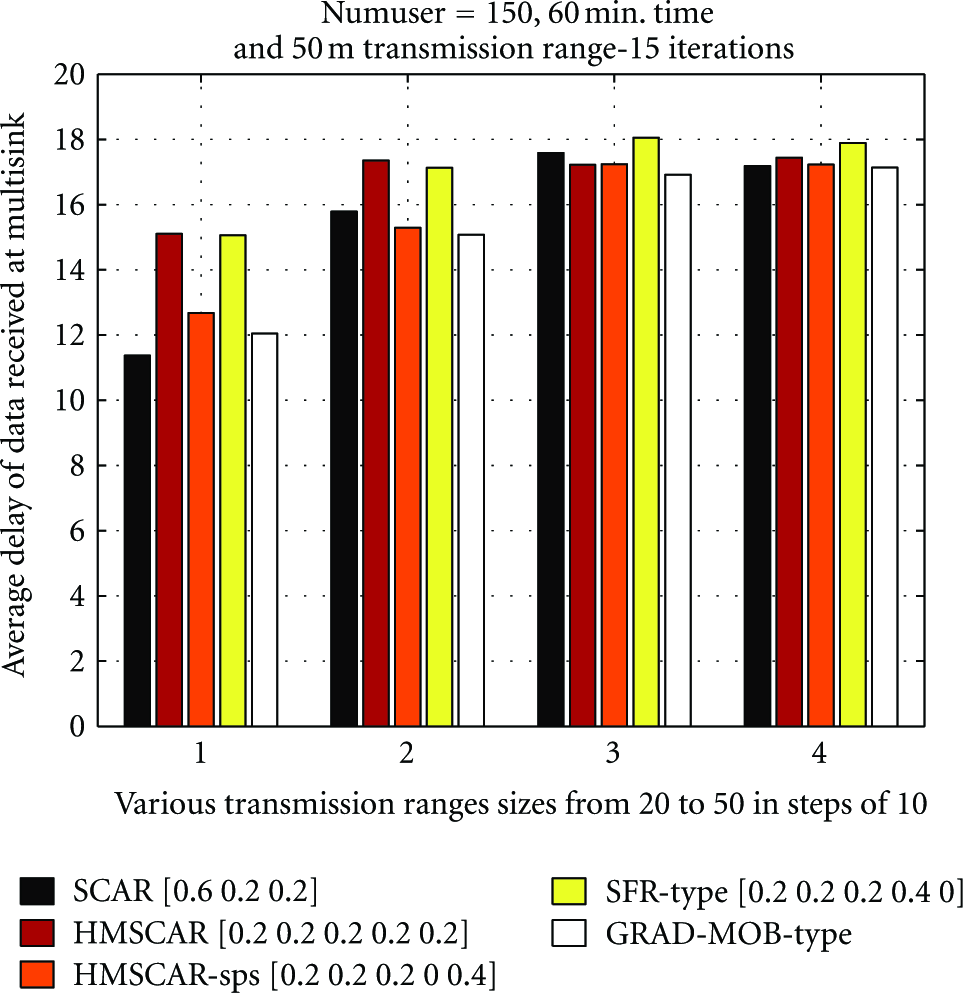
Average delay of packets for various trans. Range.
Figure 24 shows energy consumption of data received at all the sinks for various algorithms. The SFR algorithm consumes more power while HMSCAR-sps consumes the least. Energy consumption increases for change in transmission range from 20 meter to 40 meter. For transmission range of 50 meter, the energy consumption is reduced. Connectivity with sink node is increased due to increase in transmission range, and therefor the relative internode distance which a packet has to travel from source to destination is decreased.

Average energy consumption of nodes for various trans. Range.
7.5. Simulation-5
Figure 25 shows the number of packets received for HMSCAR algorithm with various weight combinations of weight

Data received versus simulation time for various
Figure 26 shows average data delivery delay of the packets for HMSCAR algorithm with various weight combinations of weights

Average delay of packets received for various
Figure 27 shows energy consumption of data received at all the sinks for HMSCAR algorithm with various weight combinations of weights

Average energy consumption of nodes for various
Figure 28 shows the number of packets received for HMSCAR algorithm with various weight combinations of weights

Data received versus simulation time for various
Figure 29 shows average data delivery delay of the packets for HMSCAR algorithm with various weight combinations of weights

Average Delay of packets received for various
Figure 30 shows energy consumption of data received at all the sinks for HMSCAR algorithm with various weight combinations of weights

Average energy consumption of nodes for various
7.6. Simulation-6
Figure 31 shows the number of packets received for various algorithms with various combinations of levy exponents α and β. For various combinations of α and β, our proposed algorithm outperforms SCAR, SFR and GRAD-MOB. However, it can be observed that the performance of HMSCAR and HMSCAR-sps is best, for smaller value of α which is 0.5. This value corresponds to heavy tail distribution of flight length.

Data received versus time for various alpha and beta.
Figure 32 shows the number of packets received of various algorithms with single-sink replication scheme. Result shows that our proposed algorithms HMSCAR and HMSCAR-sps outperform SCAR, SFR, and GRAD-MOB only for α and β equal to [0.5 1.5] and [

Data received versus time for for various alpha and beta.
Figure 33 shows average data delivery delay of various algorithms with various combinations of levy exponents α and β. Average data delivery delay of HMSCAR-sps is the lowest amongst all the algorithms. This suggests efficiency of proposed

Average delay of packets received for various alpha and beta.
Figure 34 shows average data delivery delay for various algorithms with various combinations of levy exponents α and β. Average data delivery delay of various algorithms is worst for higher value of β equal to 1.5. Average data delivery delay of HMSCAR-sps is l the owest among all algorithms except for β equals to 1.5. When value of levy walk exponent is near 2, it closely matches Brownian motion. The threshold that is set for deciding super pause time is excessive for this value of levy exponent.

Average delay of packets received for various alpha and beta.
Figure 35 shows energy consumption of data received at all the sinks of various algorithms, with various combinations of levy exponents α and β. Results show that our proposed algorithms, HMSCAR and HMSCAR-sps, outperform the SCAR, SFR, and GRAD-MOB except when α and β equal [1.5 0.5]. The number of super flight lengthes decreases as levy exponent α is increased.
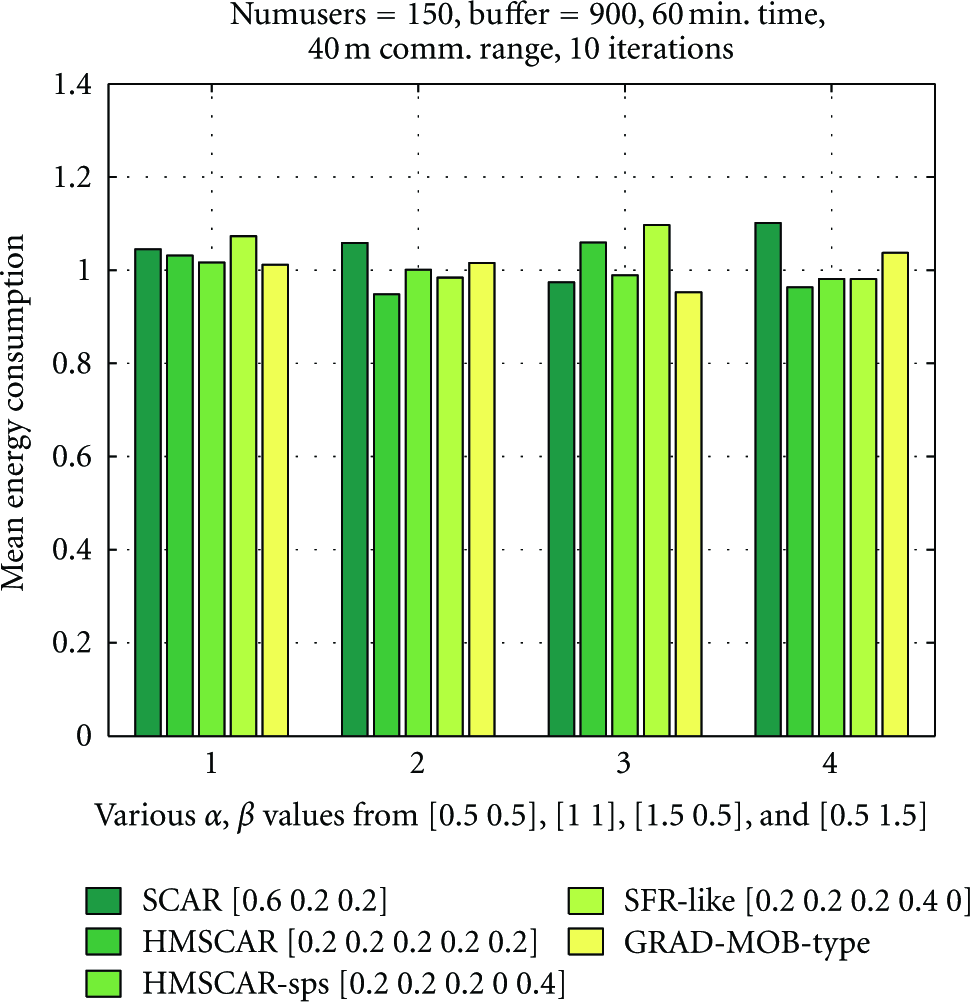
Average energy consumption of nodes for for various alpha and beta.
8. Conclusion
This paper presents an opportunistic routing algorithm, which exploits the truncated power law distribution of flight length and pause time of human mobility. The proposed algorithm's performance depends upon availability of nodes, which exhibit super flight length and super pause time. This behavior is observed in tail part of the distribution and is a rare event. The probability of occurrence of this rare events is more for dense networks like CPSN. The majority of DTN routing schemes are aimed towards random mobility and are unrealistic for CPSN scenario. Proposed algorithm considers realistic mobility of cell phone users and performs better with realistic human mobility. The algorithms design is such that it selects nodes with super flight length as relay nodes and avoids nodes likely to observe super pause time, as the relay node. This is quite a natural observation for human mobility. Simulation results indicate HMSCAR's best performance is under 3-sink presence compared to 1. Due to nature of newly introduced utility parameters, it performs better for multi-sink scenario. We have evaluated algorithm for single copy replication scheme, and data delivery and delay are improved simultaneously. This shows the power of newly introduced context parameters, which incorporates human walk characteristics into its design. With multisink presence HMSCAR and HMSCAR-sps perform best for all types of human walk (various combinations of levy exponent α and β). Since single-replication scheme is basis of all other replication schemes, the design of HMSCAR will provide a new insight for routing under human carried mobile devices.
Footnotes
Acknowledgments
This work has been supported by the Department of Science and Technology (DST), Government of India, and the India-UK Advanced Technology Center of Excellence in Next Generation Networks (IUATC) Project.