
Abstract
Little literature concentrates on effective and self-organizing regional energy-saving schemes in cellular networks with dynamic traffic. In this paper, we propose a regional self-organizing energy-saving management mechanism through pilot power adjustment in cellular networks. The mechanism analyzes autonomic processes for saving energy firstly. Then, it proposes regional BS TP (Trigonal-Pair) compensation method to determine BS modes for saving energy. Next, it adopts intelligent coverage compensation algorithm to adjust pilot power of compensated BSs, so as to avoid coverage hole and ensure enough capacity. Integrated evaluation model is still proposed in the mechanism to validate efficiency of proposed algorithms. Simulations show that about 17% of regional energy consumption can be saved. In comparison to other ES methods, our ES mechanism can obtain better energy-saving outcomes and keep service quality and coverage above acceptable levels.
1. Introduction
Saving energy for cellular networks (including GSM, 3G, and LTE) contributes to reduction of greenhouse effect and curtailment of operating expense, which make sense of strong practical significance [1]. Varieties of services supplied by wireless networks require higher speed and bandwidth. And accordingly wireless access points should meet high-density deployment demands as well. In cellular networks, these points (BTS, NodeB, eNodeB, etc.) are key elements of energy consumption, which consume around 80% to 90% of telecommunication networks [2]. For providing continuous services, sizes of cellular networks are designed in accordance with peak traffic. However, during night period load of several access points is fairly low, so much resource and operation costs are wasted [3]. Therefore, saving energy through sleeping several BSs (Base Stations) is feasible. Researches for improvements of wireless cellular networks mainly include two aspects, which are hardware and software separately. Former is demand for more energy efficient BS hardware modules such as power amplifiers. Latter requires enhancement for autonomic management functions. These functions are able to sleep several BSs, and meanwhile control neighbor BSs to compensate their coverage and capacity through signaling [2, 4].
As a software level method, Energy-Saving (ES) management of cellular networks has been standardized. Definition of 3GPP is followed. Management centre switches off several BS under low traffic period, and meanwhile adjusts wireless parameters (such as pilot power and down tilt) of active BSs, so as to avoid coverage hole and guarantee users' QoS (Quality of Service) demand [5]. To avoid frequent adjustment for network parameters, ES management is categorized to self-optimization use case of SON (Self-Organizing Network). In this case, when triggering conditions is satisfied, network is able to autonomic execute energy-saving actions above without artificial interference. Thereby regional energy saving is achieved [4]. And these definitions have been considered as basic instruction for software level ES method.
This paper proposes a self-organizing pilot-power adjusting mechanism (SPAM) to save energy for cellular networks. It can obtain a better ES effect comparing to other methods and guarantee regional coverage and service quality as well. SPAM adopts centre management manner. It proposes processes of autonomic ES management and key algorithms for coverage compensation. It still considers regional interference and introduces a more integrated energy model.
Moreover, in order to provide a clear description of SPAM, in this paper, states for network and modes for BSs are specified. States of cellular networks mainly contain Normal State (NS) and Sleeping State (SS). Under NS all the BS states still keep on Normal Mode (NM). When ES triggering conditions are satisfied, networks will transfer to SS. Under SS, BS modes may be NS, Sleeping Mode (SM), and Compensation Mode (CM) determined by regional TP compensation method.
The remainder of this paper is organized as followed. Section 2 introduces several related work of ES methods and algorithms. Processes of SPAM management are proposed in Section 3. In Section 4, regional Trigonal-Pair (TP) compensation method is introduced to resolve BS selection problem of SPAM. This method includes compensation solution for single BS and regional BS selection scheme for ES. To resolve compensation problem of SPAM, intelligent optimization algorithm for pilot-power adjustment is described in Section 5. Integrated validation model for ES method in SPAM is analyzed in Section 6. Simulation and analysis are given in Section 7. Conclusions and future work are introduced in Section 8.
2. Related Work
Currently, little literature concentrates on effective integrated regional energy-saving schemes. ES management of cellular networks faces the following problems.
Firstly, standardizations have not proposed effective solutions for saving energy in cellular networks. ES management use case has been defined, and management functions, requirements, and assessment criteria are specified as well [4, 5]. However, no processes are proposed to execute ES actions. Merely parameters which can be adjusted to achieve ES gains are referred. These standards still does not refer implementation methods or algorithms for regional energy saving. Energy consumption evaluation metrics which are required to compute energy efficiency of ES methods have been analyzed in [6], but there are not standardized as well.
Secondly, several ES schemes are just from user perspective and are not suitable for dynamic traffic. Besides, these schemes always take on high computation complexities. Simplified centralized and distributed ES algorithms are introduced in [7, 8], but only load reallocation strategy is considered. ES problems from user perspective are formulated as NP hard problems and given effective resolution algorithms in [9, 10]. But regional coverage blind ratio and service quality under ES duration have not been evaluated. Besides, how to adjust wireless parameters in order to compensate coverage and capacity is also not introduced. Schemes in the literatures are still suitable for ES at a single time point, not the entire time period.
Thirdly, current regional ES schemes are defective. As regional ES schemes mainly resolve ES problems from traffic perspective, they can be formulated much simpler and suitable for dynamic traffic distribution. Though few regional energy-saving schemes have proposed maximized mathematical models and regional compensation methods [11–14], but interference is unfortunately neglected. Besides, the BS sites are all based on theoretical deployment. Irregular BS sites under practical scenarios are not considered. Still, BS energy consumption under different modes is very simple and not accurate.
Fourthly, saving energy by deployment of smaller sizes of BSs/cells (for instance, pico-BS/cell and femto-BS/cell) is not suitable for operation network. Though adoption of sleep mode for macrocell can save energy to a certain degree [15, 16], extra BS construction may bring out additional radio interference in the area. Still, extra costs of the new BSs are not economical.
Fifthly, current energy consumption model is not integrated. Static and dynamic components of BS power in wireless networks have been analyzed [17]. But no precise relationship between traffic and dynamic power part is concluded. Radius variation and its effect to transmit power are analyzed as well [18]. But only propagation model is considered. So evaluation of energy-saving efficiency may be not accurate.
Aiming to resolve the above problems, SPAM gives process of autonomic ES management mechanism, defines several evaluation metrics to validate effect of ES methods, proposes regional ES method for dynamic traffic suitable for operational networks, and analyzes power consumption model of BS.
3. Processes of Self-Organizing ES Management Mechanism
SPAM proposes self-organizing processes for ES management. The management centre executes ES mechanism according to these processes. These processes include five self-organizing stages (self-monitoring, self-analysis, self-planning, self-execution, and self-evaluation), which is shown in Figure 1. Each step is controlled by a centralized management centre.

Processes of SPAM.
Detailed description is described as follows.
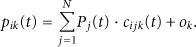
Monitoring regional traffic and power variation. Theoretic capacity of cellular networks depends on number of CE (Channel Element) resource. Thus, occupied CE number is adopted as an important evaluation metric for regional resource usage. Still, regional traffic is computed through the model in [12] when arrival rates and average service time for each service is known. When network is under NS, if ES triggering conditions are satisfied, which mean regional traffic is lower than ES triggering threshold and duration is longer than buffering time, ES processes are activated and transferred to (4) or else turned back to (1). When network is under SS, if recovery conditions are satisfied, which mean regional traffic is higher than ES recovery threshold and duration is longer than buffering time, recovery processes are activated and transferred to (10)otherwise turned to (9). According to deployment of BSs, regional TP compensation method determines different BS model based on practicable local compensation. For BSs which will be to CM, intelligent coverage optimization algorithm is adopted to obtain adjusting values of pilot power. The purpose is guaranteeing regional coverage range and quality and maximizing saving energy of BSs at the triggering time point. Steps (4) and (5) are two key issues of SPAM. Set pilot power of BSs which will be turned to CM according to the adjusting values in (5). Set modes of BSs which will be turned to SM to sleep mode with low power to keep them controllable. Execute handover for users serviced by BSs under SM to appropriate BSs and CM. Network goes to SS and return to (1). When network is under SS, evaluate service quality (service block probability is taken as an important indicator here), if service quality constraints are satisfied, go back to (1) or else go to (10). Turn on all the BSs to NM, and retrieval parameters values of all the BSs to original ones; Execute handover for user whose service is downgraded to appropriate BSs. Network goes to NS. Evaluate regional coverage and energy saving ratio and go back to (1).
In analysis stage, setting of buffering time aims at avoiding frequent control and handover caused by rapid traffic variations. Traffic information for quantities of BS should be obtained and necessary handovers are required for ES management. Moreover, each self-organizing stage should be executed according to the conditions of the whole network. Hence, centralized management function can be deployed in current network management centre. Here, we use OAM (Operation Administration and Maintenance) systems to fulfill these functions. In self-execution stage, OAM systems control BSs and other important network nodes to complete transfer of BS modes and handover for users. Cooperations among BSs are essential. Meanwhile, in order to rapidly recover network states, OAM systems must record parameter values of controlled BS under NM.
4. Regional TP Compensation Method
Ideally coverage of each BS is circular and each cell is hexagonal. One BS may serve for one or multiple cells. Referring to compensation coverage method through adjustment radiuses of neighbor BSs in [12] and considering symmetry of BS and cells, a theoretical TP under regular BS deployment is proposed in [14]. In order to improve current work, regional TP compensation method proposes local TP compensation scheme, and TP-based regional BS selection scheme suitable for irregular BS deployment. Objective of this method is to determine BS modes when network is under SS.
4.1. Local TP Compensation Scheme
From local perspective, coverage of single BS can be compensated by neighbor BSs. An ideal TP example for BS with steerable antenna (often deployed in urban area) can be seen in Figure 2. BS pair (

Ideal TP compensation for BS with steerable antenna.
For practical situation with asymmetric deployments and limited resource, more general TP compensation scheme is shown in Figure 3. Assume that radius of BS0 is

General TP compensation for BS with steerable antenna.
Besides, TPs of BS0 are selected as follows.
Find corresponding six BSs with strongest signal strength from neighbor list of BS0 and then put these BSs to set NB. Select three nonadjacent BSs from NB to make up of a triangle. If every interior angle For other BSs in NB, repeat the operation in (2) and attempt to find another TP.
For BS with omnidirectional antenna, local TP compensation scheme is same as BS with steerable antenna, which will be ignored here.
For multiple choices exist for local TP compensation of single BS, it may bring about additional coverage effect for other BSs. So as to optimize regional coverage quality and energy efficiency, regional TP selection scheme is required to maximize coverage effectiveness of BS under CM.
4.2. Regional TP Selection Scheme
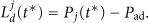
Assume that B represents set of BSs in ES area and S represents modes of BSs. Still assume
(2) Output: S (3) (4) for (5) (6) find the set of opposite pairs (7) (8) for (9) (10) (11) and (12) (13) (14) (15) (16) (17)
In Algorithm 1, initially each BS is under NM. And we only consider BS with TPs. Still, only TPs without BS under SM can be taken as effective TPs to compensate BS under NM. Moreover, in order to maximize compensation effect for BS under CM, for effective TPs of each BS, the one including maximal number of BS under CM will be chosen. After execution of this algorithm, we can obtain maximal number of BS under SM and minimal number of BS under CM.
However, settings for triggering and recovery conditions still should be determined in order to obtain
5. Intelligent Coverage Optimization Algorithm
In cellular networks, coverage is determined by pilot signal (here including BCCH in GSM, CPICH in UMTS, and PDCCH in LTE). When network is under SS, in order to compensate coverage for BS under SM, pilot power adjustments for BS under CM are required. Still, at the triggering time, it is a complex combinatorial optimization problem to adjust pilot power for BSs under CM with coverage and capacity constraints. Intelligent optimization algorithm is required. Mathematical model of regional coverage compensation is discussed in this chapter firstly. Then intelligent algorithm adopted to resolve this model is then introduced.
5.1. Mathematical Model
Assume ES triggering time point is

Still, components of

It is true that executing ES algorithms and schemes always put additional computation and management burden of the system, and energy consumption may increase as well. However, in our mechanism, these algorithms and schemes are mainly executed in OAM system. Number of these nodes is fairly lower than number of BSs, so their energy consumption is much lesser than BSs. Besides, as we adopt algorithms and schemes with low computation complexity, their additional energy consumption is inappreciable comparing to energy-saving gains for BSs. Considering that this additional energy is minor and hard to be quantified, we just ignore it here.
Relation f between

Assume that minimal acceptable signal strength of BS receiver is

Still, assume that minimal acceptable pilot power strength of edge user is
According to propagation models decided by different scenarios, mapping relation between path-loss L and coverage radius r is shown as follows [20]

From (5), (6), and (7), relations between
Notice that from (1) to (7) is suitable for BS under CM and NM. For BS under SM, only a little power is consumed in order to keep it controllable, which is denoted as
From perspective of coverage, minimal regional coverage gap is required:

In (8),
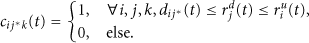
In order to guaranteeing resource, transmit power and coverage gap constraints, following requirements should be satisfied for G(
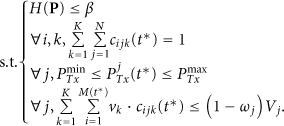
In (10), β is upper limit for coverage gap.
5.2. Simulated Annealing Algorithm for Coverage Compensation
Assume that
Based on analysis in last section, natural number coding will be adopted to represent state for


Penalty will enlarge along with temperature decrease. Thus in the initial stage global search will be executed, and local search will be obtained in the final stage.
Procedures of SA algorithm for coverage compensation are shown in Figure 4. The detailed steps are shown followed.
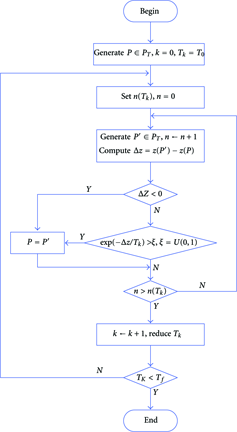
Procedures of SA algorithm for coverage compensation.
Step 1.
Choose an initial solution
Step 2.
Randomly generate a neighbor solution
Step 3.
If
Step 4.
If heat balance is achieved, which means
Step 5.
Decrease
However, SA algorithm may accept several bad solutions, so the final solution may worse than best solution. Thus, best solutions during the computed process should be saved.
The pilot power of each BS will adjust to the value generated by this SA algorithm. Thus, regional coverage and capacity compensation are achieved.
6. Integrated Evaluation Model
Algorithms in Sections 4 and 5 mainly aim to time point
6.1. Service Quality Evaluation
In cellular networks, service blocking probability is an important indicator of service quality [12], which will be adopted here to evaluate the effect of SPAM.
Assume that traditional traffic model based on Markovian processes with multiclass


Moreover, average number of active user for service k at time t is

6.2. Regional Coverage Evaluation
Algorithm in Section 5 gives a theoretical compensation for regional coverage. In order to verify effect to coverage quality by SPAM, regional coverage should be evaluated after ES recovery. And power signal strength and corresponding

So as to guarantee regional coverage, when network is under SS probability distributions of

6.3. Regional Energy Efficiency Evaluation
Energy efficiency denotes regional energy saving ratio of ES algorithms. It is the most important indicator to evaluate ES outcome. Assume that period of traffic variation is


Assume energy-saving ratio on the whole period is

From above the analysis, we can get a more accurate energy consumption evaluation model.
7. Simulations and Discussions
This section introduces simulation and analysis of SPAM, and integrated evaluation model is still validated. Moreover, SPAM is compared to another two ES methods in the references to evaluate its efficiency.
7.1. Scenario Description
SPAM will be simulated under an urban region of WCDMA in Qualnet. Top view of simulation scenario is shown in Figure 5. Region size is 3 km × 3 km, and street width is 20 m. A square shaped garden with size of 200 m × 200 m is located in centre of this region. Heights of all the buildings are between 20 m and 40 m. 16 homogeneous BSs (here is NodeB) are deployed on top of buildings and distances among these BSs are between 600 m and 700 m. Each BS contains three sectors and are all managed by the same OAM system. ID of each cell is automatically generated by Qualnet.

Top view of simulation scenario.
For these BSs, carrier frequency is 2.13 GHz. width of horizontal half-power antenna beam is 65 degree, and width of vertical half-power antenna beam is 10 degree. Initial tilt, antenna gain, and radiation efficiency of antenna are 8 degree, 15 dBi, and 0.8, separately. Besides, available bandwidth of each cell is 2 Mbps. Assume CE number and margin ratio of every BS are same as V and ω. Values of different power parts in (3) refer to [17] for UMTS BS.
In the area, AMR 12.2 kbps voice service and CS 64 kbps video call are provided. COST231-HATA propagation model is adopted to estimate path loss. Initial link budget parameters set
Link budget parameters in our scenario.

Practical arrival rates in one cell obtained from an urban area in Beijing is adopted and shown in Figure 6 for one week. From the arrival rates variation we can find that cycle is one week. And variation during weekend is different from weekday.

Average arrival rate for the two services for one cell.
In our simulation, other important parameter configurations for intelligent coverage optimization algorithm and integrated evaluation model are shown in Table 2.
Configuration of several important parameters.

Besides, in SA algorithm, Change step of each
For transmit power, maximal transmit power of BS under NM is 43.01 dBm. Assume that when network is under SS, power of BSs under SM is 5% of maximal one. In order to maintain management function, pilot power of BS under CM should keep on the optimal values computed by SPAM.
7.2. Analysis of Simulation Result
A near-sinusoidal traffic variation is obtained in ES region for each hour can be seen in Figure 7. It is easy to find that traffic variations from Monday to Friday (work time) are similar. Still, traffic variations from Saturday to Sunday (weekend) are alike as well and lower than work time. Moreover, traffic during 23:00 to 7:00 (called as night time) of each day is fairly slight.

Normalized traffic variations during one week.
Through simulation, SPAM will be executed each time when ES triggering conditions are satisfied. For example, in Monday when SPAM is executed, the best value is obtained when iteration time is 143, and values of
More detailed result of SPAM during Monday is shown in Table 3. NodeB numbering is similar with numbering in Figure 5. Modes of each NodeB and pilot power value can be observed. During this period, values of NR, SR, and CR are 0.375, 0.25, and 0.375 separately. Energy saving time is 10.15 hour with
Result of SPAM for Monday.

SPAM will then be evaluated during one week to assess its efficiency comparing to two representative methods. One is centralized algorithm (we call it as CA) in [8] and other one is switched off scheme (we call it as SoS) in [12]. CA is an algorithm from user perspective, and SoS is an algorithm from regional traffic perspective. We choose them for the following reasons: (1) they are all centralized algorithms; (2) they are both suitable for ES of UMTS; (3) the evaluated metrics are similar. So comparisons among them will be more convincing.
Firstly, evaluation of service quality for the three methods with cell having highest load can be seen in Figure 8. In current cellular networks, target of blocking probability should below 0.01. From Figure 8(a), we can find that blocking probability of video call is higher than voice, and values for Sunday and Saturday are fairly low for the arrival rates are slow. Figures 8(b), 8(c), and 8(d) show that when network is under SS, blocking probability is higher than NS, which means that ES methods will degrade QoS. However, all the methods will guarantee the blocking probability below target value. Still, SoS adopts blocking probability as a triggering condition so its value is highest of all. And SPAM just cause a little degradation (about 0.001) to the service quality. CA takes on best performance here. And all of three ES methods can guarantee service quality.

Blocking probability comparisons for network without and with ES method.
Then regional coverage will be evaluated. Cumulative probabilities of CPICH RSCP and corresponding

Comparison of CPICH RSCP for network without and with ES methods.

Comparison of CPICH
Corresponding to RSCP value, Figure 10 shows that for network with non-ES method, with SPAM, with CA, and with SoS,
Still, ES methods may affect signal strength a little. For the three ES methods, SPAM possesses strongest signal distribution, so the weak coverage problem caused by BS under SM can be resolved. However, due to adjustments to pilot power, interference of SPAM may be higher than CA, and SoS, that is tradeoff among ES and coverage.
Regional energy efficiency will be evaluated at last, as shown in Figure 11. Regional ES time,

Comparisons of energy saving ratios for three ES methods.
The above analysis shows that as a self-organizing ES method, SPAM can autonomic monitor regional traffic variations and execute corresponding actions when ES triggering or recovery conditions are satisfied. Comparing to other ES methods in cellular networks, SPAM can save most energy consumption and meanwhile guarantee service quality and better regional coverage as well.
8. Conclusions and Future Work
Aiming at design of effective self-organizing regional energy-saving scheme, SPAM is proposed for cellular networks in this paper. It describes self-organizing processes of saving energy, proposes a more general BS selection scheme, an intelligent coverage optimization algorithm, and integrated evaluation model. Simulation on Qualnet shows that SPAM can save at least 17% regional energy consumption and meanwhile guarantee regional coverage, capacity, and service quality, which take on more efficient comparing to other ES methods.
However, as a centralized management mechanism, SPAM is suitable for current cellular networks. Due to that distributed management manner is more suitable for large and complex networks with heterogeneous cell deployments (femtocell, picocell, etc.), SPAM will be extended for self-organizing saving energy under multiple frequencies, multiple cell styles, and multiple service categories. Other network parameter (such as down tilt) adjustment for saving energy are still under current research.
Footnotes
Acknowledgments
This paper is supported by the Funds for Creative Research Groups of China (61121061), National S&T Major Projects (2011ZX03003-002-01), National Natural Science Foundation of China (61271187), National Key Technology R&D Program (2012BAH06B02), and NCET-10-0240 and Chinese Universities Scientific Fund (BUPT2012RC0608).