
Abstract
A multiscale wireless sensor system is designed for vibration- and impedance-based structural health monitoring. In order to achieve the objective, the following approaches are implemented. Firstly, smart sensor nodes for vibration and impedance monitoring are designed. In the design, Imote2 platform which has high performance microcontroller, large amount of memory, and flexible radio communication is implemented to acceleration and impedance sensor nodes. Acceleration sensor node is modified to measure PZT's dynamic strain along with acceleration. A solar-power harvesting unit is implemented for power supply to the sensor system. Secondly, operation logics of the multi-scale sensor nodes are programmed based on the concept of the decentralized sensor network. Finally, the performance of the multi-scale sensor system is evaluated on a lab-scale beam to examine the long-term monitoring capacities under various weather conditions.
1. Introduction
Many researchers have developed novel sensing technologies for the practical structural health monitoring (SHM) applications. The SHM system for civil infrastructures mainly includes a number of sensors, a huge amount of signal transmitting wires, data acquisition instruments, and centralized data storage servers [1–3]. Also, the stored data in the centralized servers should be handled for offline information analysis. In order to reduce high-tech labors and costs associated with the wired SHM system, many researchers have attempted to adopt wireless sensors [4–10]. One of great advantages for using wireless sensors is autonomous operations for SHM, which can be implemented by embedding system technologies.
The development of wireless sensor nodes as much as the selection of embedding SHM algorithms are important topics for the autonomous SHM [11–15]. To date, many damage monitoring algorithms have been developed for detecting the location and the severity of damage in structures [16–20]. Most of those algorithms are dependent on structural types, damage characteristics, and available response signals that are related to external loadings and environmental conditions.
Since 1990s, several researchers have focused on using vibration characteristics of a structure as an indication of its structural damage [21–24]. Acceleration response of a structure is usually measured to obtain modal parameters such as natural frequency and mode shapes which are utilized for damage detection. It were demonstrated that curvature (or strain) mode shapes are sensitive to structural damage in beam structures [19]. However, computational differentiation of mode shapes with assumption in boundary condition is required to obtain curvature mode shapes from acceleration response. This may lead to less or more errors in estimation of curvature mode shapes. Alternatively, curvature mode shapes directly extracted from strain response are much more accurate. Nevertheless, using strain response, the curvature mode shapes are sensitive only to damage nearby sensor [25]. Therefore, in a hybrid concept, damage detection results would be more accurate and reliable by the combined usage of acceleration and strain responses [26].
Based on the previous works, however, vibration-based approaches cannot easily distinguish multiple damage types unless the information on real damages is known. The pattern of one damage type is hard to be distinguished from the other since the change in vibration characteristics may be attributed to the damage types involved in the structure. Therefore, other nondestructive evaluation techniques which are complementary to vibration-based approaches should be sought. Recently, electromechanical impedance-based monitoring has shown the promising success to detect the minor incipient change in structural integrity at local subsystems [27–31]. Compared to vibration-based approaches, the impedance-based method has the capability of more precisely localizing damage. Moreover, its local monitoring does not characterize the entire structure, which means the global healthy state would not be easily captured to couple with the local monitoring information. Using those characteristics of the impedance-based methods, Kim et al. [32] first proposed a combined SHM system with global vibration-based techniques and local impedance-based techniques. Also, Kim et al. [20] proposed a serial hybrid SHM scheme using the global and local techniques for sequentially monitoring of damage in PSC bridges.
This paper presents a multiscale wireless sensor system which is designed for vibration- and impedance-based SHM. Firstly, smart sensor nodes for vibration and impedance monitoring are designed. In the design, Imote2 platform which has high performance microcontroller, large amount of memory, and flexible radio communication is implemented to acceleration and impedance sensor nodes. Acceleration sensor node is modified to measure PZT's dynamic strain along with acceleration. A solar-power harvesting unit is implemented for power supply to the sensor system. Secondly, operation logics of the multiscale sensor nodes are programmed based on the concept of the decentralized sensor network. Finally, the performance of the multiscale sensor system is evaluated on a lab-scale beam to examine the long-term monitoring capacities under various weather conditions.
2. Multiscale Wireless SHM System
An efficient SHM system must have the capability to monitor structural properties in different scales to guarantee the designated behaviors of the structure as well as specified structural components. Also, the change in structural characteristics due to environmental perturbation must be examined to distinguish environment effect from damage-induced effect. Additionally, the installation and operation of the SHM system should be convenient, cost-efficient, and enabled for long-term monitoring with minimized human engagement.
Considering those requirements, this study presents a multiscale wireless SHM system as schematized in Figure 1. The system is implemented with wireless/autonomous operation unit so that the structural responses are automatically measured, and the data are wirelessly transmitted to the base station. The sensor system can be alive for long time with solar-power unit which harvests solar energy and supplies power to sensors. Also, the environmental temperature is monitored with temperature monitoring unit. In order to examine structural health in different scales, three types of structural responses which are acceleration, dynamic strain, and electromechanical (E/M) impedance are monitored. Global structural changes are monitored using acceleration response since it represents global behavior of structure. Meanwhile, local structural changes are monitored using dynamic strain response since it is sensitive to local behavior of structure. For specified members, the E/M impedance responses are monitored by PZT sensors since E/M impedance is very sensitive to any mechanical change around the sensor.
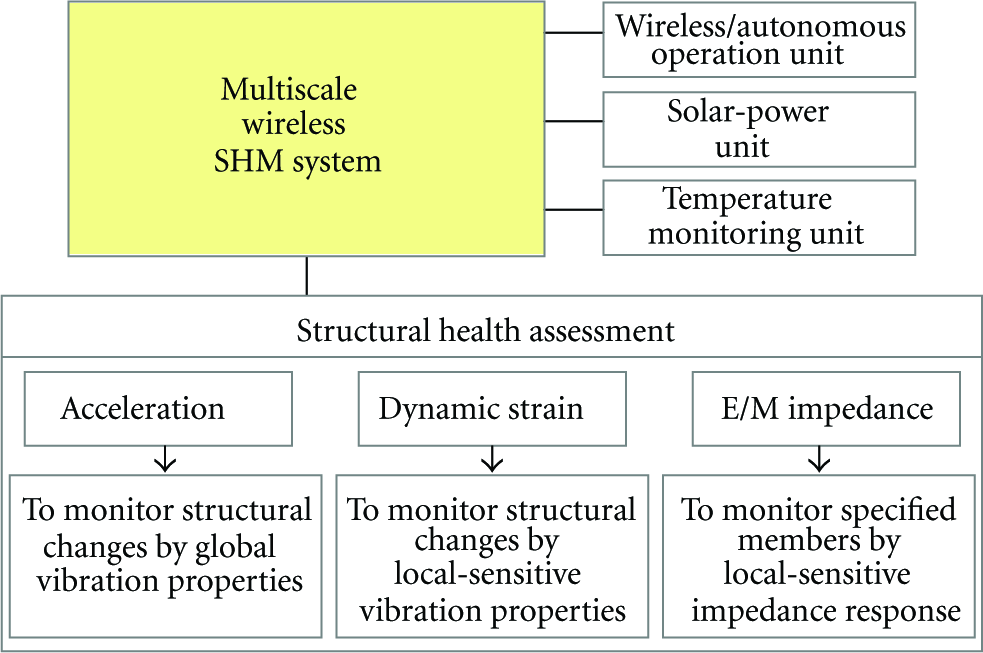
Schematic of multiscale wireless SHM system.
3. Hardware Design of Multiscale Sensor System
3.1. Schematic of Multiscale Sensor Node
According to the concept of multiscale wireless SHM system, an acceleration-dynamic strain-impedance sensor node on Imote2 platform was designed as schematized in Figure 2. The high-performance sensor platform, Imote2, provided by Crossbow Technology [34] was selected to control the operation of the sensor node. For vibration monitoring, SHM-A, SHM-AS, and SHM-H sensor boards were selected. The SHM-A and SHM-H sensor boards were developed for acceleration measurement by University of Illinois at Urbana-Champaign (UIUC) [35, 39]. The SHM-H is utilized to measure low-amplitude acceleration response. For measuring higher amplitude acceleration response, the cheaper sensor board SHM-A is employed. The SHM-AS sensor board was modified from SHM-A sensor board in order to additionally measure PZT's dynamic strain signal. For impedance monitoring at critical structural components, impedance sensor board (SSeL-I) developed by Pukyong National University (PKNU) [36] was also selected. As shown in Figure 1, the solar-powered energy harvesting is implemented by employing solar panel and rechargeable battery. Figure 3 shows the prototype of the multiscale sensor node which consists of four layers as (1) X-bow battery board, (2) Imote2 sensor platform, (3) SHM-H board or SHM-A (AS) board, and (4) SSeL-I board.

Schematic of multiscale sensor node.

Prototype of multiscale sensor node on Imote2 platform.
3.2. Imote2 Sensor Platform
For the multiscale sensor node, a sensor platform should be selected based on the capabilities of microcontroller, memory, and wireless radio. Table 1 gives the comparison of three sensor platforms including Mica2 [33], wireless sensor node (WSN) [6], and Imote2 [34]. As summarized in the table, the Imote2 has high performance microcontroller and large memory as compared to Mica2 and WSN. Lynch et al. [6] selected a wireless radio using 9XCite-900 MHz which has the outdoor line-of-sight range up to 300 m. However, only radio frequency of 2.4 GHz is allowed to be used outdoor in Korea. Therefore, the Imote2 platform was selected for this study.
Comparison of sensor platforms.

The prototype of Imote2 sensor platform is shown in Figure 4. It is built with 13–416 MHz PXA271 XScale processor. This processor is integrated with 256 kB SRAM, 32 MB flash memory, and 32 MB SDRAM. It is also integrated with many I/O options such as 3 × UART, I2C, 2 × SPI, SDIO, I2S, AC97, USB host, Camera I/F, GPIOs. Therefore, Imote2 platform is very flexible in supporting different sensor types, ADC chips, and radio options. A 2.4 GHz surface mount antenna which has a communication range of about 30 m is equipped for each Imote2 platform. In addition, an SMA connector is soldered directly to the board for connecting to an external antenna in case of longer communication range is desired. The Imote2 platform connects with sensor boards and battery board by basic connectors.

Prototype of Imote2 sensor platform [34].
3.3. SHM-H Sensor Board for Acceleration Measurement
For large civil infrastructures where their vibration is very small, highly sensitive vibration sensor must be employed to acquire structural response. For that, the high-sensitivity SHM-H sensor board was developed by Jo et al. [35]. Comparison of the SHM-H and a commercial PCB system is shown in Table 2. The sensor board has relative low input range and relative high noise density. But their dimensions, weight, and cost are much lower than the commercial PCB system.
Comparison of vibration measurement systems.

As schematized in Figure 5 and listed in Table 2, the SHM-H includes several key components such as accelerometer, antialiasing filter and analog-to-digital converter (ADC). It employs a SD1221L-002 accelerometer [40] for high-sensitivity channel, which has input range ±2 g, sensitivity 2 V/g, and output noise 5 μg/√Hz. It also employs a LIS344ALH accelerometer for two normal channels, which has input range ±2 g, sensitivity 0.66 V/g, and output noise 50 μg/√Hz. In addition, it has a Sensirion SHT11 digital relative temperature and humidity sensor. A 4-channel 16-bit high-resolution ADC with digital antialiasing filters (QF4A512) is adopted to convert analog signal to digital data by 16 bit resolution (12 bit resolution is guaranteed through oversampling and averaging process). By adopting the customizable digital filters, the sensor board provides user-selectable sampling rates and cutoff frequencies that can meet a wide range of applications for civil infrastructure monitoring.

Schematic of SHM-H sensor board [35].
3.4. SHM-A (AS) Sensor Board for Acceleration and PZT's Dynamic Strain Measurement
For monitoring vibration responses of structures or structural components with large vibration magnitude, a cheaper acceleration sensor board with lower sensitivity, SHM-A, can be used. The SHM-A sensor board was developed by Rice et al. [39]. As listed in Table 2, the components of this sensor board are similar to those of the SHM-H sensor board, except the high-sensitivity accelerometer. For acceleration measurement, the SHM-A employs the triaxial LIS344ALH accelerometer of which its sensitivity is relatively lower and output noise is quite higher than the SHM-H.
In this study, a modified SHM-AS sensor board was designed to measure PZT's dynamic strain signals, additionally. The principle of PZT as the passive strain sensor is that electrical displacement (related directly to electrical current) is induced since a mechanical stress (or strain) is applied to a PZT material. More detailed explanation of PZT's dynamic strain can be found in [41].
The schematic of SHM-AS sensor board is shown in Figure 6. This sensor board was modified from SHM-A sensor board. First, the dynamic strain signal from PZT sensor is passed through a signal conditioner circuit to produce an analog signal of 0–3.3 V. Then, the external channel (i.e., channel 4) on SHM-A sensor board is hooked up for measuring the analog signal which is processed by the ADC. Note that the input range 0–3.3 V is required to be maintained for the external channel on SHM-A sensor board.

Schematic of SHM-A (AS) sensor board.
3.5. Impedance Sensor Board
For damage detection of critical local region, electromechanical impedance of a structure is monitored. The changes of electromechanical impedance represent the changes of structural properties which are caused by damages [20, 27, 29]. In this study, the SSeL-I sensor board developed by Kim et al. [36] was selected for impedance-based SHM. The SSeL-I sensor board was designed on the basis of original impedance sensor nodes presented by Mascarenas et al. [42] and Park et al. [43]. As schematized in Figure 7, the sensor board consists of an AD5933 impedance converter, a connector to PZT patches, a temperature and humidity sensor SHT11, and two connectors to the Imote2 sensor platform. The microcontroller PXA271 and wireless radio CC2420 on the Imote2 platform are utilized for controlling impedance measurement and data transmission, respectively.

Schematic and prototype of SSeL-I sensor board [36].
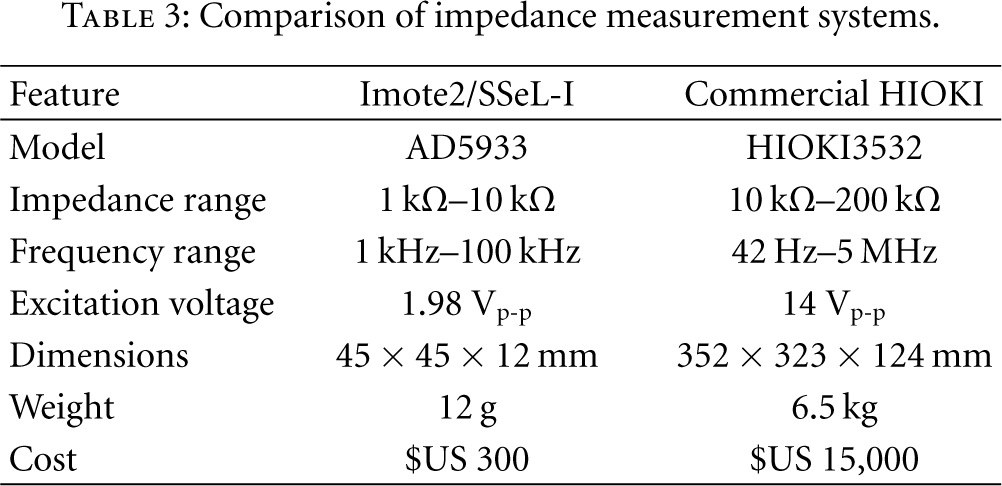
The core component of the sensor board, AD5933 impedance converter, has the following embedded multi-functional circuits: function generator, digital-to-analog converter, current-to-voltage amplifier, antialiasing filter, ADC, and discrete Fourier transform (DFT) analyzer. With measurable range from 1 kHz to 100 kHz, this chip converts real and imaginary of impedance signatures at a target frequency and transmits these values into the microcontroller [44]. As outlined in Table 3, the specifications of the SSeL-I sensor board is compared with those of the commercial impedance analyzer HIOKI3532. Note that the cost of the SSeL-I sensor board is much lower than the HIOKI3532.
Comparison of impedance measurement systems.
3.6. Solar Power Harvesting Unit
The use of disposable battery is available for powering smart sensor nodes. However, it needs to be regularly replaced for long-term usage. In order to deal with power supply issue, especially for long-term operation of smart sensor nodes, energy harvesting is essential. Among the natural energy sources (i.e., solar energy, wind energy, and vibration energy), solar energy is a valuable selection for Imote2 platform. The solar power harvesting system consists of a solar panel and a rechargeable battery. To harvest solar energy, the original hardware of X-bow battery board must be modified as Miller et al. [37].
In order to select appropriate solar power harvesting components, power consumption of the three sensor nodes is examined. The power consumption of each prototype sensor node (i.e., Imote2/SHM-A (AS), Imote2/SHM-H, and Imote2/SSeL-I) is listed in Table 4. Among the three prototypes, Imote2/SHM-H is most consumed power. Rechargeable battery must be selected in order to supply power enough for long-time operation of the sensor nodes. Due to the requirement for solar panel integrated with the Imote2 platform such as output voltage range 4.6–10 V and output current range 115–1400 mA, SPE-350-6 solar panel (9 V, 350 mA) provided by SolarMade is a suitable selection. In addition, Powerizer Li-polymer rechargeable battery which has the capacity of 10000 mAh, normal voltage of 3.7 V which can be charged up to 4.2 V, and contains a protection circuit is also employed. Figure 8 shows SPE-350-6 solar power and Li-ion Battery used for the multiscale sensor node.
Power consumption (mW) of Imote2/SHM-A(AS)/SHM-H/SSeL-I.

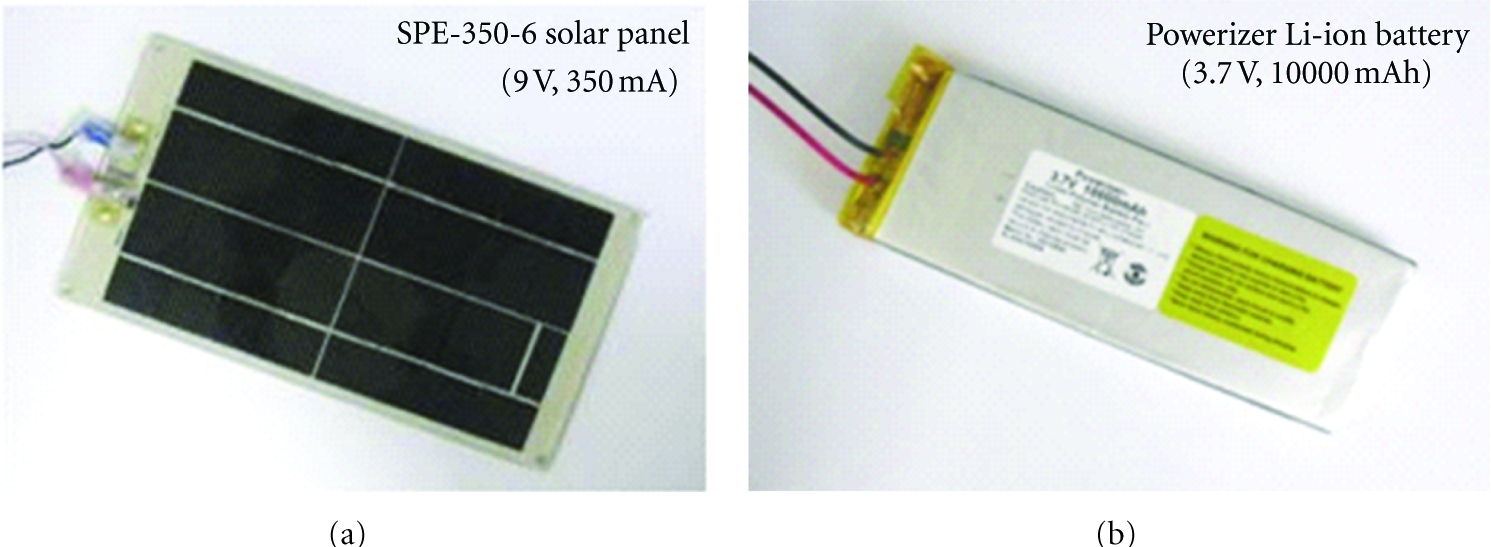
Solar power harvesting components.
When solar energy is available, it is assumed that the solar panel harvests in an hour the minimum voltage of 4.6 V, minimum current of 115 mA, and minimum power of 529. This power is sufficient to operate the Imote2/SHM-A (AS), Imote2/SHM-H, and Imote2/SSeL-I in about 47 minutes, 45 minutes, and 128 minutes, respectively. Note that it takes only about 2 minutes for one impedance measurement with 501 sweeping points. When solar energy is not available, the full-charged battery can still supply enough power in 60 hours, 55 hours, and 160 hours to the Imote2/SHM-A (AS), Imote2/SHM-H, and Imote2/SSeL-I, respectively.
4. Embedded Software for Multiscale Sensor System
4.1. Software for Solar Power Harvesting Unit
For solar power harvesting, ChargerControl component from ISHMP Services Toolsuite [45] is employed. This component is developed to check battery voltage and to control charging process. If the battery voltage is less than 3.9 V or the charging voltage is adequate (more than 4.1 V), the charging mode will be initiated. If the battery voltage is sufficient, the Imote2 goes to sleep mode. The ChargerControl component works in conjunction with SnoozeAlarm component which frequently checks charging voltage and battery voltage for the efficient charging process. More details about the solar power harvesting system can be found in [37].
4.2. Vibration-Based SHM Software
As schematized in Figure 9, device drivers of vibration-based SHM are programmed for the Imote2/SHM-A(AS)/SHM-H according to UIUC ISHMP Service Toolsuite and PKNU SSeL (Smart Structure engineering Lab) SHM Tools [43]. The sensor nodes are embedded with the following key components: (1) RemoteSensing for synchronized vibration measurements, (2) AutoMonitor for autonomous operation, and (3) VibrationMonitoring for vibration-based damage detection.

Vibration-based SHM software.
After finishing vibration measurements, all the measured data from leaf nodes are transmitted to a gateway node. Then the data is processed to feature extraction and damage detection from SSeL SHM tools. The SSeL SHM tools include a device driver for ADC and mathematical functions for damage monitoring such as power spectral density (PSD) and correlation coefficient (CC) of PSDs. Also, the modal identification method, stochastic subspace identification (SSI) algorithm, is embedded into the system to extract modal parameters such as natural frequencies and mode shapes.
The RemoteSensing provides a high level of flexibility in the choice of network and sensing parameters. Figure 10 shows the flowchart of the RemoteSensing component [37]. The application includes the following four major steps. The first step is network synchronization. The second step is sending measurement parameters from the gateway node to leaf nodes. The third step is data collection. The last step is transferring data back to the gateway node and saving the data on the base station.

Flowchart of RemoteSensing component [37].
The AutoMonitor is another advanced component of ISHMP Service Toolsuite that allows autonomous operation of sensor network by combining three components: ThresholdSentry, RemoteSensing, and SnoozeAlarm as shown in Figure 11. ThresholdSentry is a component that periodically wakes leaf nodes at predefined time to measure data with the RemoteSensing component. SnoozeAlarm is a component that puts the leaf nodes in a continuous sleep/wake cycle. The purpose of the SnoozeAlarm is power saving. The node uses less than 10% of the power when it is in the deep sleep mode than when it is in an idle awake mode. The interval time to execute the AutoMonitor component is defined by user. More detail about the operation of the AutoMonitor component can be found in [38].

Flowchart of AutoMonitor component [38].
The VibrationMonitoring component is programmed in SSeL-SHM Tools to extract vibration features and to detect damages in structure. Firstly, the change in power spectral density (PSD) of vibration signal can be utilized to detect the change in structural properties. PSD is calculated from Welch's procedure as follows [46]:

To estimate the change in PSD due to structural change, correlation coefficient (CC) of PSD is calculated as follows [36]:

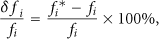
Secondly, the change in structural properties can also be detected using the change in modal parameters such as natural frequencies. In order to obtain natural frequencies, stochastic subspace identification (SSI) is first performed to extract natural frequencies and mode shapes [47]. Subsequently, the relative change of natural frequency or frequency shift (FS) is calculated as follows:
4.3. Impedance-Based SHM Software
As schematized in Figure 12, device drivers of impedance-based SHM are programmed for the Imote2/SSeL-I according to UIUC ISHMP Service Toolsuite and PKNU SSeL (Smart Structure engineering Lab) SHM Tools [43]. The sensor nodes are embedded with the following key components: (1) Impedance for impedance measurements, (2) ImpAutoMonitor for autonomous operation, and (3) ImpedanceMonitoring for impedance-based damage detection.

Impedance-based SHM software.
After finishing impedance measurements, all the measured data from leaf nodes are transmitted to a gateway node. Then the data is processed to feature extraction and damage detection from SSeL SHM tools. The SSeL SHM Tools include a device driver for impedance measurement and mathematical functions for damage monitoring such as root mean square deviation (RMSD) and correlation coefficient (CC) of impedance signatures.
Figure 13 shows the flowchart of the Impedance component. The application includes the following three major steps. The first step is sending measurement parameters from the gateway node to leaf nodes. The second step is impedance measurement. The last step is transferring data back to the gateway node and saving the data on the base station.

Flowchart of Impedance component.
The ImpAutoMonitor is a component of SSeL SHM Tools that allows autonomous operation of sensor network for impedance monitoring as shown in Figure 14. The component is the combining of Timer component and the Impedance component. Timer is a component that periodically wakes leaf nodes at predefined time to measure impedance data with the Impedance component. The interval time to execute the ImpAutoMonitor component is defined by user.

Flowchart of ImpAutoMonitor component.
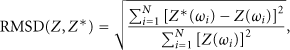
The ImpedanceMonitoring component is programmed in SSeL SHM Tools to extract impedance features and to detect damages in structure. In order to quantify the change in impedance signature due to the change in structural properties at critical region, root mean square deviation (RMSD), and correlation coefficient (CC) of impedance signatures are calculated as follows:

5. Performance Evaluation of Multiscale Sensor System
5.1. Target Structure and Experimental Setup
The performance of the multiscale sensor nodes is evaluated by open-air monitoring tests on a small-scale beam model. The test model is an aluminum cantilever beam with the dimension of

Experimental setup for lab-scale beam.
Vibration signals (i.e., acceleration and dynamic strain) were recorded with sampling rate of 500 Hz (digital cut-off frequency was set of 200 Hz). As shown in Figure 15, for PZT's dynamic strain measurement, a PZT patch, FT-35T-2.8A1, was bonded on the beam at the same location with accelerometer. The PZT patch was connected to external channel (i.e., channel 4) on SHM-AS sensor board. For impedance measurement, a PZT-5A type sensor connected to the SSeL-I sensor board was also bonded on the beam. The impedance signatures between 40 kHz and 60 kHz were measured from the PZT sensor with 500 intervals. For temperature measurement, temperature sensor on the SHM-AS board (i.e., SHT11) was moved outside of the sensor box with extended lines and covered with filter cap making a waterproof. Temperature was also measured by wired thermometer with Kyowa EDX-100A Universal Recorder for comparison. Additionally, supply voltage and charging status were also recorded by the multiscale sensor nodes. The interval time to execute the AutoMonitor and ImpAutoMonitor was setup as one hour for autonomous operation.
5.2. Performance of Temperature Sensing Unit
During ten-day experiment (9th August to 18th August, 2011), temperature was recorded by the multiscale sensor nodes. Figure 16 shows the temperature monitoring results due to the change in weather condition. It is observed that temperature data measured by the sensor nodes shows relatively good agreement with those by Kyowa system. However, the temperature data show significant gap (e.g., 7°C) when temperature went up under sunlight (more than 35°C).

Temperature monitoring results.
5.3. Performance of Power Harvesting Unit under Various Weather Condition
In order to evaluate the performance of power supply unit, some parameters such as supply voltage, charging status were recorded by the multiscale sensor nodes during the ten-day experiment. The charge status of solar power harvesting unit is shown in Figure 17. During ten-day experiment, the supply voltage remained around 4.0 V which satisfies the minimum required voltage for Imote2 operating of 3.7 V. As shown in Figures 17(b) and 17(c), the charging process of the solar power harvesting unit worked stably well for long-term monitoring, except on some cloudy days (i.e., 11th, 16th–18th August, 2011). On those days, the charging voltage was relatively low.

Power monitoring results.
5.4. Vibration Monitoring Performance
Figures 18 and 19 show acceleration responses and PZT's dynamic strain responses, respectively, measured by the Imote2/SHM-AS sensor node. Under ambient vibration condition, vibration responses of the test beam were recorded for 200 seconds per every one hour. As shown in Figures 18(b) and 19(b), PSDs indicating two modes were calculated by (1) to estimate changes in frequency responses due to the temperature change. Note that, some noise peaks due to electrical effect were also obtained in the PSD of dynamic strain. Therefore, the improvement on sensor node design to eliminate electrical noise from PZT's dynamic strain should be remained as future study.

Acceleration responses measured by Imote2/SHM-AS.

PZT's dynamic strain responses measured by Imote2/SHM-AS.
Figure 20 shows the correlation coefficients (CCs) of PSDs versus temperature changes during the ten-day test period. As shown in Figure 20, the CCs of PSDs measured by the accelerometer were good matching with those measured by the PZT sensor. The CCs of PSDs change little due to the change in weather conditions. However, during rainy times (on 9th, 11th and 13th August, 2011), CCs of PSDs were significantly reduced.
Correlation coefficients of PSDs versus various temperatures.
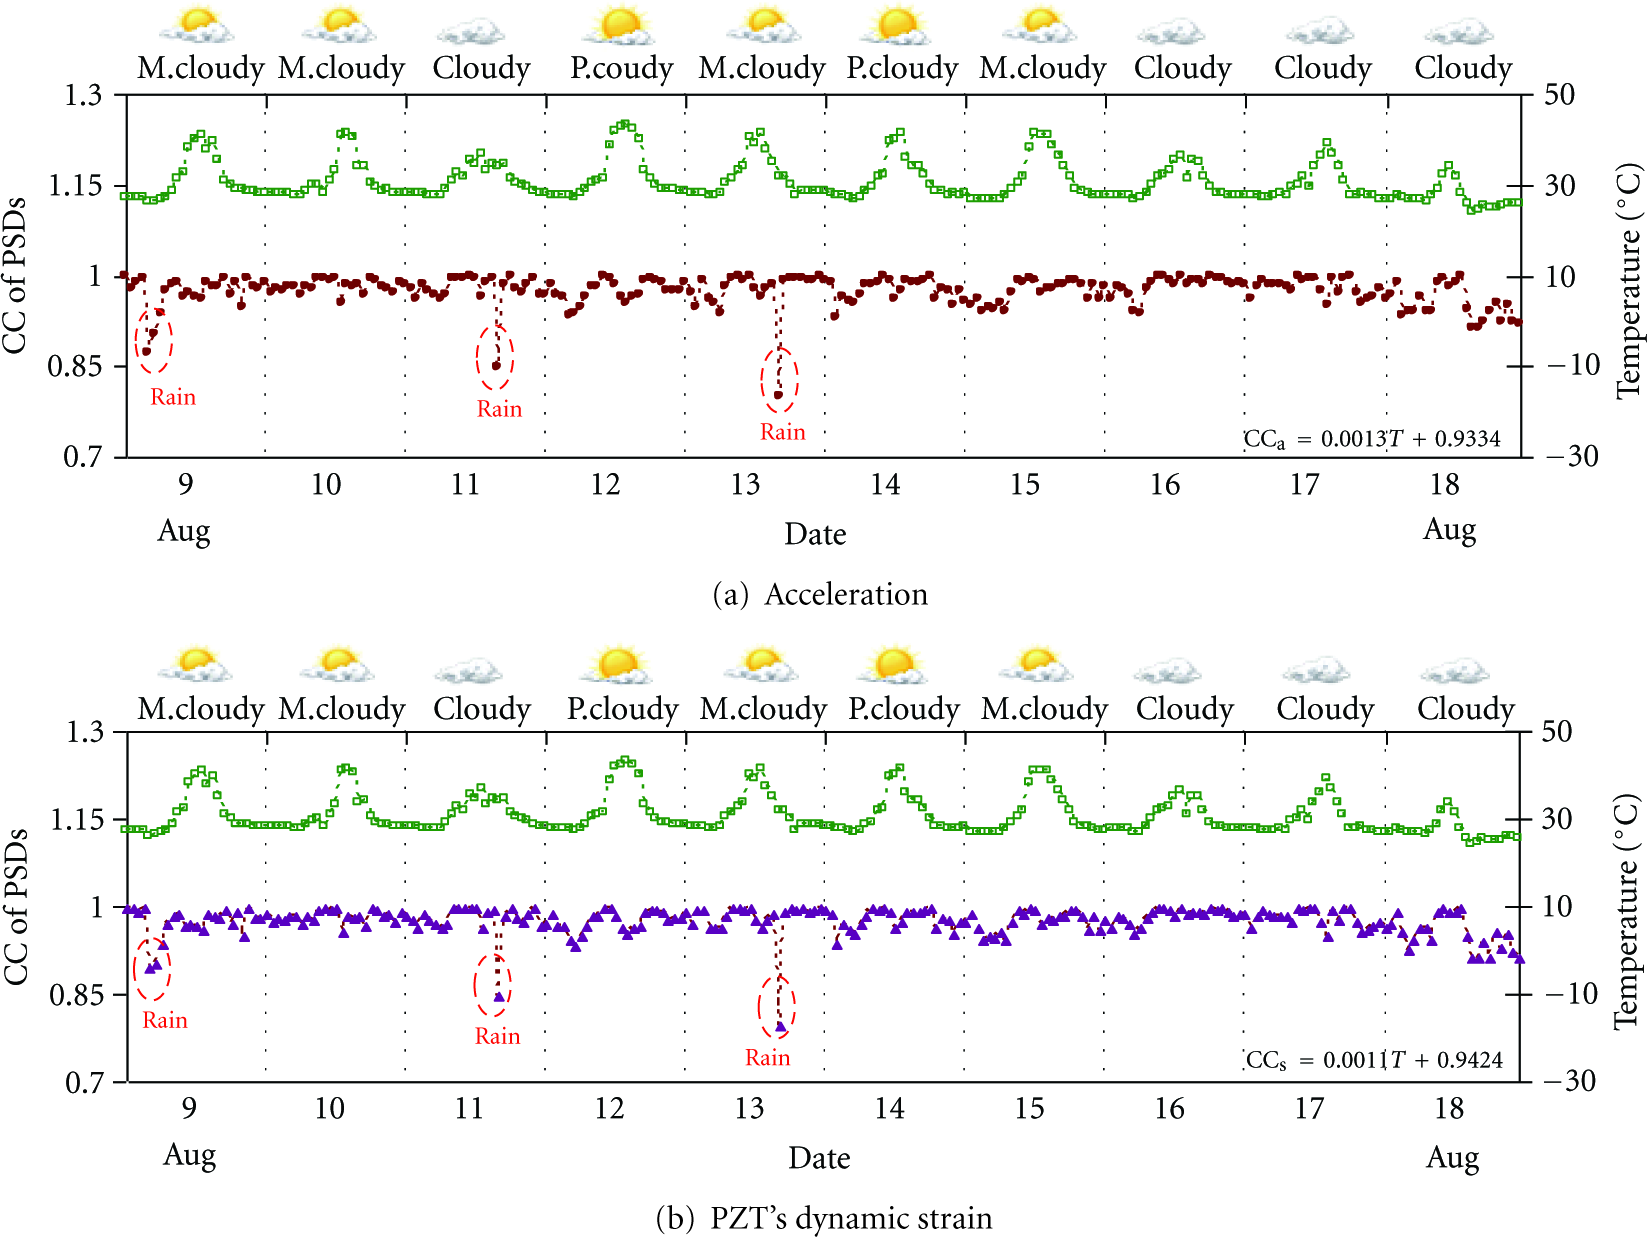
Next, stochastic subspace identification (SSI) algorithm was utilized to extract natural frequencies [47]. Figure 21 shows the SSI method's stabilization charts for modal identification of the test beam. Natural frequencies of two first modes are identified similarly by using acceleration (i.e., 9.964 Hz and 52.847 Hz) and PZT's dynamic strain (i.e., 9.964 Hz and 52.796 Hz). Since temperature variation causes the change in structural properties, the changes in natural frequencies due to temperature are monitored to detect structural changes (3). Figures 22 and 23 show the relative changes in natural frequencies versus temperature changes during the long-term period. Both modes 1 and 2 show sensitive changes due to the temperature changes. It is noticed that natural frequencies decrease as temperature goes up and vice versa. The monitoring results show that the PZT's dynamic strain can be used for vibration-based SHM applications.

SSI method's stabilization charts for modal identification.

Relative changes in the first natural frequency versus various temperatures.
Relative changes in the second natural frequency versus various temperatures.
5.5. Impedance Monitoring Performance
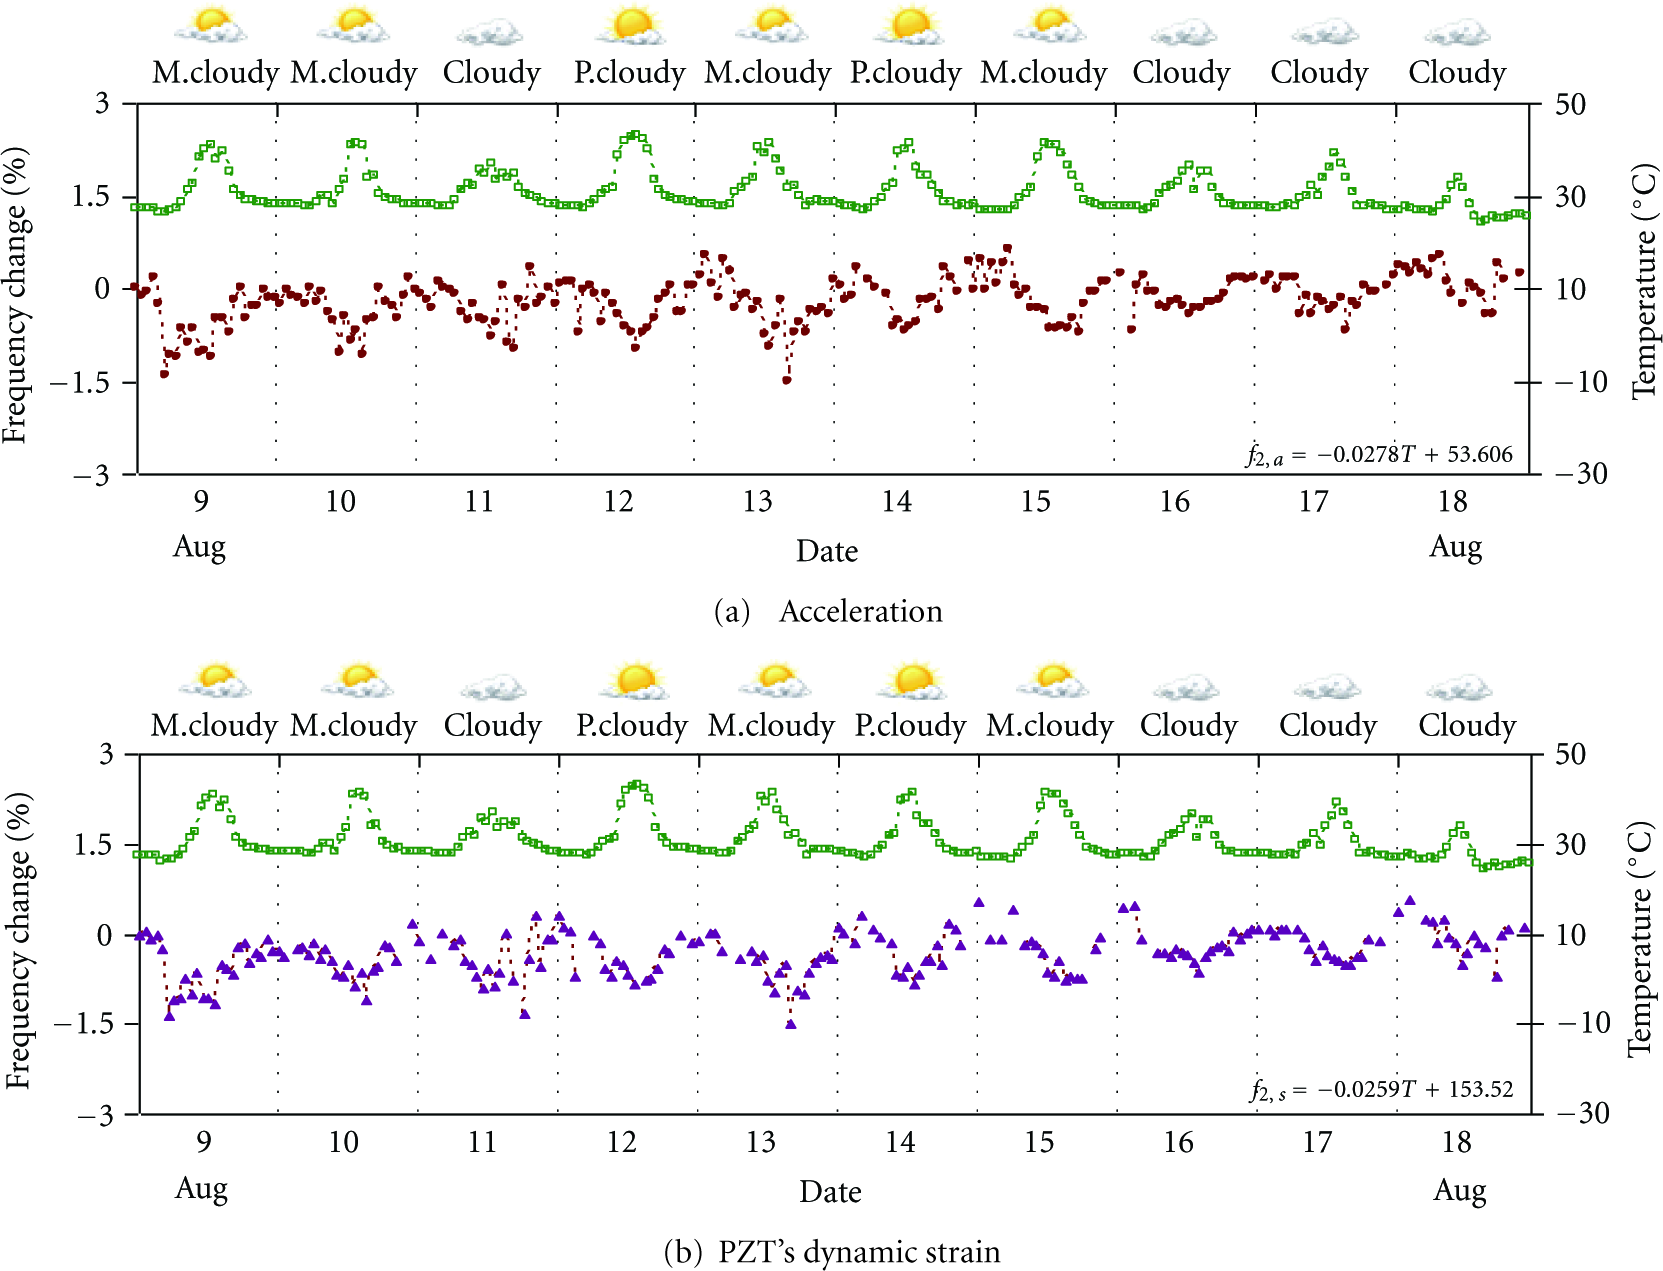
As shown in Figure 24, the impedance signals between 40 kHz and 60 kHz were measured from the PZT sensor by the Imote2/SSeL-I sensor node. The impedances in the range between 51 kHz and 52 kHz are sensitive to the temperature change. The real impedances shift to up and left side as the temperature increases. In order to evaluate that effect, the root mean square deviation (RMSD) and correlation coefficient (CC) of impedance signatures were calculated by (4) and (5). Ten-day impedance monitoring results are shown in Figure 25. The RMSD of impedance increases as the temperature increases, and vice versa. Meanwhile, the CC of impedance decreases as the temperature increases and vice versa.
Real impedance signatures measured by Imote2/SSeL-I.

Impedance signatures versus various temperatures.
6. Concluding Remarks
A multiscale acceleration-dynamic strain-impedance sensor system was developed for vibration and impedance based SHM. Firstly, acceleration-based and impedance-based smart sensor nodes were designed. The hardware and embedded software were designed for the multiscale SHM system. In the design, Imote2 platform is implemented to acceleration and impedance sensor nodes. For strain monitoring, the acceleration sensor node was modified to measure PZT's dynamic strain. A solar-power harvesting unit was implemented for power supply to the sensor system. Secondly, operation logics of the multiscale sensor nodes were programmed based on the concept of the decentralized sensor network. Finally, the performance of the multiscale smart sensor system was evaluated on a lab-scale beam to examine the long-term monitoring capacities under various weather conditions.
From the evaluation tests, the following conclusions have been made. The solar-power supply worked stably well for long-term monitoring. Environmental temperature was accurately monitored by the multiscale sensor system. Global and local behaviors of beam structure with regarding to acceleration, PZT's dynamic strain, and impedance were well monitored by the sensor system under various weather conditions. As a summary, the multiscale smart sensor system showed good performance for the robust long-term vibration and impedance monitoring.
Footnotes
Acknowledgments
This work was supported by Basic Science Research Program through the National Research Foundation of Korea (NRF) funded by the Ministry of Education, Science and Technology (2011-0004253). The graduate student involved in this study was also partially supported by the Brain Korea 21 (BK21) program, Korea.