
Abstract
An experimental investigation on water-based nanofluids containing iron oxide (Fe2O3) in concentrations ranging between 5 and 20% in mass is presented. The purpose of this study is to measure thermal conductivity and dynamic viscosity of these fluids, as a starting point to study the heat transfer capability. The stability of the nanofluids was verified by pH and Zeta potential measurements. A dynamic light scattering (DLS) technique was used to obtain the mean nanoparticle diameters. It was found that thermal conductivity of these nanofluids improved with temperature and particles concentration. The temperature and nanoparticle concentration effects on viscosity were analyzed, obtaining a significant increase with respect to water. All the fluids exhibited a Newtonian behaviour. The experimental values were compared with some theoretical models for both thermal conductivity and dynamic viscosity.
1. Introduction
Several solutions have been proposed to enhance the thermal performance of the heat transfer devices. The most common technique has been maximizing heat transfer area in heat exchangers, but, at the moment, it seems no further improvement could be achieved. Another possibility is given by increasing heat transfer coefficient h that, for an imposed flux, depends on the thermal properties of the fluid. Aiming to improve the characteristics of the traditional working fluids (as water, glycol, oil, and refrigerants), a new generation of thermal vectors, called nanofluids, has emerged. Nanofluids are suspensions of nanosized solid particles (1–100 nm) in liquids. These new suspensions may be utilised in several applications, for example, engine cooling, engine transmission oil, cooling electronics, refrigeration, drilling, lubrications, thermal storage, solar water heating, and so forth [1].
In the last decade, several papers have been published on the preparation and characterization of these fluids, but they are often not coherent and the results are inconsistent.
This could be due to the difference in their preparation methods and, consequently, on their stability. There are two main procedures to obtain nanofluids, one is the one-step method and consists on synthesizing the particles directly into the fluid, the second is the two-step method and it implies the dispersion of nanopowders in the based fluid [2]. These methods influence the stability of the fluids and then their properties [3]. Nanosized particles have high-energy surface. For example, in 4 nm diameter particle ca, 50% of the atoms are at the surface, and, therefore, surface properties and chemistry control the nanoparticle behaviour [4]. In aqueous environments, there is a tendency for nanoparticles to aggregate, to reduce the particle surface energy. It depends on a number of factors including surface functionalization, pH, and ionic strength. For this reason, a pH optimization is fundamental [5], and often different dispersants and surfactants are added to the nanofluids [6].
Moreover, different methods of nanoparticles dispersion into the base fluid (ball milling, ultrasonication, homogenization) can lead to a different stability [7, 8].
For this reason, before studying thermophysical properties, a stability investigation must be done.
In literature, many studies on the thermal conductivity of nanofluids have been published highlighting significant enhancement in this property [9–11], but some results are controversial and the mechanisms behind exceptional conductivity enhancement is still not well understood.
On the contrary, viscosity data in literature are still scarce even if this property is fundamental as well as thermal conductivity. Too high viscosity increase can nullify the positive effects of thermal conductivity enhancement.
Oxide nanoparticles are easier to get and less expensive than other nanoparticles, as metals and carbon nanotubes. Amongst them, Fe2O3 is already used to produce stable and commercially available water nanofluids, but, at our knowledge, no thermal conductivity data and only few experimental viscosity data are available in the literature.
For this reason, in this investigation, we study the effect of temperature and nanoparticles concentration on thermal conductivity and dynamic viscosity of Fe2O3 water-based nanofluids.
We compare our results with some literature models, and we propose an experimental correlation for nanofluids viscosity.
2. Nanofluid Preparation and Experimental Apparatus
2.1. Nanofluid Preparation
The studied nanofluid is formed by hematite (Fe2O3) nanoparticles, monodispersed in deionized water. It was supplied by Sigma Aldrich at a nanoparticles nominal concentration of 20% by mass.
Bidistilled water (Carlo Erba, CAS Nr 7732-18-5) was added to the commercial nanofluid to obtain the other two nanofluid compositions: 5 wt% and 10 wt%.
These two compositions were prepared taking the original nanofluid after one hour of sonication, by means of an ultrasonic bath (Bransonic, Ultrasonic cleaner Branson 2210, output power 90 W) and adding bidistilled water in a weighed amount, measured by an analytical balance (Gibertini E42S 240 g FS), with an uncertainty of 0.002 g. Each fluid obtained in this way was further sonicated for one hour, in order to improve the dispersion of nanoparticles in the water.
No dispersant has been added to the fluid.
2.2. Nanofluids Stability Characterization
A Zetasizer Nano ZS (Malvern), based on dynamic light scattering (DLS), was used to check the actual average dimension of the nanoparticles in solution. The mean particle diameter was around 67 nm, and it did not change with the particle concentration. In Figure 1, the particle size distribution detected by the Zetasizer is represented. A further particle size measurement was performed after almost three months, and the same average diameter was found. This indicates that no aggregation occurs in few months.

Nanoparticles size distribution for water containing 5 wt% (– · –), 10 wt% (–-), 20 wt% (—) Fe2O3.
The Zetasizer Nano ZS also measures the Zeta potential of nanoparticles that quantify the magnitude of the electrical charge at the double layer. A value of Zeta potential out of the range between 30 mV and −30 mV indicates high charged surface and hence a strong electrical repulsion among the particles. Fe2O3-water nanofluid Zeta potential was around +56 mV for the 5 wt% solution, +57 mV for the 10 wt% solution, and +49 mV for the 20 wt% solution, therefore all the nanofluids seem to be very stable.
The pH of each nanofluid has been measured with a pH Meter (CRISON GPL 21) with a pH electrode (code 50 11 T). The measured values were 3.45 for the 5 wt% solution, 3.33 for 10 wt%, and 3.34 for 20 wt% at 26°C. As described in [12], the isoelectric point for water-hematite nanofluid is observed at pH 6.1. Then, the measured pH values of these solutions are far from this point, as further confirmation, together to the Zeta potential (always positive and higher than 30 mV), of the nanofluids stability.
2.3. Thermal Conductivity Measurement Apparatus
A TPS 2500 S was used for thermal conductivity measurements. The instrument is based on the hot-disk technique and can measure thermal conductivity and thermal diffusivity of several materials. The hot disk sensor is made of a double spiral of thin nickel wire and works as a continuous plane heat source. During the experiment, a small constant current is supplied to the sensor, which also serves as a temperature sensor, so that the temperature increase in the sensor is accurately determined through resistance measurement. The temperature increase is registered over a short period of time after the start of the experiment. A theoretical description of this method is provided by [13].
A proper box containing the sensor and the fluid was put in a water thermostatic bath to reach the test temperature.
The power supplied for each measurement was 30 mW, and the time of the power input was 4 s. The declared instrument uncertainty is 5%.
2.4. Dynamic Viscosity Measurement Apparatus
The dynamic viscosity data were measured at ambient pressure and in a temperature range between 283.15 K and 343.15 K, with steps of 20 K, by means of an AR-G2 rheometer (TA Instruments). It is a rotational rheometer with magnetic bearing for ultra-low nanotorque control. The suitable employed geometry is a plate-cone type, with a 1° cone and diameter of 40 mm. In order to stabilize the measurement temperature, a proper device (Upper Heated Plate) was used. A critical point in this measurement is the sample loading. After some trials with water, a constant quantity of about 0.34 mL was considered optimal for the analysis. The sample was deposited using a pipette, taking care no air bubbles were inside. Before the measurements, the rheometer was carefully calibrated at each temperature, as fully described in [14].
All the measurements were performed at constant temperature and variable shear rate, starting from 80 1/s to 1200 1/s, at constant step of about 124 1/s (except for temperature 343.15 K, at which faster measurements had to be performed due to the water evaporation). A conditioning step of 2 seconds at a preshear rate of 80 1/s was performed before the measurements.
The estimated uncertainty in the viscosity measurements is about 5%.
3. Results and Discussion
3.1. Thermal Conductivity
The measurements accuracy was assessed measuring water thermal conductivity at each temperature and comparing it with Refprop 8.0, which was assumed as [15]. The absolute average deviation between experimental data and expected value was around 0.7% with a maximum of 1.3% [16].
Thermal conductivity measurements were performed in the temperature range between 10°C and 70°C, with steps of 20°C, at ambient pressure. Figure 2 presents nanofluids thermal conductivity as a function of mass fraction and temperature, showing an almost linear enhancement with temperature at all the concentrations examined up to 50°C. Some instability is observed at temperature of 70°C, probably due to the introduction of convective motions or aggregation of the nanoparticles, but these phenomena cannot be evaluated during the conductivity tests. Table 1 presents the experimental data and the ratio between the thermal conductivity of the nanofluids and water at the same temperature.
Experimental thermal conductivity data and thermal conductivity ratio for Fe2O3 water-based nanofluids.


Experimental thermal conductivity of water-Fe2O3 nanofluid, (■) 5 wt%, (▲) 10 wt%, (●) 20 wt%, as a function of temperature. Comparison with Maxwell model (– –), Bruggeman model (–), Lu and Lin model (– · –), Xuan model (–-). Error bars correspond to 5% uncertainty.
3.2. Dynamic Viscosity
To evaluate the rheometer performance, preliminary tests were performed on a well-known fluid as water. The viscosity data were compared with Refprop 8.0 at each temperature, as shown in Figure 3. All the deviations between the measured and literature data are well within the experimental uncertainty for the shear rates between 200 and 1200 s−1, with a maximum percentage absolute average deviation (AAD%) about 2.4%. The deviations at the lowest shear rate could be due to difficulties in the torque control by the rheometer.

Dynamic viscosity of water at (■) 10°C, (▲) 30°C, (●) 50°C, (∘) 70°C, compared to (—) Refprop 8.0.
Dynamic viscosity measurements were performed at 5 wt%, 10 wt%, and 20 wt% in the temperature range between 10°C and 70°C, with steps of 20°C.
Figure 4 shows the flow curves at 10°C for water and all nanofluids. The same trend was found at all the measured temperatures. In Table 2, the experimental data are reported at shear rate around 800 s−1. Under the imposed conditions and taking into account that the used rheometer could not operate at lower shear rates for some of these samples, the nanofluids appeared to have a Newtonian behaviour, as it can be deduced by Figure 5, where shear stress is represented as a function of shear rate for the measurements at 30°C. All isotherms are linear and converge to the origin of the diagram.
Experimental viscosity data at constant shear rate (about 800 s−1) and viscosity ratio for Fe2O3 water-based nanofluids.
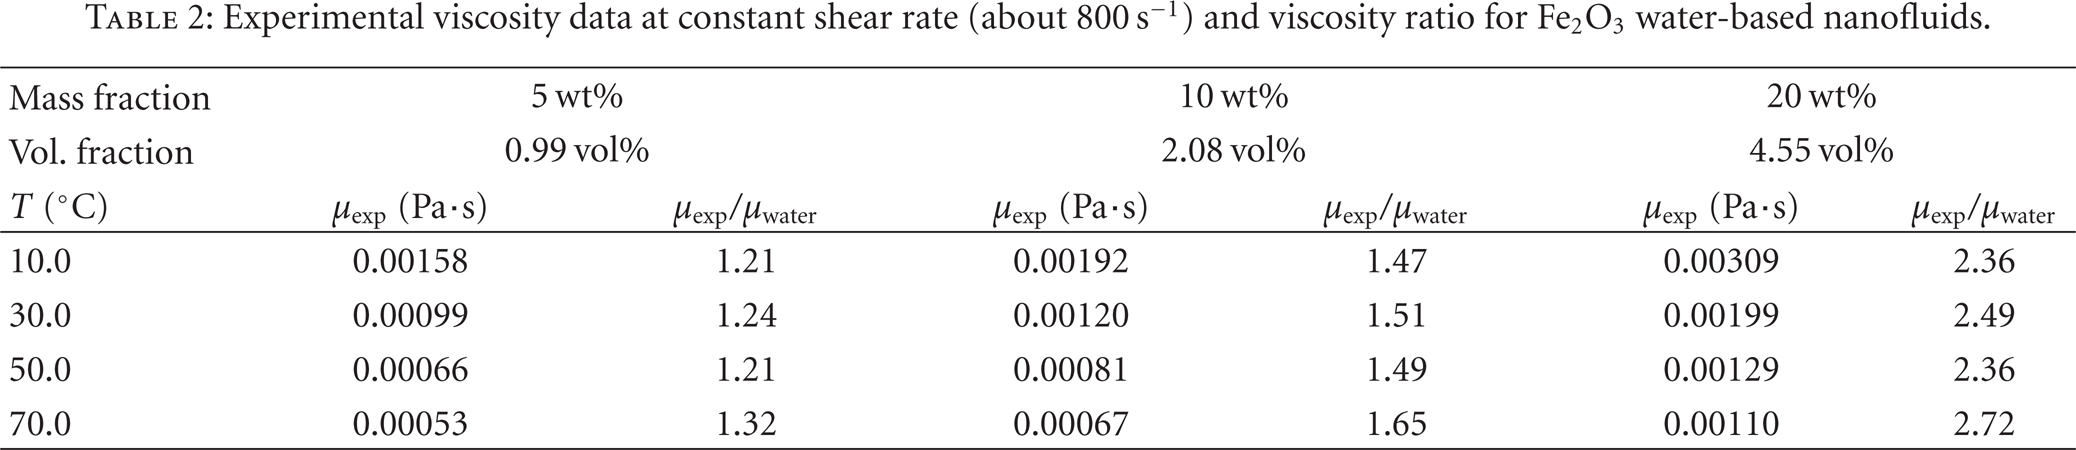
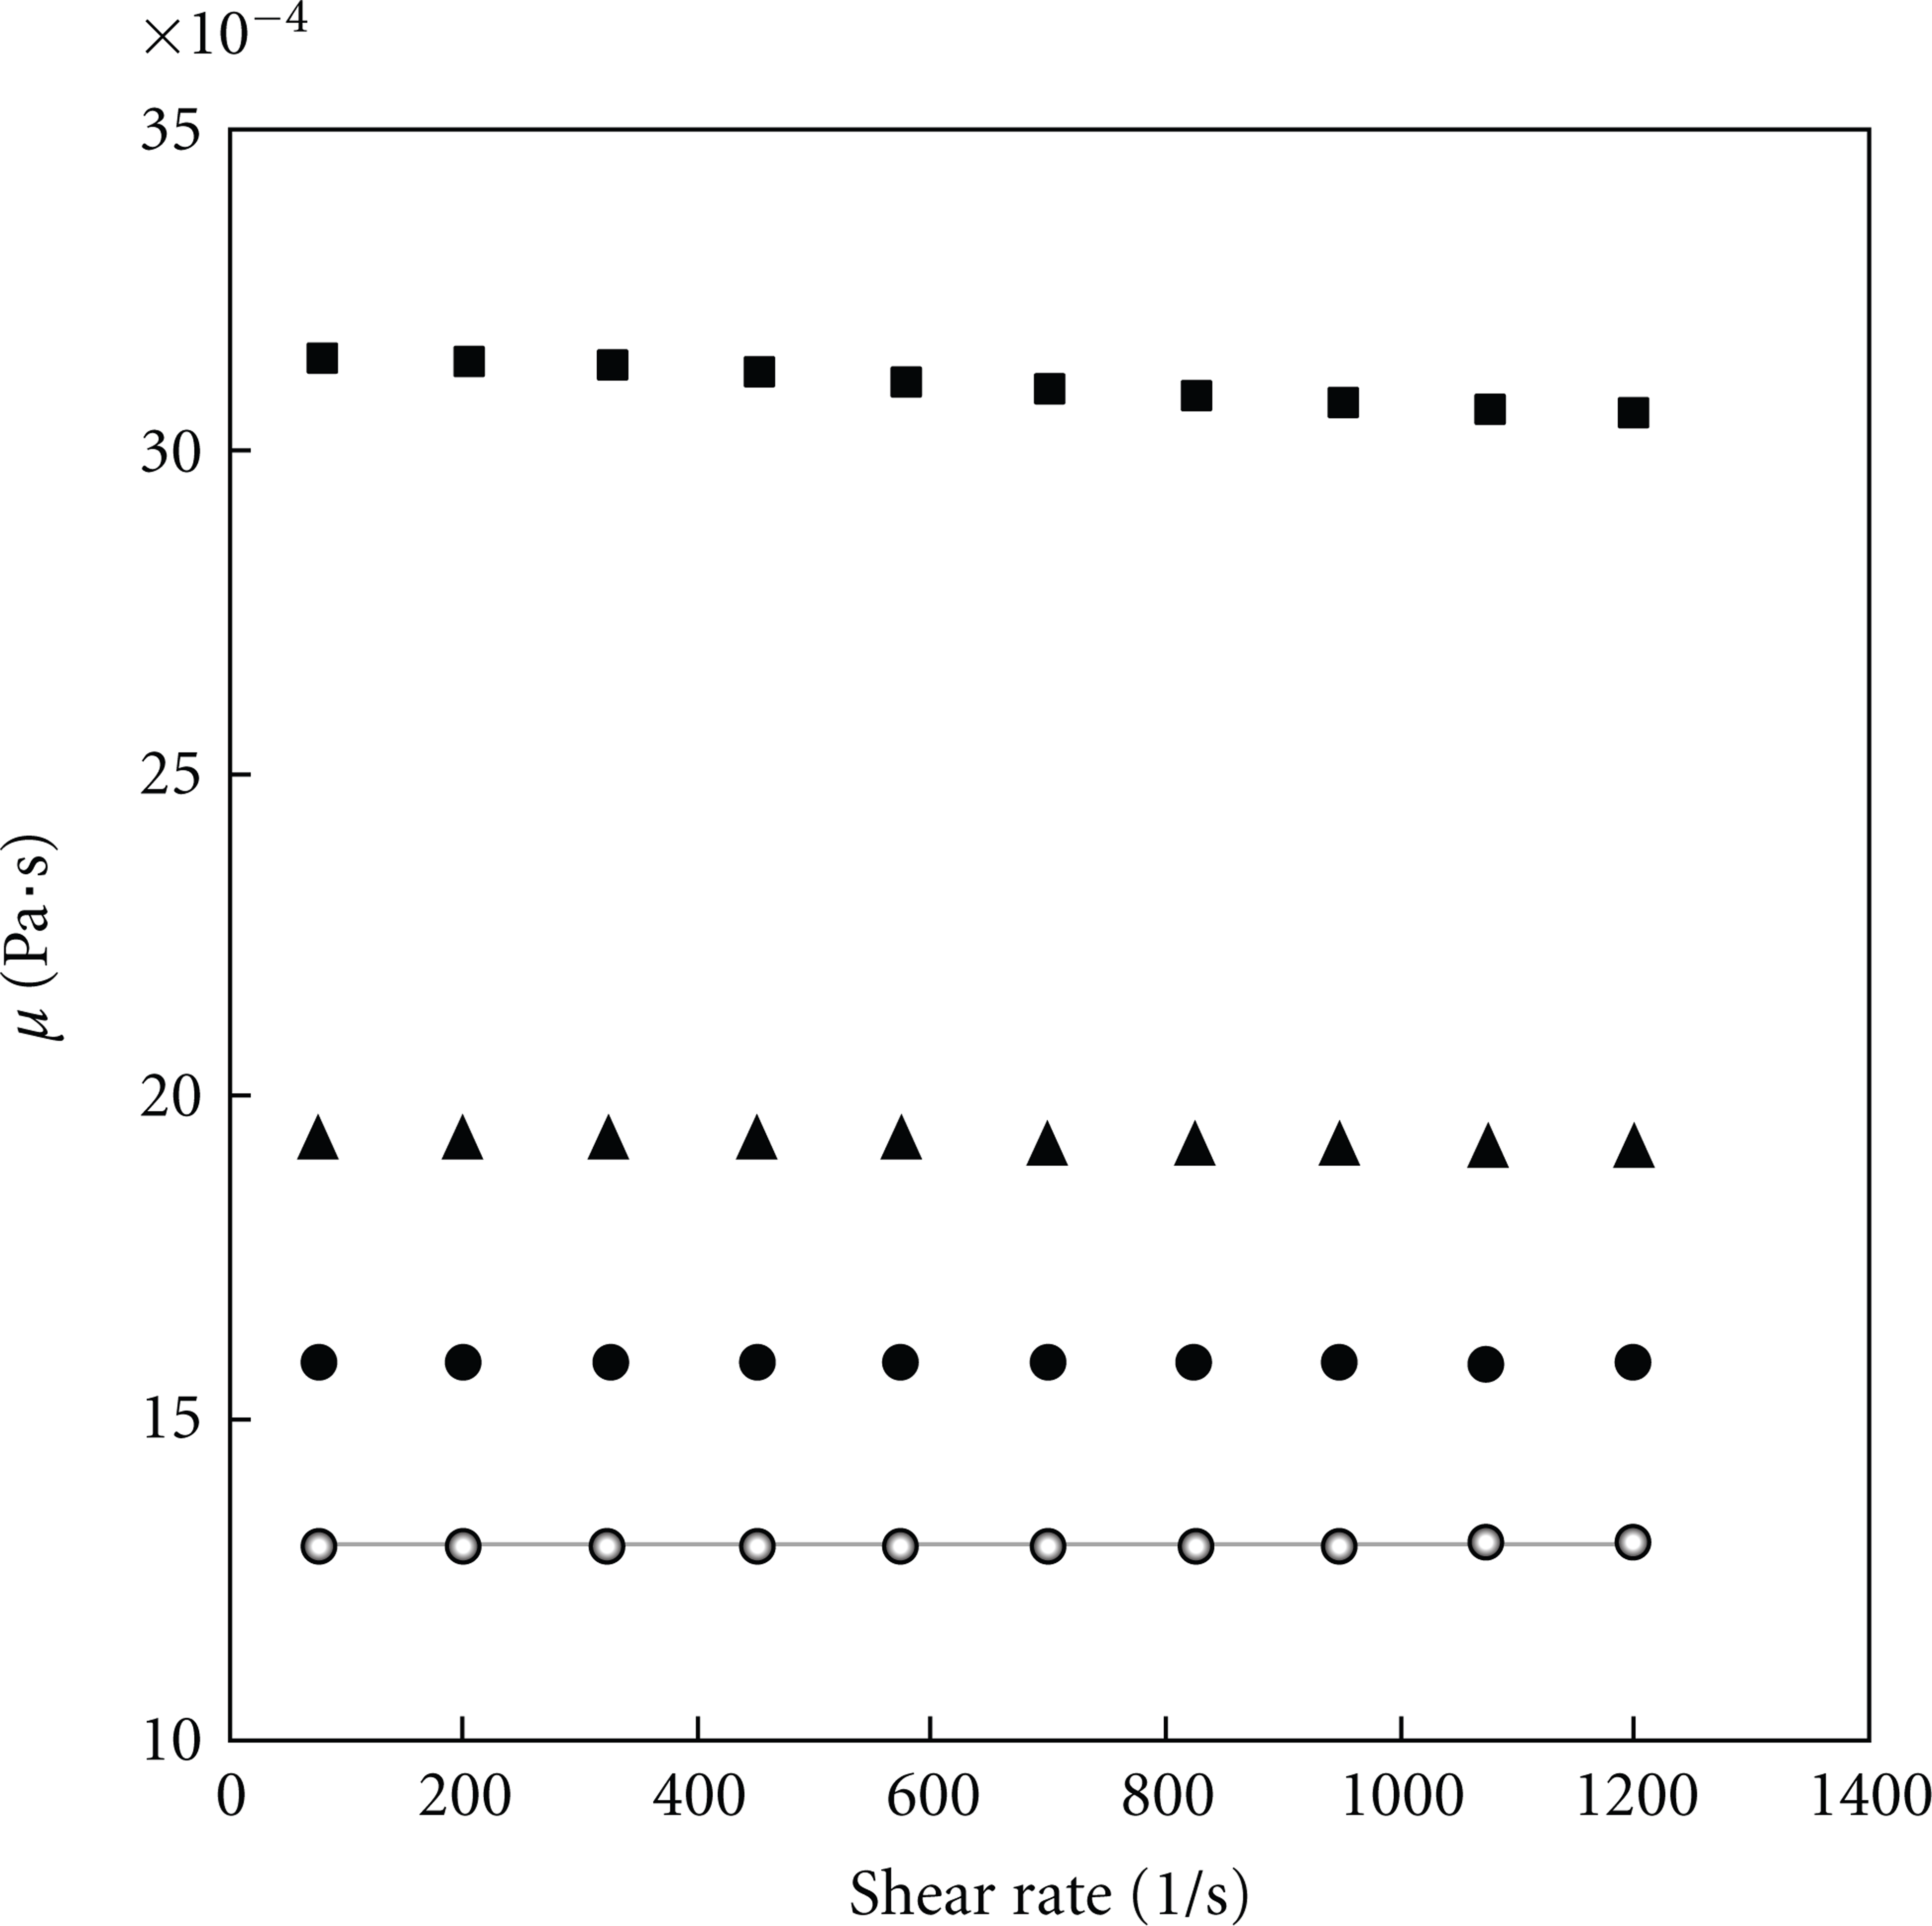
Dynamic viscosity of Fe2O3 at 10°C. (∘) water, (●) 5 wt%, (▲) 10 wt%, (■) 20 wt% compared to (—) Refprop 8.0.

Shear stress as a function of shear rate for water-Fe2O3 nanofluid at 30°C. (●) 5 wt%, (∆) 10 wt%, (▲) 20 wt%.
Figure 6 shows the trend of viscosity as a function of nanoparticles concentration at all temperatures. Viscosity improves in an exponential way at each temperature, reaching a maximum value of 0.00309 Pa·s at 20 wt% and 10°C. Viscosity decreases if temperature increases, with the same trend for all the concentrations.

Dynamic viscosity on mass fraction of water-Fe2O3 nanofluid at (●) 10°C, (▲) 30°C, (∘) 50°C, (∆) 70°C.
3.3. Comparison with Published Literature
The only study presented in literature on dynamic viscosity of hematite dispersed in water is [17], in which Phuoc and Massoudi observed the rheological properties of Fe2O3 water-based nanofluids in concentrations between 1 and 4% in mass. They found a non-Newtonian behaviour, but their results cannot be compared with ours because their concentrations are lower and they always used polymer dispersants which strongly affect rheological behaviour. No other study on thermal conductivity of Fe2O3 water-based nanofluids has been found.
3.4. Theoretical Models
3.4.1. Thermal Conductivity
In Figure 2, our results are compared with classical effective thermal conductivity model, known as Maxwell (1873) model [18]:

where k w and k p represent the thermal conductivity of water (the bulk liquid) and the added solid particles (15.42 W·m−1·K−1 [19]), respectively, and ϕis the particle volume fraction of the suspension (vol%).
At the lower temperature, the model overestimates the experimental results, but, starting from temperatures around 50°C, theoretical and experimental results are in quite good agreement.
In literature, several models have been proposed. Amongst these, few models have been chosen for comparison.
Bruggeman model [20] is based on the differential effective medium theory in order to estimate the effective thermal conductivity of composites at high particle concentrations:


Lu and Lin model [21] is used for spherical and nonspherical particles. The effective conductivity of composites containing aligned spheroids of finite conductivity was modelled with the pair interaction:
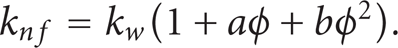
In the case of spherical particles, the values of the coefficients a and b are 2.25 and 2.27, respectively.
Xuan et al. model [22] is based on the Maxwell model and includes the effects of random motion, particle size, concentration, and temperature:
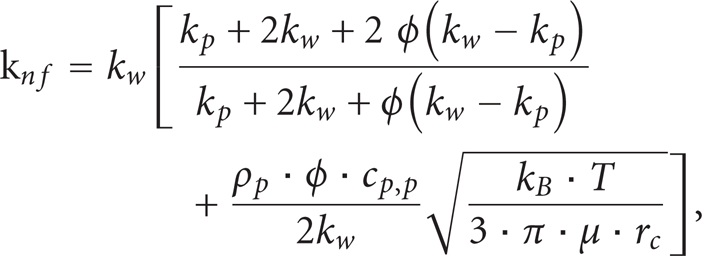
where T is the temperature, ρ
p
is the density of particles,
All these models were added to Figure 2, together with the experimental uncertainties. Their behaviour is very similar. They overestimate thermal conductivity values at temperature lower than 50°C, while they underestimate at higher temperature for all the nanofluids, although the data are always within the experimental uncertainties.
3.4.2. Dynamic Viscosity
In literature, several theoretical models have been proposed to predict the viscosity of a particle suspension. The most often used models derive from the Einstein model [23].
Brinkman extended the Einstein model to include particle volume concentration up to roughly 4% [24], in the form of

Here, ϕ is the particle volume fraction and μ n,f and μ f are the dynamic viscosity of the nanofluid and the based fluid, respectively.
In [25], Batchelor proposed a similar correlation considering the nanoparticle Brownian motion and their interaction:

In all these models a nanofluid is considered as a two-phase fluid and treated as a solid-liquid mixture. These equations base on the assumptions that the viscosity of the nanofluid is only a function of the base fluid viscosity and the particle concentration and that the nanoparticles can be modelled as rigid spherical particles. This assumption seems not correct for the systems nanofluids, which present specific properties and interactions not yet completely understood.
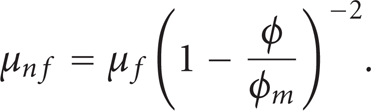
The effects of volume fraction ϕ and maximum volume fraction ϕ m on viscosity are described using the Krieger-Dougherty equation [26]:

where ϕ a is the effective aggregates volume fraction (and here it is considered as ϕ) and [η] is the intrinsic viscosity (for noninteracting, rigid spherical particles, 2.5).
A simplified equation was proposed [26] as
In order to apply (8) and (9), ϕ m should be calculated. Basing on [27], the maximum solid concentration can be estimated by

where α and β are calculated by the following equation [28]:

Basing on the experimental data α = 0.07298 and β = 0.03402, then ϕ m becomes 13.24.
A comparison between experimental data and equations is shown in Figure 8. Equations (6) and (7) overlap equation (8).
All these equations underestimated nanofluids viscosity, confirming their incapability to model this property for nanofluids.
Here, a simple equation, with similar form to (4), is proposed to correlate the experimental data:
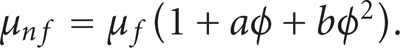
This equation was regressed basing on all experimental data for nanofluids and water viscosity calculated by [15] at the same temperatures. The regressed parameters are a = 18.64 and b = 248.30. As shown in Figure 7, this equation well represents the experimental data.


Mouromtseff number (Mo) for water-Fe2O3 in laminar flow.
3.5. Mouromtseff Number Analysis
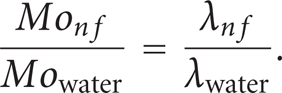
Thermal conductivity and dynamic viscosity experimental data were also used to evaluate the nanofluid thermal effectiveness, by means of the Mouromtseff number (Mo). It is a figure of merit to evaluate and compare the heat transfer capability of alternative thermal fluids [29]. Higher Mo numbers indicate higher heat transfer capability of the fluid, for a given geometry at a specified velocity.
In case of full developed internal laminar flow, it can be shown that the ratio of Mo numbers for each nanofluid on that of water is equal to the ratio of the respective thermal conductivities:
For internal turbulent flow, Mo number is given by

where ρ and c
p
are density and specific heat of the fluid, respectively, and they were calculated as volume weighted averages
Figures 8 and 9 show Mo number ratio as a function of temperature and concentration. For laminar flow, it is higher than 1, except for 5 wt% nanofluid at 10°C, and increases with nanoparticles concentration and temperature. Then, the heat transfer capability of water-Fe2O3 nanofluids is potentially higher than that of water if the flow is developed laminar.

Mouromtseff number (Mo) for water-Fe2O3 in turbulent flow.
On the contrary, in turbulent flow (the most significant for technological applications) Mo ratio is always lower than 1, with a minimum of 0.76 for 20 wt% and 70°C. It means that heat transfer capability of water-Fe2O3 nanofluids is potentially lower than that of water, due to the increase of viscosity produced by the addition of nanoparticles.
4. Conclusions
Fe2O3 water-based nanofluids have long time stability also at high concentration as 20 wt%. Thermal conductivity increases with mass fraction and with temperature. Thermal conductivity ratio is greater at the highest concentrations. The rheological behaviour of the nanofluids is Newtonian, and the dynamic viscosity increases considerably in respect of water, mainly at mass fraction of 20 wt%. Hence, the increment in thermal conductivity is combined with a rising in dynamic viscosity. Mouromtseff number indicates that, if the water-Fe2O3 nanofluids work in laminar flow, their heat transfer capability is potentially higher than that of water, but if the flow is developed turbulent, there is a loss in the heat transfer capability, due to the increase in viscosity. In order to experimentally measure the heat transfer capability, a new apparatus, able to measure the heat transfer coefficient, is going to be installed in our Institute.