
Abstract
Although significant advancements have been achieved in wireless sensor network (WSN) in the past decades, there is still a strong need for in-depth analysis on wireless time synchronization and data quality during field testing. In this paper, an academic WSN is adopted for output-only modal identification of two full-scale bridges in Xiamen, China. This paper first assesses the accuracy of time synchronization performed by the WSN through a centralized beacon signal and then studies wireless data quality using two quantitative performance indexes. The relationship between vibration amplitude and quality of wireless sensor data is investigated. With ambient bridge accelerations acquired by wireless sensing units, modal properties of the two bridges are identified using the stochastic subspace identification (SSI) method and the enhanced frequency domain decomposition (EFDD) method. Accuracies of the modal identification results are evaluated through comparison with modal properties identified from tethered sensing data. The comparison shows close match in natural frequencies and mode shapes, although relatively large difference in damping ratios exists between results from wireless and tethered sensing data. An overall close match between the wireless and tethered results demonstrates the feasibility of using WSN for the ambient vibration testing of full-scale bridges.
1. Introduction
Structural monitoring or testing is an important precaution for the safety of civil structures. Traditional tethered data acquisition systems (DAS) require extensive lengths of cables to transfer recorded data from sensors to a centralized data repository. Installation and maintenance of such tethered DAS on large scale civil structures is time consuming and expensive. In addition, tethered DAS would need cables spread all over the structure, which can disturb everyday functionality of the structure. Using wireless sensor network (WSN) to overcome the shortcoming of tethered DAS is not a recent idea. Early in 1998, Straser and Kiremidjian [1, 2] proposed to use WSN for monitoring civil structures. Since then, numerous innovative academic and commercial wireless sensing systems have been developed [3–11]. WSN is regarded as a promising technology for structural monitoring or testing, due to its low cost, easy installation, mobility, and embedded computational capability [12]. This emerging technology overcomes many drawbacks arising from traditional tethered DAS, which includes high installation cost, disturbance to everyday functionality of the structure, high maintenance cost, and very limited number of sensor nodes. As a result, WSN can bring significant advantages to structural health monitoring (SHM). Densely deployed WSN has been exploited to achieve high spatial resolution for accurately characterizing structural dynamic behaviors [13–15]. In this way WSN can provide more accurate structural damage localization than traditional tethered sensor network that is usually sparsely deployed. High-density WSN, to some extent, relieves the fundamental challenge caused by the sharp contrast between smaller number of sensor nodes and large number of degree-of-freedoms that is typical in finite-element models used for SHM. Moreover, the microprocessor in a wireless sensing unit can perform embedded computing to achieve on-board and distributed system identification and damage detection. Hereby wireless sensor has evolved into “smart” sensor [3, 6, 12].
Despite significant advancements being achieved in WSN over the past decade, more validation studies on the performances of WSN are essential before they can serve as economical and trustworthy substitutes to traditional tethered DAS. Field validation is necessary to accurately assess the performance of WSN within the complex and harsh environments posed by large-scale civil structures [6, 16]. Especially, although field experimental studies on WSN performance in civil structural applications have been reported [3, 7, 8, 14–18], quantitative research about data quality is still lacking. In addition, time synchronization is another major concern for applying WSN on structural vibration testing. Asynchronous wireless sensing data usually results in errors in mode shape identification [19]. Lynch et al. [15] investigated the time synchronization problem of a single-hop WSN deployed at Geumdang Bridge located in Icheon, Korea. To assess the time synchronization accuracy of WSN, the researchers proposed a classical method that performs time step shifting to achieve the minimum error norm between wireless and tethered sensor data. Despite this initial study, time synchronization of wireless sensor data can be evaluated through more extensive vibration tests using new analysis methods.
Vibration modal parameters are important dynamic properties of structures, which are determined by structural properties (such as mass and stiffness) and may reflect potential damage [20]. To perform vibration testing on a large-scale civil structure in the field, it is generally difficult to excite structural vibrations in a systematic and effective manner. Therefore, output-only modal identification, which only requires structural vibration response measurements, is regarded as a practical way to determine the dynamic characteristics of civil structures. Benefiting from low cost and easy installation, WSN has been adopted for dynamic testing that aims to identify structural modal parameters [8, 14, 15]. However, the accuracy of modal identification results associated with wireless data quality should be carefully investigated.
This paper presents field experimental studies using a dense WSN for the output-only modal identification of two bridges and evaluates the effect of wireless sensor data acquisition on modal identification accuracy. Time synchronization error and data quality of WSN will be assessed using quantitative indexes, through comparison with tethered sensing data. Two bridges, Baicheng Footbridge and Wuyuan Bridge in Xiamen, China, are selected as a test-bed for short-span and long-span bridges, respectively. The academic prototype wireless sensing unit developed by Wang et al. [16] is employed in the field experiments. Since coaxial cables provide a relatively reliable communication link, a tethered DAS is also installed on the bridge for comparison. Time histories of acceleration responses collected by the WSN are compared with those obtained by the tethered system. Based on the synchronized tethered sensor data, the accuracy of a wireless beacon-based time synchronization approach is evaluated using normalized correlation function. Furthermore, the errors of wireless sensing data are quantitatively assessed with regard to signal waveform and magnitude, through two data quality indexes. Using acceleration data measured by the WSN, the natural frequencies, damping ratios, and mode shapes of the two bridges are identified using the stochastic subspace identification (SSI) and enhanced frequency domain decomposition (EFDD) algorithms. The modal parameters identified using wireless sensing data are compared with these identified from tethered sensing data. A short discussion is provided regarding the effect of wireless sensor data quality on modal identification accuracy.
2. Wireless Sensing Units and Wireless Sensing Network
Figure 1 shows the academic prototype wireless sensing unit developed at University of Michigan and Stanford University [15, 16]. The wireless sensing unit consists of three functional modules: sensor signal digitizer, computational core, and wireless communication module. The main component of the sensor signal digitization module is a 4-channel 16-bit analog-to-digital (A/D) converter (Texas Instruments ADS8341), which offers a maximum sampling frequency up to 100 kHz. Each wireless sensing unit can accommodate signals from a variety of structural sensors, as long as their outputs are analog voltages from 0 to 5 V. The wireless sensing unit can remotely measure various physical parameters, such as acceleration, velocity, displacement, stain, and temperature. In addition, the 16-bit resolution A/D converter is sufficient for most applications in civil structural monitoring. However, it is worth noting that the resolution of A/D converter would only determine data quality if the smallest measurable voltage is larger than a product between the sensor noise floor and amplification factor of associated signal conditioning circuit.
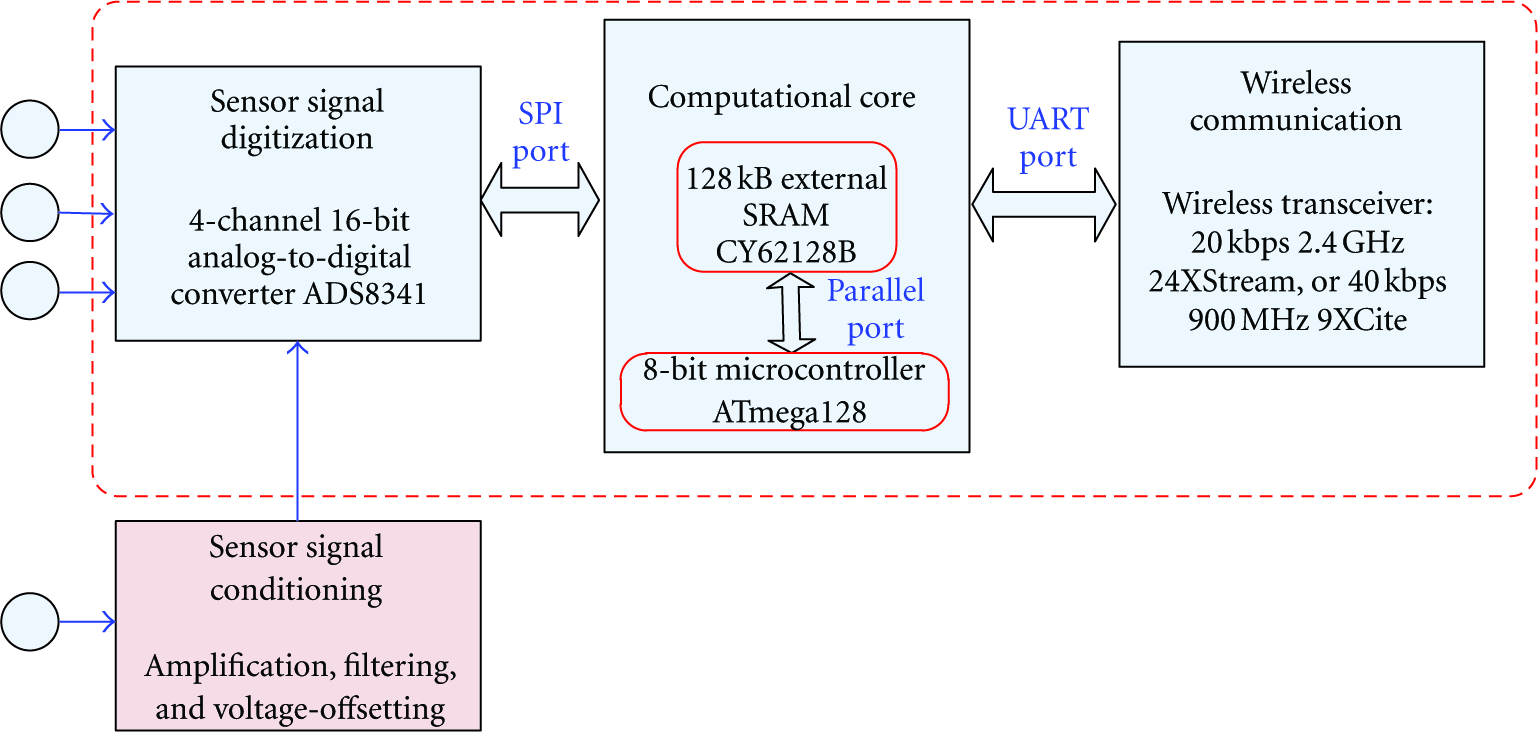
Functionalmodules of the prototype wireless sensing unit.
The computational core of the wireless unit is responsible for executing embedded software instructions for engineering analyses. A low-cost 8-bit microcontroller (Atmel ATmega128) is selected as the principal component of the computational core. The wireless sensing unit is designed to be operable with two wireless transceivers: 900 MHz MaxStream 9XCite and 2.4 GHz MaxStream 24XStream. Although the 9XCite module consumes significantly less amount of power, the 24XStream transceiver is selected as the wireless communication module in this study according to public radio frequency regulation in China. The 24XStream transceiver can offer up to 5 km line-of-sight communication range [21]. During transmitting, the transceiver consumes a maximum of 150 mA current and emits a 50 mW electromagnetic signal. During receiving, the current consumption is 80 mA. Consequently, adding the current consumption of other components in the wireless sensing unit, the overall current consumption of the unit is about 180 mA while transmitting, and 110 mA while receiving.
As shown in Figure 1, before feeding the sensing signals into a wireless sensing unit, a sensor signal conditioning board can be adopted. Three major functions of the circuit board are offsetting, filtering, and amplification. Figure 2(a) shows printed circuit board (PCB) of the signal conditioning circuit. The signal conditioning circuit provides a band-pass filter with the passing frequency band set at 0.014–25 Hz, which is suitable for modal vibration tests with most civil structures. Three amplification factors (5, 10, and 20) are available with the signal conditioning board. Figure 2(b) shows a fully assembled wireless sensing unit.

Photos of the prototype wireless sensing unit.
As illustrated in Figure 3, a single-hop WSN is employed, with one central server directly communicating with all wireless sensing units. Another approach to address the transmission range issue is through multihopping with relatively short-range wireless transceivers. Compared with single-hopping with relatively long-range transceivers, both approaches have pros and cons. Under scenarios where significant obstruction cannot be penetrated by the wireless signal, multi-hopping through relay units can potentially circumvent the obstruction. On the other hand, reliable multi-hopping requires more complicated middleware implementation on the wireless sensing units; relaying data through multiple wireless sensing units also causes greater communication latency. Furthermore, all relaying nodes along the hopping path have to consume some amount of battery power for transmitting a single packet. For this study, benefiting from the long communication distance of the 24XStream transceiver, the single-hop WSN is sufficient for the ambient vibration tests with the two test-bed bridge structures, particularly when the deployment is divided into several test setups with the aid of a reference point.
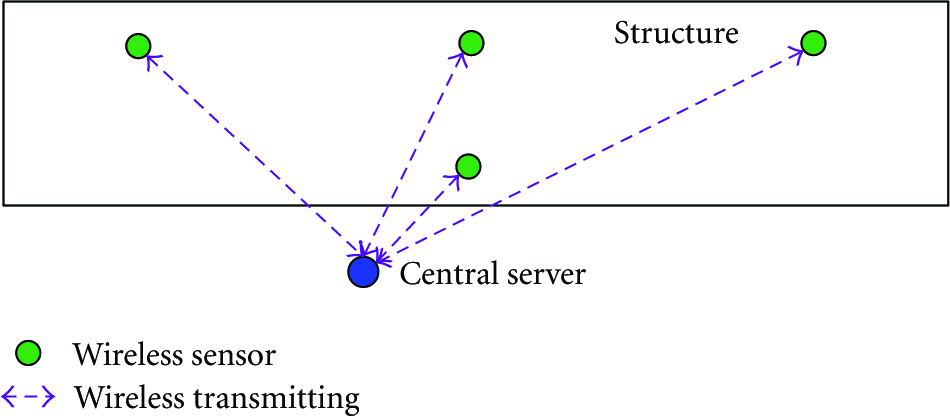
Single-hop wireless sensor network.
3. Mathematical Tools
3.1. Time Synchronization Assessment
Time synchronization for data collected by multiple wireless sensor nodes is an important concern in wireless sensor network. When the central server broadcasts a beacon signal to all the wireless sensing units, the units would not receive this beacon at precisely the same time. The timing difference can usually lead to synchronization error at around tens of microseconds [16]. Furthermore, the wireless sensing units cannot share a common data repository clock as tethered DAS, and the crystal clocks of wireless sensing units gradually diverge from each other [22]. The unavoidable time shift in the crystal clocks of wireless sensing units would accumulate to a large time synchronization error over time. As a result, time synchronization error should be considered in WSN application for structural vibration monitoring. The time synchronization error possesses certain innate randomness, which makes it challenging to completely eliminate in data after processing. Although asynchronous data would oftentimes not affect the identification of damping ratios and natural frequencies, such data usually result in errors in identified mode shapes [19, 23]. Therefore, the time synchronization accuracy of WSN should be carefully assessed through field experimental studies.
In this paper, cross-correlation function is employed for identifying the time synchronization error of the single-hop WSN in field experimental studies. The cross-correlation function quantifies the waveform similarity or correlation between two time series (or signals) as a function of a time shift (i.e., the time delay or time-lag) applied to one of them [24]. It is well known that cross-correlation function has been employed to estimate the travel time in the time-of-arrival (TOA) method for GPS positioning or locating wireless nodes. Typically, the TOA is estimated by the time shift corresponding to the maximum cross-correlation value between a received signal and a known transmitted signal [25]. In a similar way, cross-correlation function is evaluated between a time-shifted wireless signal and a reference (benchmark) tethered signal, in order to identify the actual time-lag between these two signals. The cross-correlation function between two continuous time series

where τ is the lag or time shift. For numerical computation, the cross-correlation function between two discrete time series

In addition, the standard or normalized cross-correlation function between two time series
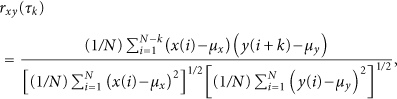
where

Two signals and the corresponding cross-correlation function.
As demonstrated by numerous studies in wireless structural health monitoring, a well-designed wireless sensing unit usually provides very close waveform to a reference tethered signal (collected side-by-side at the same location). Hence, cross-correlation function between a wireless sensor signal and the reference tethered signal can be calculated to find the time lag between them, which is simply identified from the time shift
3.2. Data Quality Index
Data quality of WSN, to a certain extent, determines its suitability for ambient vibration tests and SHM. It can be challenging to obtain high-fidelity and accurate wireless sensing data in ambient vibration tests and SHM applications, because of limited capacity of on-board A/D conversion and on-board signal conditioning [7, 15, 16]. Lynch et al. [15] pointed out that the effective resolution of an onboard A/D converter is usually slightly lower than its nominal value, which poses a significant challenge in low-magnitude vibration measurement. In addition, the performance of classical amplifier and passive filter without power supply is expected to provide performance inferior to that of more powerful counterparts used in tethered DAS. Third, data loss during wireless transmission is also a concern. All these factors would results in data quality problem, so the data quality of WSN needs to be carefully investigated by quantitative indexes and through field tests. As mentioned before, although a number of field tests on WSN performance in full-scale structural applications have been reported [3, 7, 8, 14–18], quantitative research about data quality is rarely found up to date. Therefore, this paper adopts two data quality indexes for wireless data quality assessment. The conditions for high data quality and low data quality are identified, respectively, and a discussion follows on their influences on output-only modal identification.
The aforementioned cross-correlation function can measure the waveform similarity between two signals. Because tethered sensing data are expected to be more accurate than wireless sensing data, the tethered data is used as a reference signal to examine the quality of wireless sensing data. This paper adopts the correlation coefficient as an indicator for the quality of wireless sensing data, after shifting the wireless data according to the lag. Correlation coefficient is a special case of the cross-correlation function when time lag k is equal to zero. The correlation coefficient (CC) between wireless data

A correlation coefficient

3.3. Output-Only Modal Identification
Two popular methods for output-only modal parameter identification are the enhanced frequency domain decomposition (EFDD) method in frequency-domain [28] and the stochastic subspace identification (SSI) method in time domain [29, 30]. A short and brief summary of the methods is provided herein. The original references by Brincker et al. [28], van Overschee and de Moor [29], and Peeters and de Roeck [30] are strongly recommended for interested readers. In addition, the modal assurance criterion (MAC) is employed to examine the consistency of mode shape identification based on wireless and tethered sensing data.
3.3.1. Enhanced Frequency Domain Decomposition (EFDD)
In the EFDD method, the relationship between the unknown input

in which
3.3.2. Stochastic Subspace Identification (SSI)
In state-space formulation, the system input vector can be formulated to contain various white noise vectors, including force excitation, process errors, and measurement noises. As a result, a multi-degree-of-freedom linear structure can be represented as a stochastic state-space model, which is given by

where
3.3.3. Modal Assurance Criterion (MAC)
Modal assurance criterion (MAC) is widely used to provide an additional confidence evaluation in mode shape identification. The function of the MAC is to provide a measure of consistency (degree of linearity) between estimated mode shape vectors [31]. The MAC between different mode shapes identified based on wireless and tethered sensing data is given by

in which
4. Experimental Setup
In order to validate and assess the performance of WSN, two full-scale bridges located in Xiamen, China, were selected as the test-beds. The WSN and traditional tethered DAS were installed in the two test-beds for measuring ambient vibration.
4.1. Test-Bed 1: Baicheng Footbridge
Baicheng Footbridge, a one-side cable-stayed steel footbridge located at Baicheng beach, is on southeast part of the campus of Xiamen University in China. Figure 5 shows the picture and elevation drawing of the footbridge. The total length of Baicheng Footbridge is 72.2 m, which consists of three spans (12.1 m + 48.8 m + 12.1 m). The steel box girder of the bridge is a space-curved beam, consisting of one circular arc in elevation and three independent circular arcs in plan view. Due to its complex shape, the Baicheng Footbridge possesses somewhat complicated dynamic characteristics. In addition, this footbridge is susceptible to pedestrian loading and occasionally suffers excessive vibration. Hence, this Footbridge was selected as a test-bed for evaluating the performance of the WSN.

Picture and elevation of Baicheng Footbridge.
To investigate the performance of the WSN, a traditional DAS is also installed in parallel. Both the wireless and tethered systems employ accelerometers to measure the ambient vibration in the vertical and radial directions of the bridge deck. Optimal sensor placement is a critical issue in SHM, many methods have been proposed in the last decade [32–36]. Some widelyaccepted methods intrinsically concentrate on positions with high energy content (or positions with large vibration magnitude), resulting in sensors quasi-uniformly spaced and symmetrically deployed [32]. Consequently, a uniform and symmetric sensor placement scheme is employed. Figure 6 shows that the accelerometers are mounted in locations marked as

Locations of sensors on bridge deck.

Tethered and wireless sensors installed on bridge deck.
Table 1 shows the test setups of Baicheng Footbridge ambient vibration test. Due to the limitation of bandwidth capacity, three sets of vibration tests (setup number 1~3) are first conducted to collect data from the sensors with a sampling frequency of 50 Hz. For time synchronization error assessment, another two scenarios (setup numbers 4 and 5) are deployed with a sampling frequency of 50 Hz and 100 Hz, respectively. Both WSN system and tethered DAS (INV306) use the low pass filter with the same cut-off frequency of 25 Hz. Each test setup was repeated several times, depending on the data quality. The duration of each testing is 300 seconds. Table 2 shows the accelerometers adopted in the Baicheng ambient vibration test. The 891-II type accelerometer was used to measure vertical accelerations, while the piezoelectric type accelerometer was adopted to measure radial accelerations.
Setups for ambient vibration tests at Baicheng Footbridge.

Parameters of accelerometer.

4.2. Test-Bed 2: Wuyuan Bridge
Wuyuan Bridge, located in the island ring road in Xiamen, China, is the first sea-crossing steel box arch bridge constructed in China (Figure 8). The bridge construction was finished in 2003. The total length of Wuyuan Bridge is 810 m and the width of the bridge deck is 34 m. As shown in Figure 8, the 3-span bridge (main span is 210 m long with two 58 m-long side spans) is a half-through X-style arch bridge consisting of steel-reinforced concrete girders and steel arch ribs. The arch has a ratio of rise to span equal to 1/4, with a second-degree parabolic shape. There are 9 strut rails on the arch to enhance the stability of the bridge in transverse direction.

Side view of Wuyuan Bridge.
In the Wuyuan Bridge ambient vibration test, vertical and transverse responses of the bridge deck and arch ribs were measured using both wireless and tethered accelerometers. For comparing the data quality of these two bridges tests, the same accelerometers were used in the ambient tests, as shown in Table 2. A signal conditioning circuit board is included in each wireless sensing unit to offset the sensor signals to have mean value of 2.5 V and to filter and amplify the weak and noisy ambient responses of the bridge. Amplification factor 20x is used for each wireless sensing unit. Due to the limitation of bandwidth capacity of 24XStream wireless transceiver, only 12 sensing units can simultaneously transmit data to the laptop (central server) when the sampling frequency is set to be 50 Hz. Five sets of vibration tests are carried out to collect data from the sensors locations in Figure 9. For assessing the data quality of wireless sensing data, acceleration responses at the same locations shown in Figure 9 were simultaneously measured by INV306 DAS with a sampling frequency of 50 Hz also. Different from the WSN, the tethered DAS used a 100x amplification factor. The low-pass filter cut-off frequency of tethered DAS is 25 Hz, which is the same as WSN. Table 3 shows the specific test setups of the Wuyuan Bridge ambient vibration test. In each testing, a total of 18,000 data points were measured with the duration of 360 seconds for both wireless and tethered systems, and each test setup was repeated several times for ensuring the quality of modal identification.
Setups for ambient vibration tests at Wuyuan Bridge.

*V: vertical; *T: transverse.

Measurement locations during ambient vibration test at Wuyuan Bridge.
5. Results
This section discusses the testing results, with respect to the time synchronization of wireless sensing units, wireless sensing data quality assessment, and the output-only modal identification of Baicheng Footbridge and Wuyuan Bridge.
5.1. Time Synchronization Assessment
A limitation of WSN is the absence of a centralized clock; therefore, time synchronization is an important issue for WSN. The prototype wireless sensing unit used in this study is designed to synchronize its internal clock to a beacon signal broadcast from the centralized data repository. To validate the accuracy of wireless synchronization within a realistic field environment, the time lags between wireless sensing data and cable-based sensing data are investigated.
Three test scenarios for wireless synchronization assessment were carried out in Baicheng Footbridge test, as shown in Table 4. The sampling frequency is 50 Hz for test 1, and 100 Hz for test 2 and 3. Since the analysis resolution for time synchronization error is bounded by sampling interval, the wireless and tethered raw data were first up-sampled to 1 kHz sampling rate through interpolation. Figure 10(a) shows the normalized cross-correlation function of the two acceleration responses (wireless and tethered) recorded at measurement point number 4 of Baicheng Footbridge. With the aid of cross-correlation functions, a consistent time difference around 8.554 seconds (8554 sampling intervals at 1 kHz) between wireless and tethered data is identified at all nodes of test 1. This result illustrates that the time synchronization error of the single-hop WSN is all less than one sampling interval (
Estimation of time synchronization error for the entire measurement duration.


Normalized cross-correlation function between wireless and tethered sensing data.
Similar experimental results are achieved in Wuyuan Bridge test. Figure 10(b) shows the normalized cross-correlation function between wireless and tethered data recorded at measurement point #1 of Wuyuan Bridge. Again, a consistent time difference between wireless and tethered data is observed at all sensor locations except at measurement point #18 and 23. The time synchronization error among the wireless sensing nodes is found to be not more than 1 ms, as shown in Table 4. Overall, the two field experimental studies demonstrate that the time synchronization errors of the single-hop WSN are bounded by 3 ms, for the entire duration of the measurement. Therefore, beacon-based time synchronization algorithm in the single-hop network is quite effective and can provide highly accurate synchronized sensing.
5.2. Quality of Wireless Sensing Data
After being shifted according to the wireless-tethered time lag shown by correlation function, the acceleration time history collected by WSN is compared with the tethered baseline signals. Figure 11(a) shows the acceleration time histories recorded by the wireless sensing units at location #4 of Baicheng Footbridge, which matches well with those by the traditional cable-based DAS. The minor differences between amplitudes of the signals are due to several factors. Generally, the major error sources of wireless sensing include the relatively low resolution of onboard A/D converter, the limited abilities of prototype signal conditioning circuit, imperfect filtering, and variant sampling interval. Figure 11(b) shows the Fourier spectra of wireless and tethered sensing data, which are also in good agreement. Similar close match has also been found in the Wuyuan Bridge test, as shown in Figure 12.
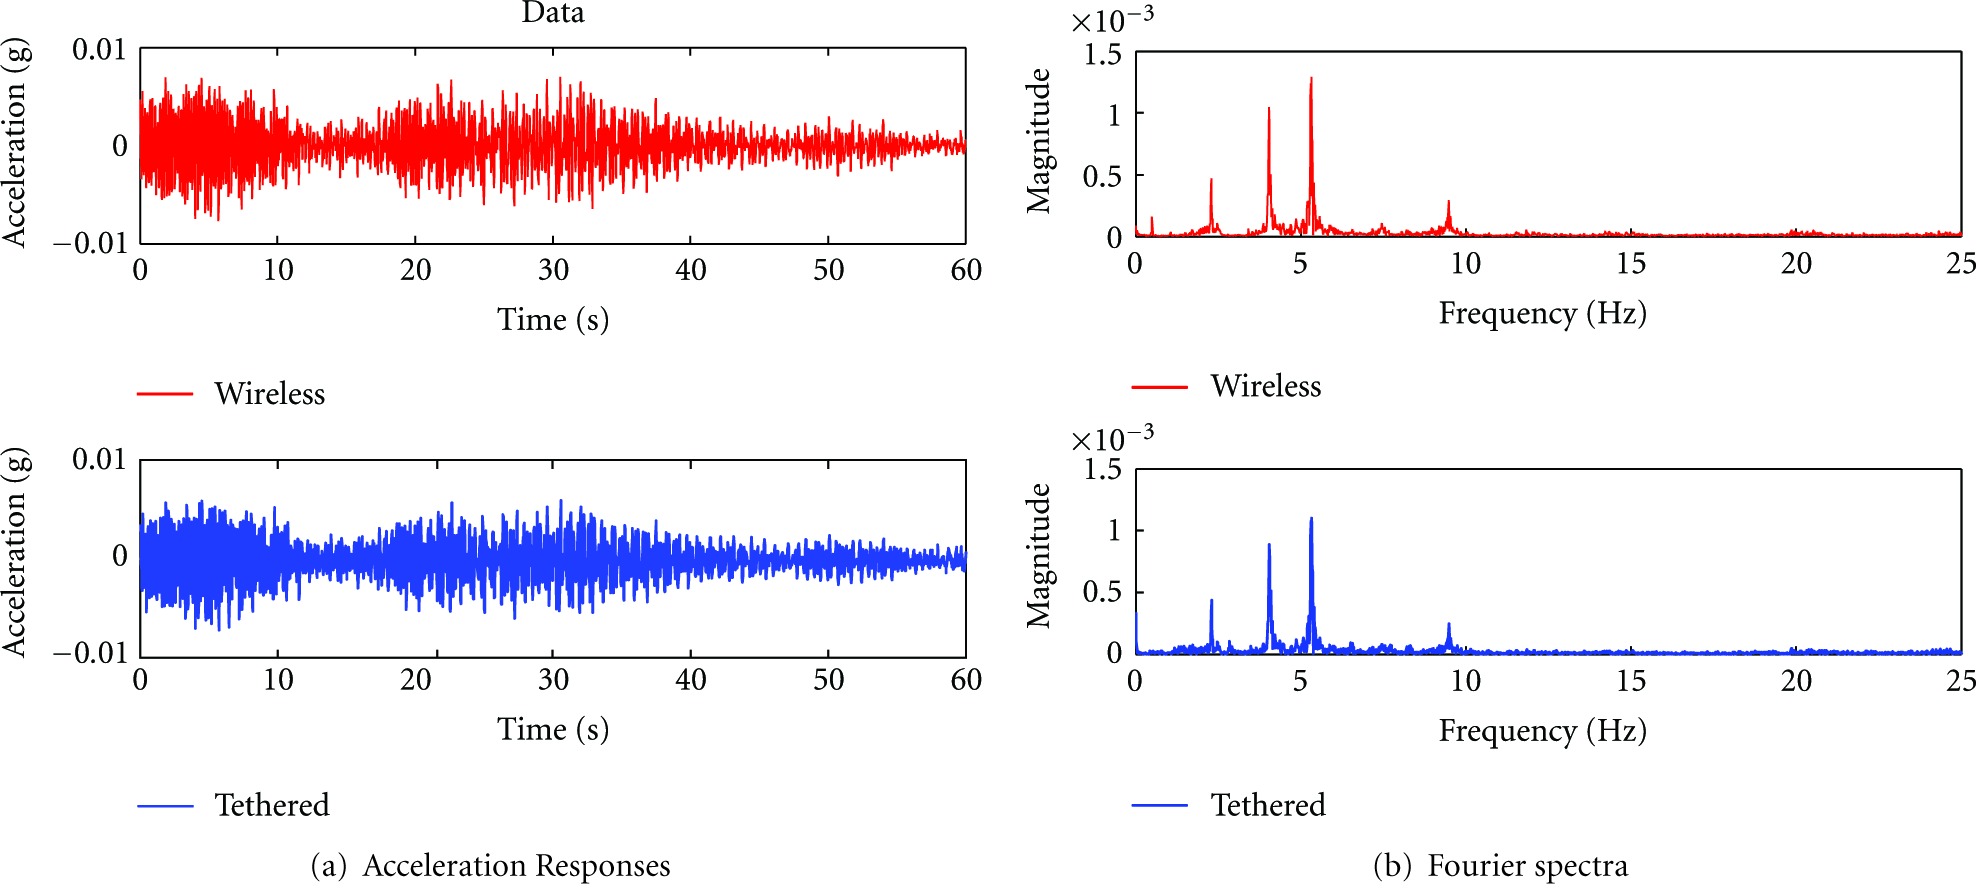
Comparisons of acceleration time history and frequency spectra at sensor location number 4 (Baicheng Footbridge Test).

Comparisons of acceleration time history and frequency spectra at sensor location number 1 (Wuyuan Bridge Test).
Furthermore, for assessing the wireless data quality quantitatively, two data sets (wireless and tethered data, sampling frequency: 50 Hz) from the Baicheng Footbridge test and the Wuyuan Bridge test are selected to calculate the data quality indexes. First, each data set is divided into many short data segments (5 seconds, i.e., 250 data points per segment). Then, (4) and (5) are used to calculate the data quality indexes, including correlation coefficient (CC) and percent root-mean-square difference (PRD). Figure 13 shows the CC change with the vibration magnitudes. When the (root-mean-square) RMS vibration amplitude is larger than 1 mg (accelerometer output voltage changes by 0.98 mV), the CC index increases from 80% to 97%, which suggests a high waveform similarity between wireless and cable-based sensing data. However, the CC index sharply declines when the RMS vibration amplitude is less than 1 mg in both cases. Figure 14 shows the relationship between PRD and vibration amplitude. The PRD is usually in the range from 10% to 22%, when the vibration level is larger than 1 mg RMS acceleration.

Correlation coefficient (CC) index variation with vibration magnitude.
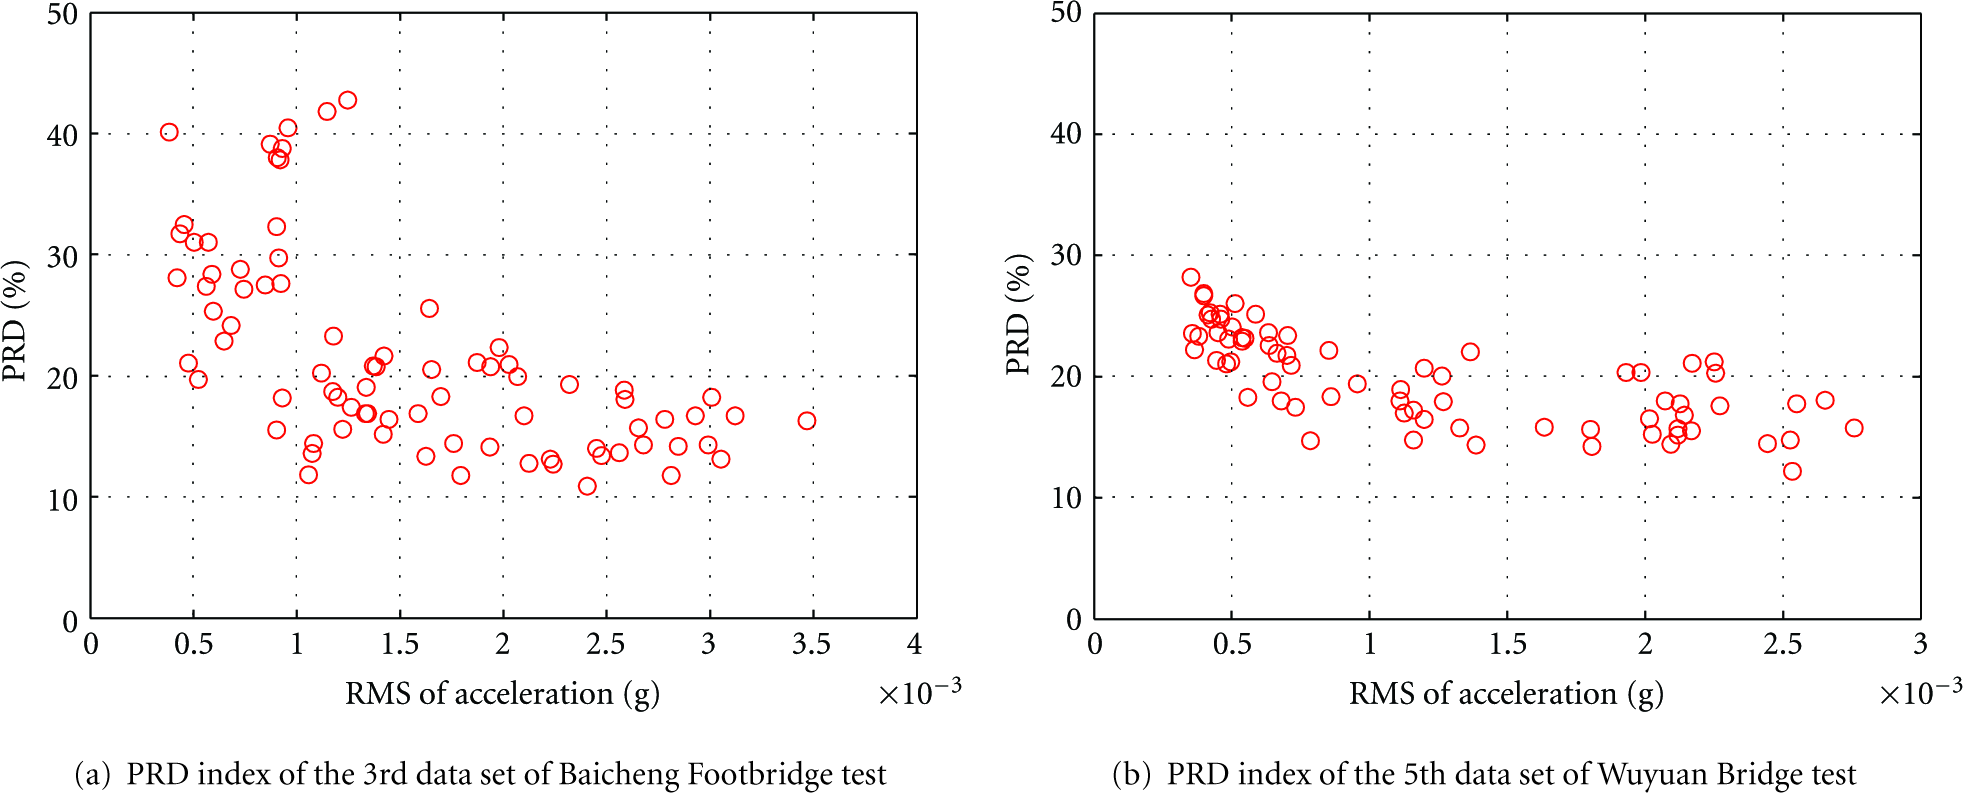
Percent RMS difference (PRD) index variation with vibration magnitude.
As indicated by the CC and PRD indexes, the wireless and tethered data do not so “perfectly” match each other even in high vibration amplitudes, because the wireless and cable-based sensing both have different noise sources, that is, different data acquisition systems generate different measurement noises even their signal-to-noise ratios (SNR) are identical. Secondly, both CC index and PRD index are amplitude-dependent. When the vibration amplitude is larger than 1 mg, or equivalently, the analog sensor signal change is larger than 1 mV, high quality wireless sensing data can be expected. However, it is challenging to guarantee the data quality when the vibration amplitude is less than 1 mg RMS acceleration, or when the analog sensor signal change is less than 1 mV. Several factors may account for the measurement errors of wireless sensing unit at low vibration amplitude, for instance, resolution of A/D converter, inaccuracy of amplification and filtering circuit, circuit noise of sensor board, and the resolution of accelerometer. Higher resolution of A/D converter and more powerful signal conditioning circuit are helpful to achieve better performance with wireless data for extremely low-magnitude measurement. The prototype wireless sensing unit can perform well during the ambient vibration test when average RMS acceleration is larger than 1 mg. The peak vertical accelerations of the two bridges are 20 mg (Baicheng Footbridge) and 14 mg (Wuyuan Bridge) in the two field tests, respectively. Consequently, the data collected by the single-hop WSN in the two bridges are of high quality and sufficient for the output-only modal identification.
5.3. Results of Output-Only Modal Identification
The EFDD and SSI are employed for the identification of Baicheng Footbridge and Wuyuan Bridge based on the ambient acceleration responses collected by the wireless sensing units. In addition, the modal identification using cable-based sensing data are also conducted for examining the accuracy of the modal identification results from wireless measurements.
5.3.1. Modal Identification Results of the Baicheng Footbridge
Output-only modal identification usually demands lots of data for more precise analysis. A total length of 780 seconds of acceleration data, with 39,000 wireless sensing data points at each channel, are collected for modal identification of the Baicheng Footbridge. Meanwhile, a total length of 409.6 seconds of acceleration data, with 20,480 data points per channel, is measured by the cable-based DAS to estimate the modal parameters.
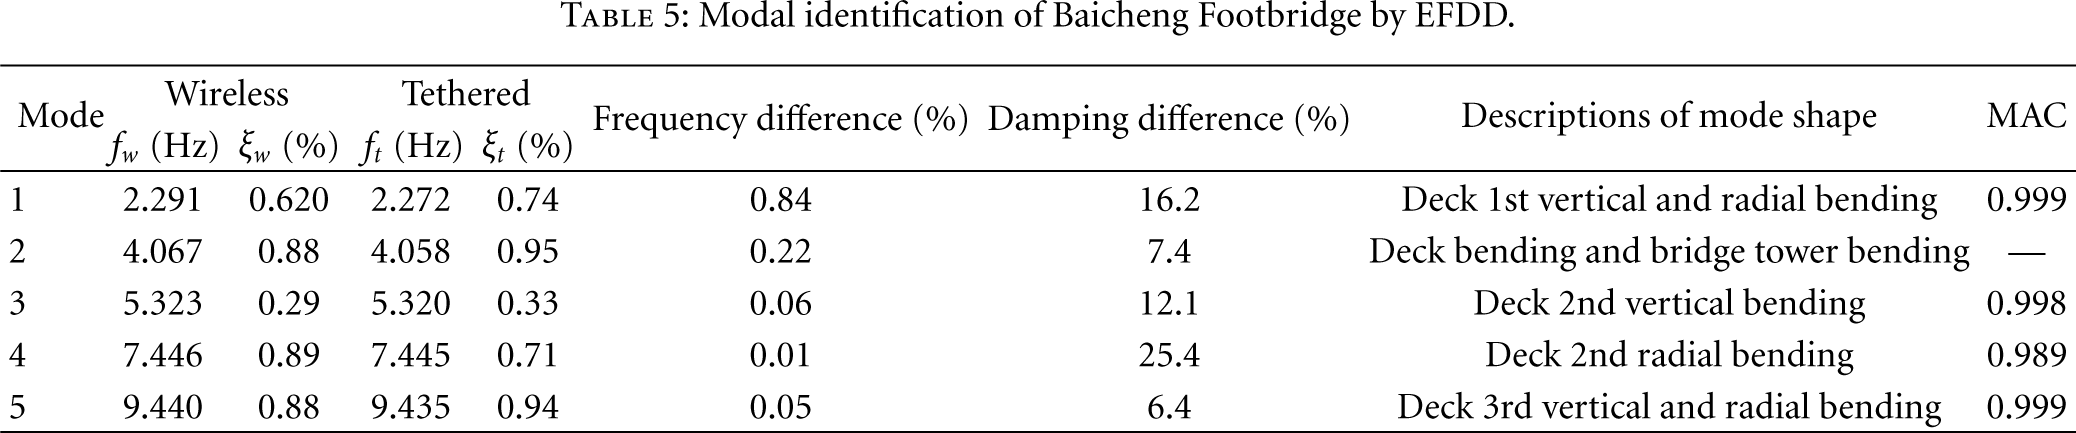
Figure 15 shows the singular values of the power spectral density (PSD) matrix based on the acceleration responses measured by WSN and cable-based DAS, respectively. The five peaks are very clear and well separated from each other. The identified natural frequencies and damping ratios of the first five modes of the footbridge are summarized in Table 5. For evaluating the accuracy of the modal identification using wireless sensing data, the results identified by EFDD using tethered data are also presented in Table 5. It can be observed that the identified natural frequencies of wireless system match well with those of tethered system. The relative differences of natural frequencies identified by the two types of data vary from 0.01% to 0.84%, with an average value of 0.236%. A close match between wireless and tethered results is also found in the identified mode shape. MAC values shown in Table 5 are quite high, from 0.989 to 0.999 with an average value of 0.996.
Modal identification of Baicheng Footbridge by EFDD.
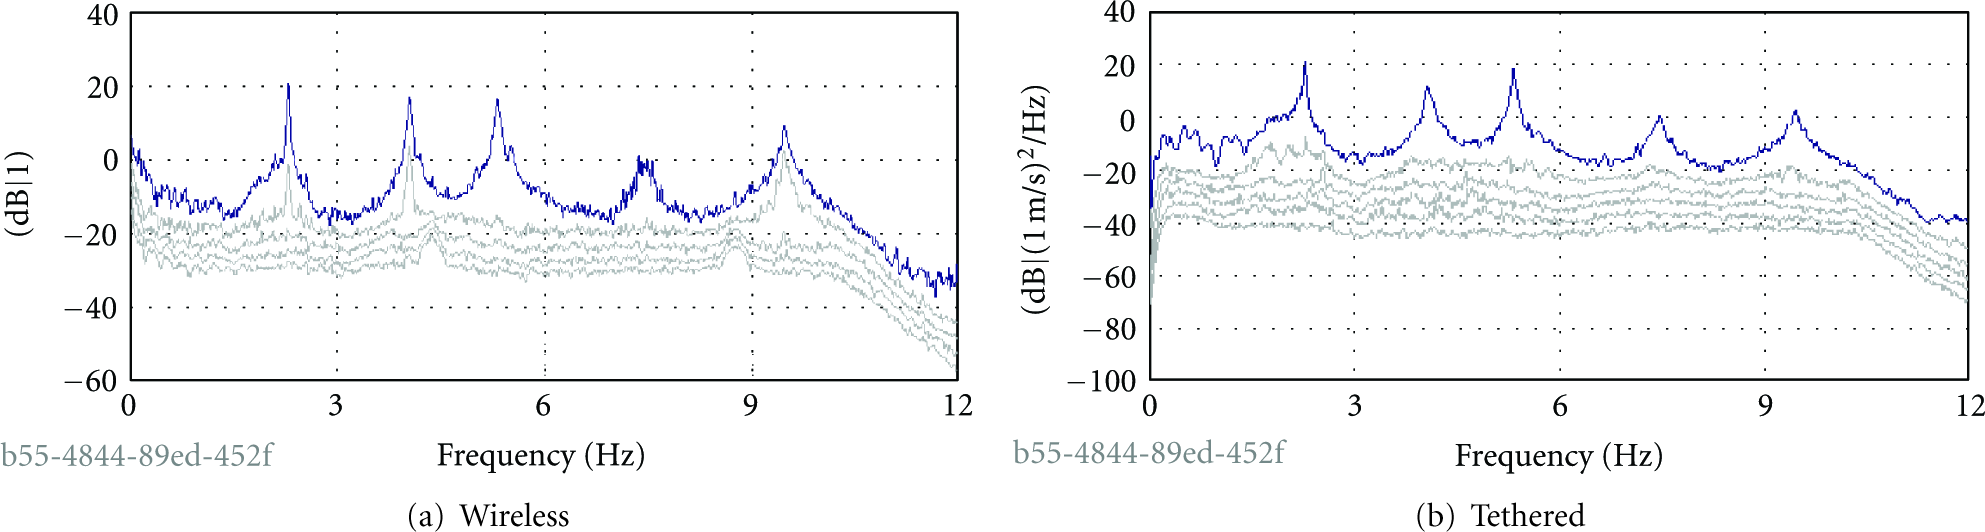
Singular values of the PSD matrix of acceleration responses measured by WSN and cable-based DAS (Baicheng Footbridge).
Figure 16 shows the SSI stabilization diagrams of the acceleration responses measured by WSN and cable-based DAS, respectively. The first five modes are well identified as shown in Figure 16. Table 6 shows the natural frequencies, damping ratios and mode shape descriptions, for the first five modes of the footbridge using SSI algorithm. The relative difference and MAC values between wireless and tethered results clearly demonstrate that the WSN can offer sufficiently accurate data for identifying the natural frequencies and mode shapes. However, the identified damping ratios are more different between wireless and tethered systems, with an average value of 13.5% (EFDD) and 25.9% (SSI). These significant differences in identified damping ratios may be attributed to the sight difference in acceleration amplitude measurements by wireless and tethered system, as shown in Figures 11 and 12. Nevertheless, damping ratios are notoriously uncertain in modal analysis, even just comparing among wired measurements. In general, variations up to 200% are commonly encountered [37]. Damping ratio estimation is constrained by dynamics modeling, identification algorithm, and vibration magnitudes, and structural damping is intrinsically nonlinear. As a result, when the structural dynamic behavior is represented by a linear model, such as in EFDD and SSI algorithms, the estimated equivalent damping ratios unavoidably demonstrate large variations. Damping ratio identification is still a widely known challenge in the research community. Consequently, the large difference in damping ratios listed in Tables 5 and 6 are primarily due to the difficulty of damping ratio identification in general, rather than being caused by the difference in wireless and tethered data. A similarly big difference in identified damping ratios between wireless and cable-based systems is also reported in the literature [37].
Modal identification of Baicheng Footbridge by SSI.

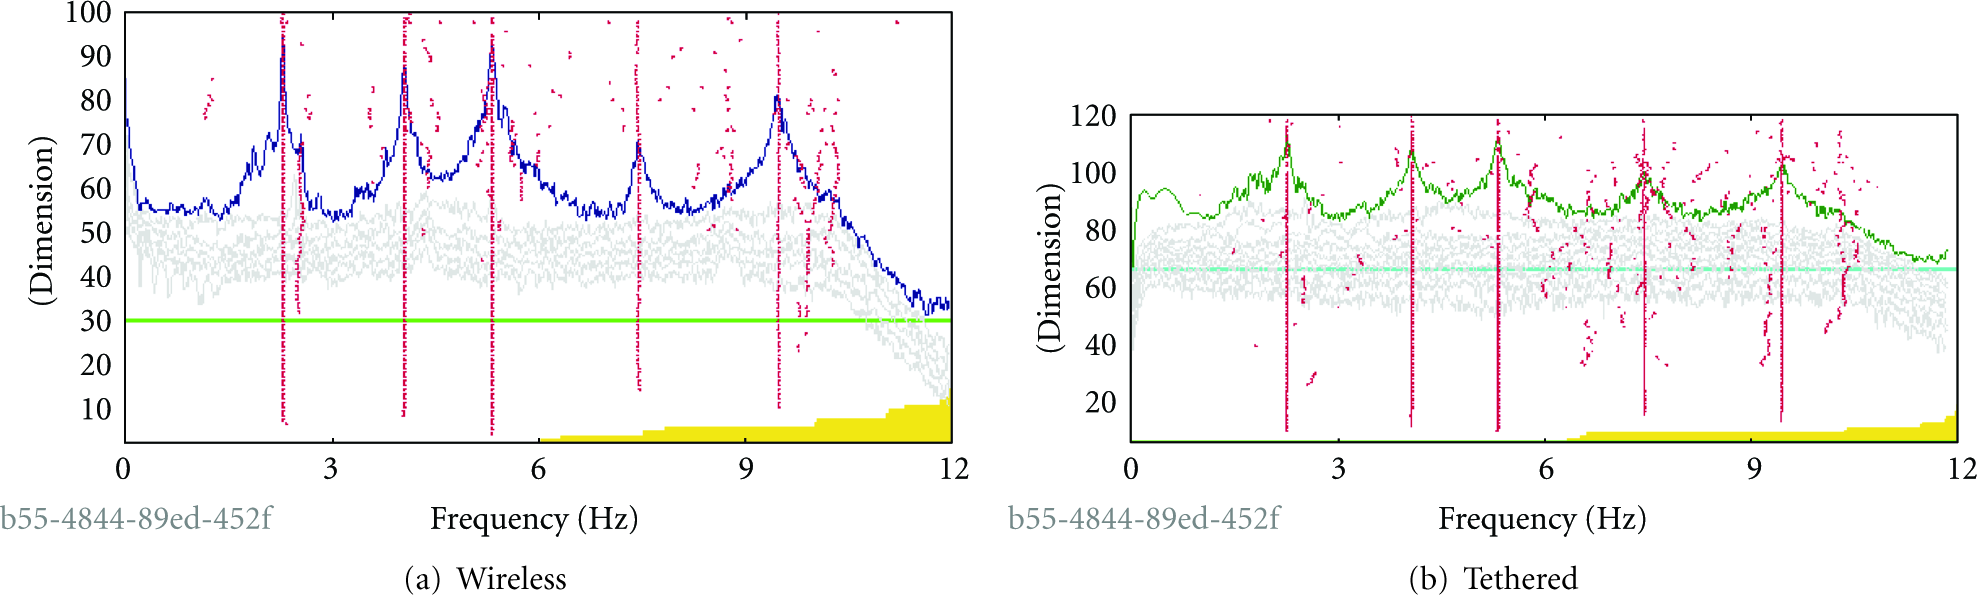
Stabilization diagram of SSI algorithm based on acceleration responses measured by WSN and cable-based DAS (vertical axis: system order, Baicheng Footbridge).
Figure 17 shows the mode shapes of Baicheng Footbridge. The 2nd mode shape is absent because the vibration of tower was not fully measured due to sensor installation difficulties. The modal properties of one-side cable-stayed steel footbridges are rarely reported in literature. Due to its special space configuration, its mode shapes also exhibit some special features. The vertical and radial mode shapes are coupled in the 1st and 5th modes, as shown in Figure 17. The fundamental frequency of the Baicheng Footbridge is 2.292 Hz, which is close to the footfall frequency of pedestrian walking (typically around 2 Hz) [38]. Therefore, pedestrians can induce excessive vibrations to the bridge by “resonance” effect. Overall, the modal identification results presented in this section illustrate a good performance of wireless sensor instrumentation at this short-span bridge.

Identified mode shapes of Baicheng Footbridge based on wireless sensing data (Top view; Side view +X; Side view +Y; 3D view).
5.3.2. Modal Identification Results of the Wuyuan Bridge
Although the WSN works well at the Baicheng Footbridge, the system should also be tested in more complex and harsh environments posed by long-span bridges. Hence, Wuyuan Bridge is selected as another test-bed for experimental study of the prototype wireless sensing system. A total length of 360 seconds acceleration data (18,000 data points per channel) are measured by the WSN and employed to identify the modal parameters of the Wuyuan Bridge. Meanwhile, 409.6 seconds of acceleration responses (20,480 data points per channel) measured by the cable-based DAS are also used to identify the bridge modal properties.
Table 7 shows the modal identification results by EFDD algorithm based on wireless and tethered data. The first nine modes, with very closely spaced resonance frequencies, are identified. Based on wireless data, the fundamental frequency and damping ratio of Wuyuan Bridge are identified as 0.774 Hz and 2.14%, respectively. A good agreement is found between wireless and tethered results, as shown in Table 7. Average relative difference between identified natural frequencies is 0.47% and the difference between identified damping ratios is 34.4%, both about roughly twice of that from Baicheng Footbridge testing. This is likely because the vibration amplitude of Baicheng Footbridge is larger than Wuyuan Bridge and thus the WSN in former test can provide higher data quality than the latter.
Modal identification of Wuyuan Bridge by EFDD.
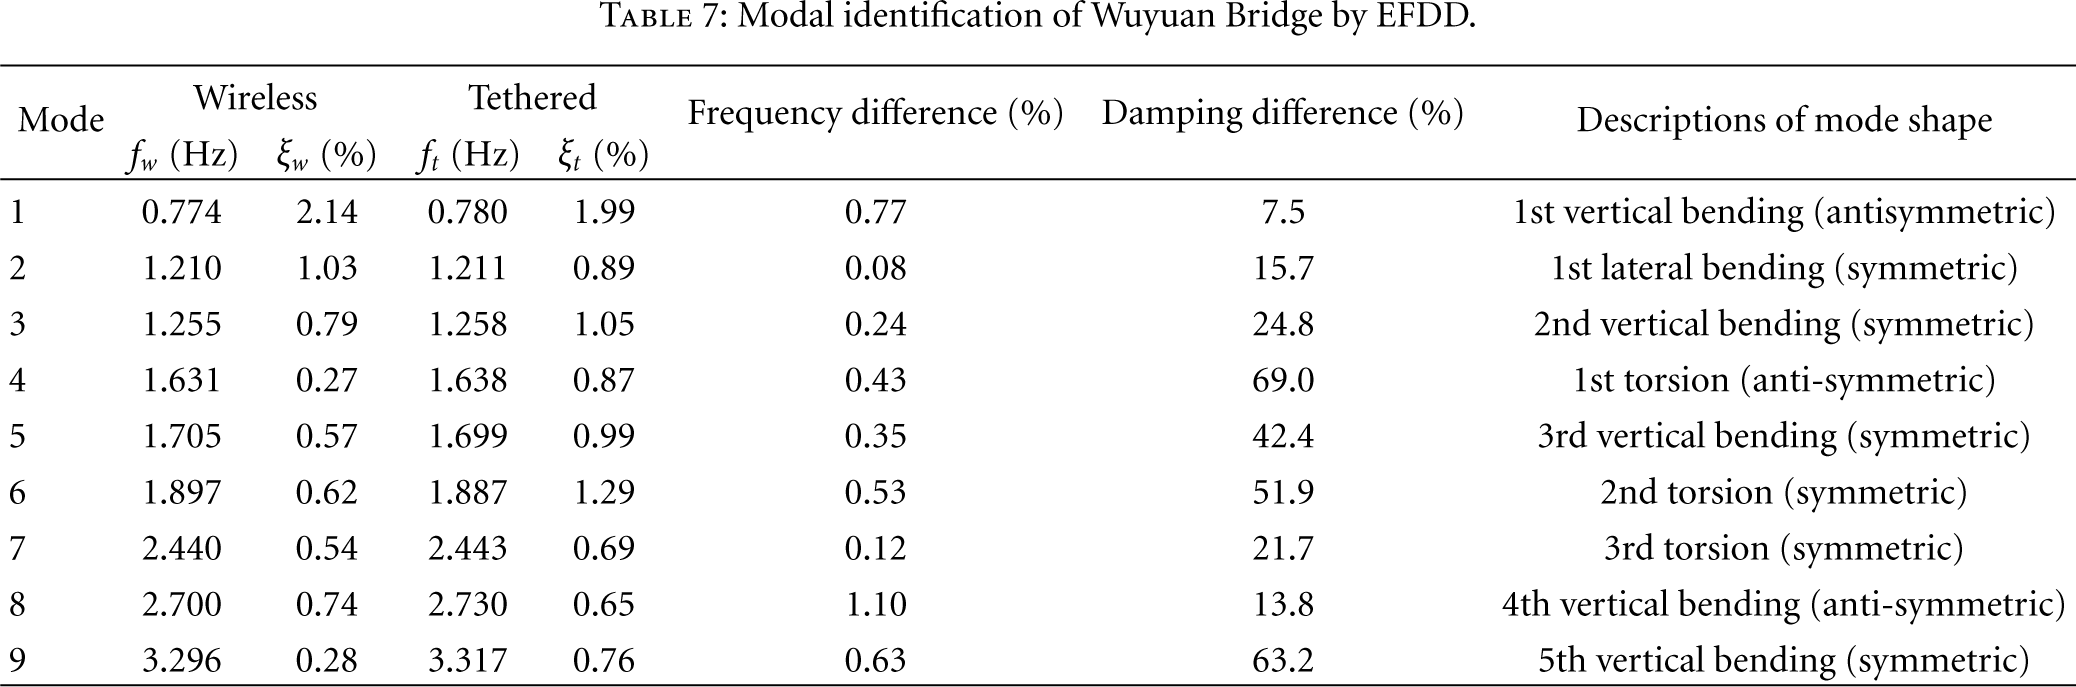
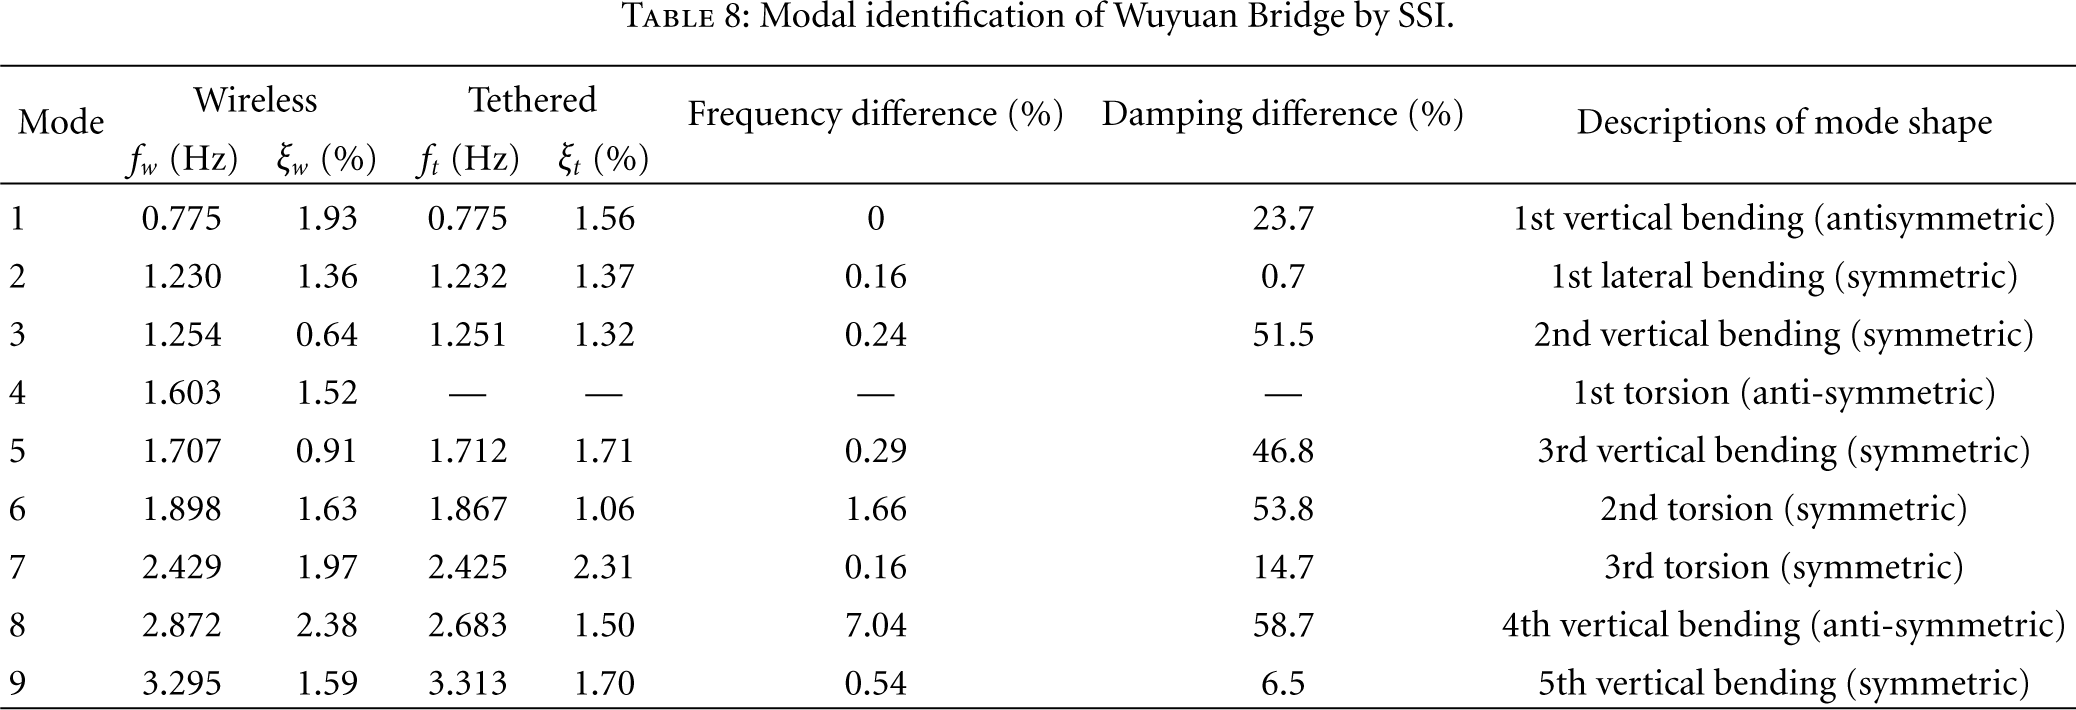
Figure 18 shows the stabilization diagram of SSI algorithm of wireless setup 1. The identified frequencies and damping ratios of the first nine modes of the Wuyuan Bridge using SSI are summarized. Excluding the large relative difference in natural frequency of 8th mode, the other identified frequencies based on wireless data are overall consistent with the tethered results. A large relative difference in identified damping ratios, averaging 32.05%, is also observed in Table 8. In addition, the fourth mode (1st torsion) is not identified based on tethered data by SSI algorithm.
Modal identification of Wuyuan Bridge by SSI.

Stabilization diagram of SSI algorithm using data from wireless setup 1 (vertical axis: system order).
Figure 19 shows the comparisons of identified mode shapes of Wuyuan Bridge based on wireless and tethered sensing data. A very good agreement between the identified mode shapes from wireless and tethered data is found in Figures 19(a)–19(f), which is also indicated by a set of high MAC values (averaged 0.956). It is recognized here that the MAC values are also lower than those of Baicheng Footbridge test, which may also be attributed to a higher data quality at Baicheng Footbridge test.
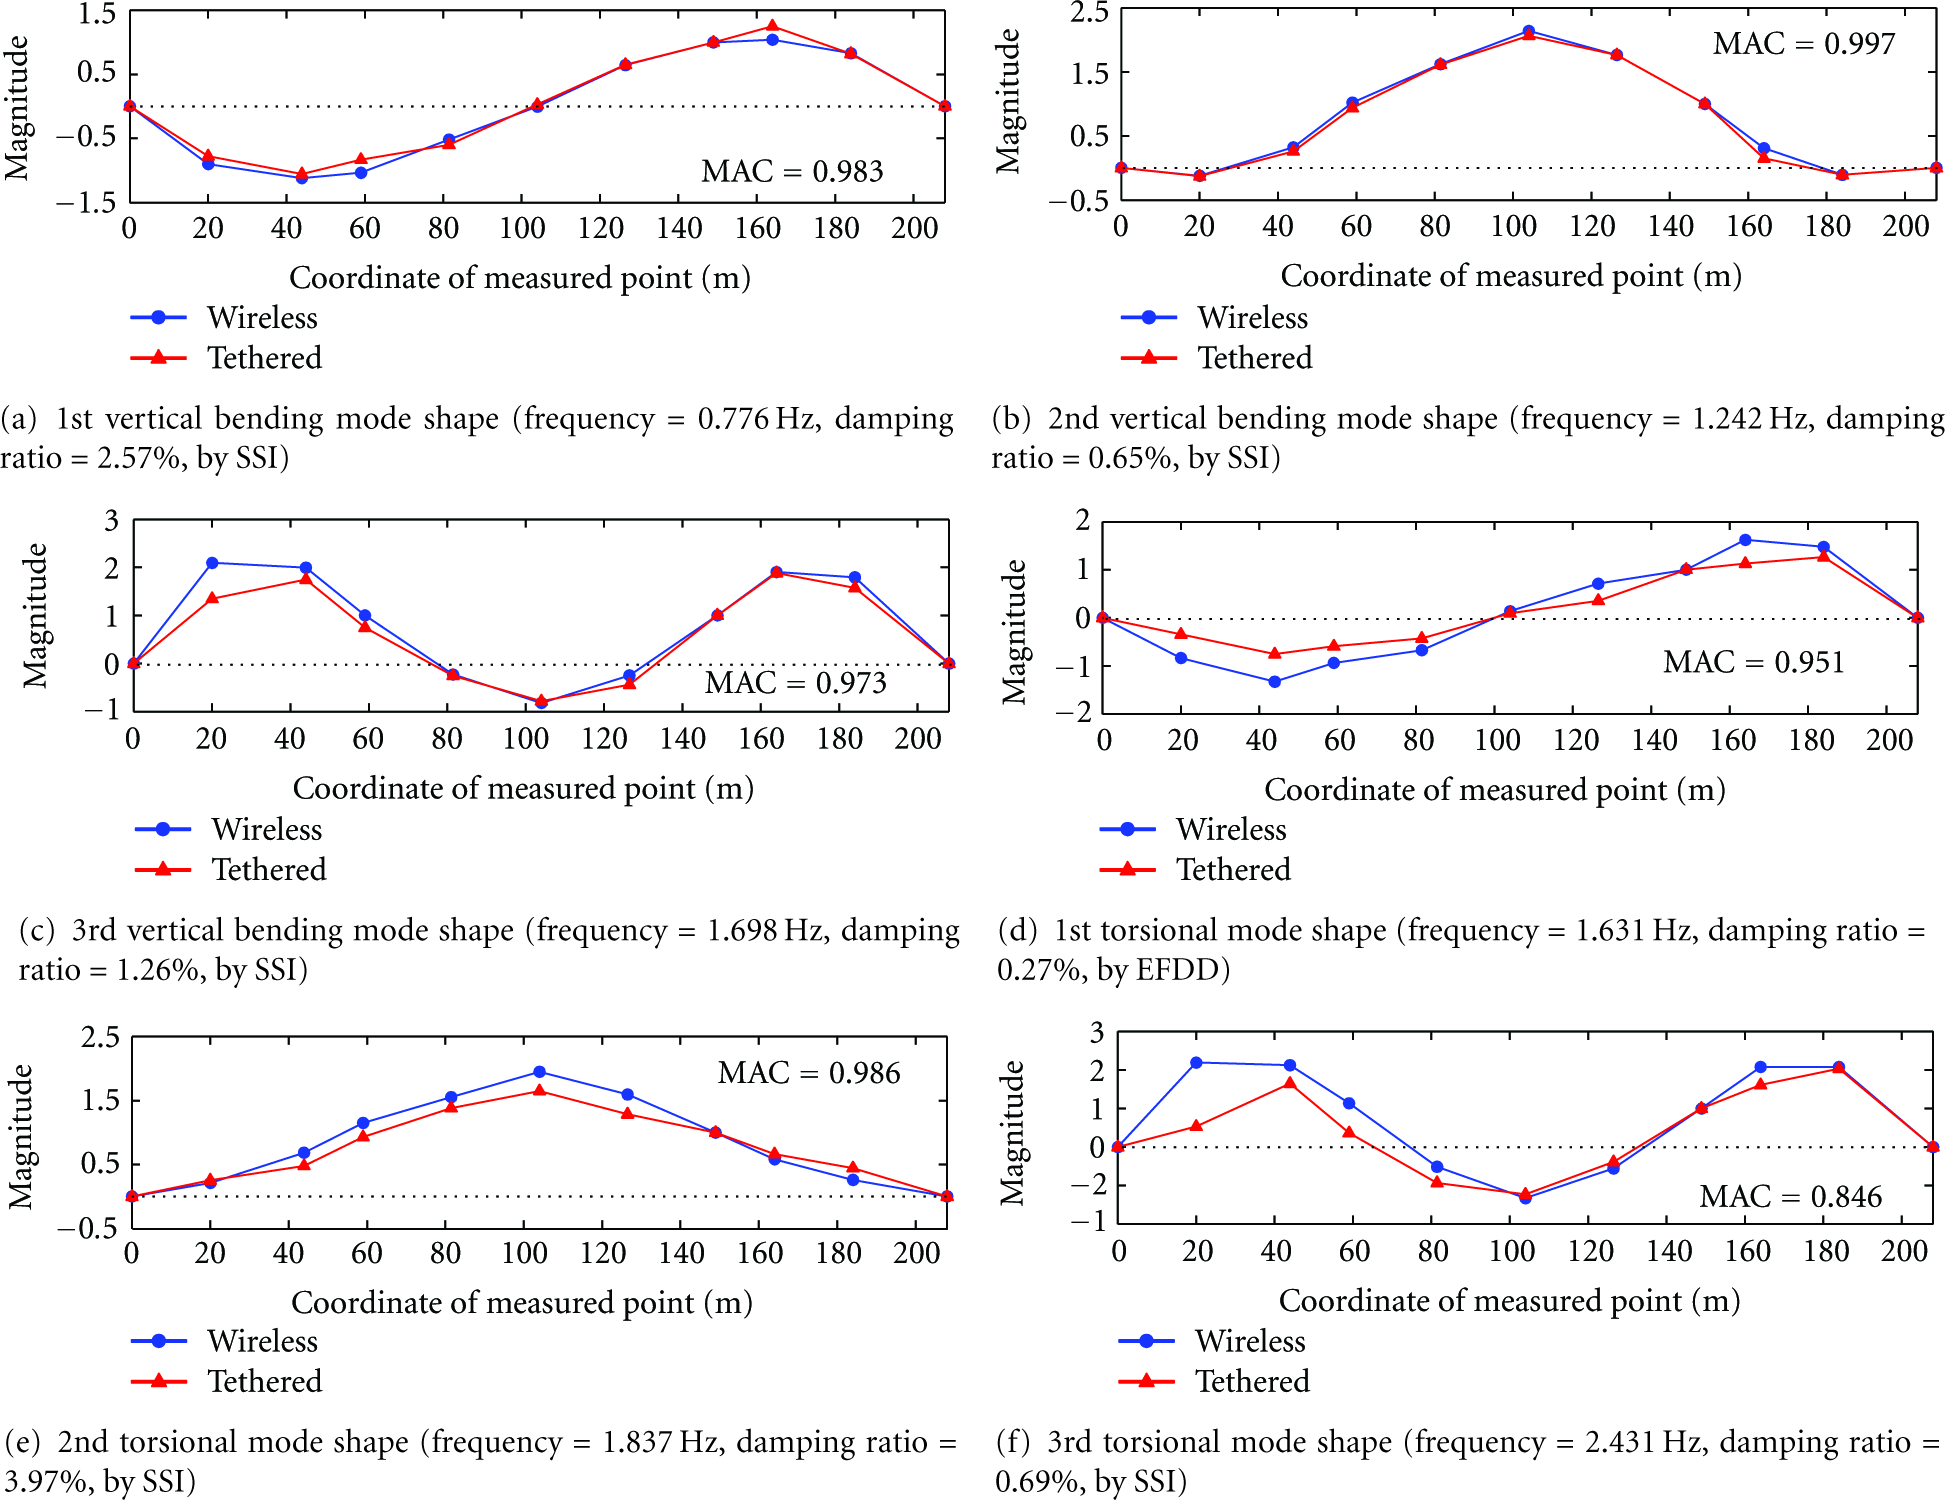
Comparisons of identified mode shapes of Wuyuan Bridge based on wireless and tethered sensing data.
Figure 20 shows the 3D view of identified mode shapes of Wuyuan Bridge based on wireless sensing data. The identified first vertical bending mode shape of Wuyuan Bridge has an antisymmetric waveform, which is similar to the second mode shape of a simply supported beam. This identified result is consistent with the theoretical solution of the mode shape of arch bridges [39] and also consistent with the experimental results at another arch bridge in China [40].
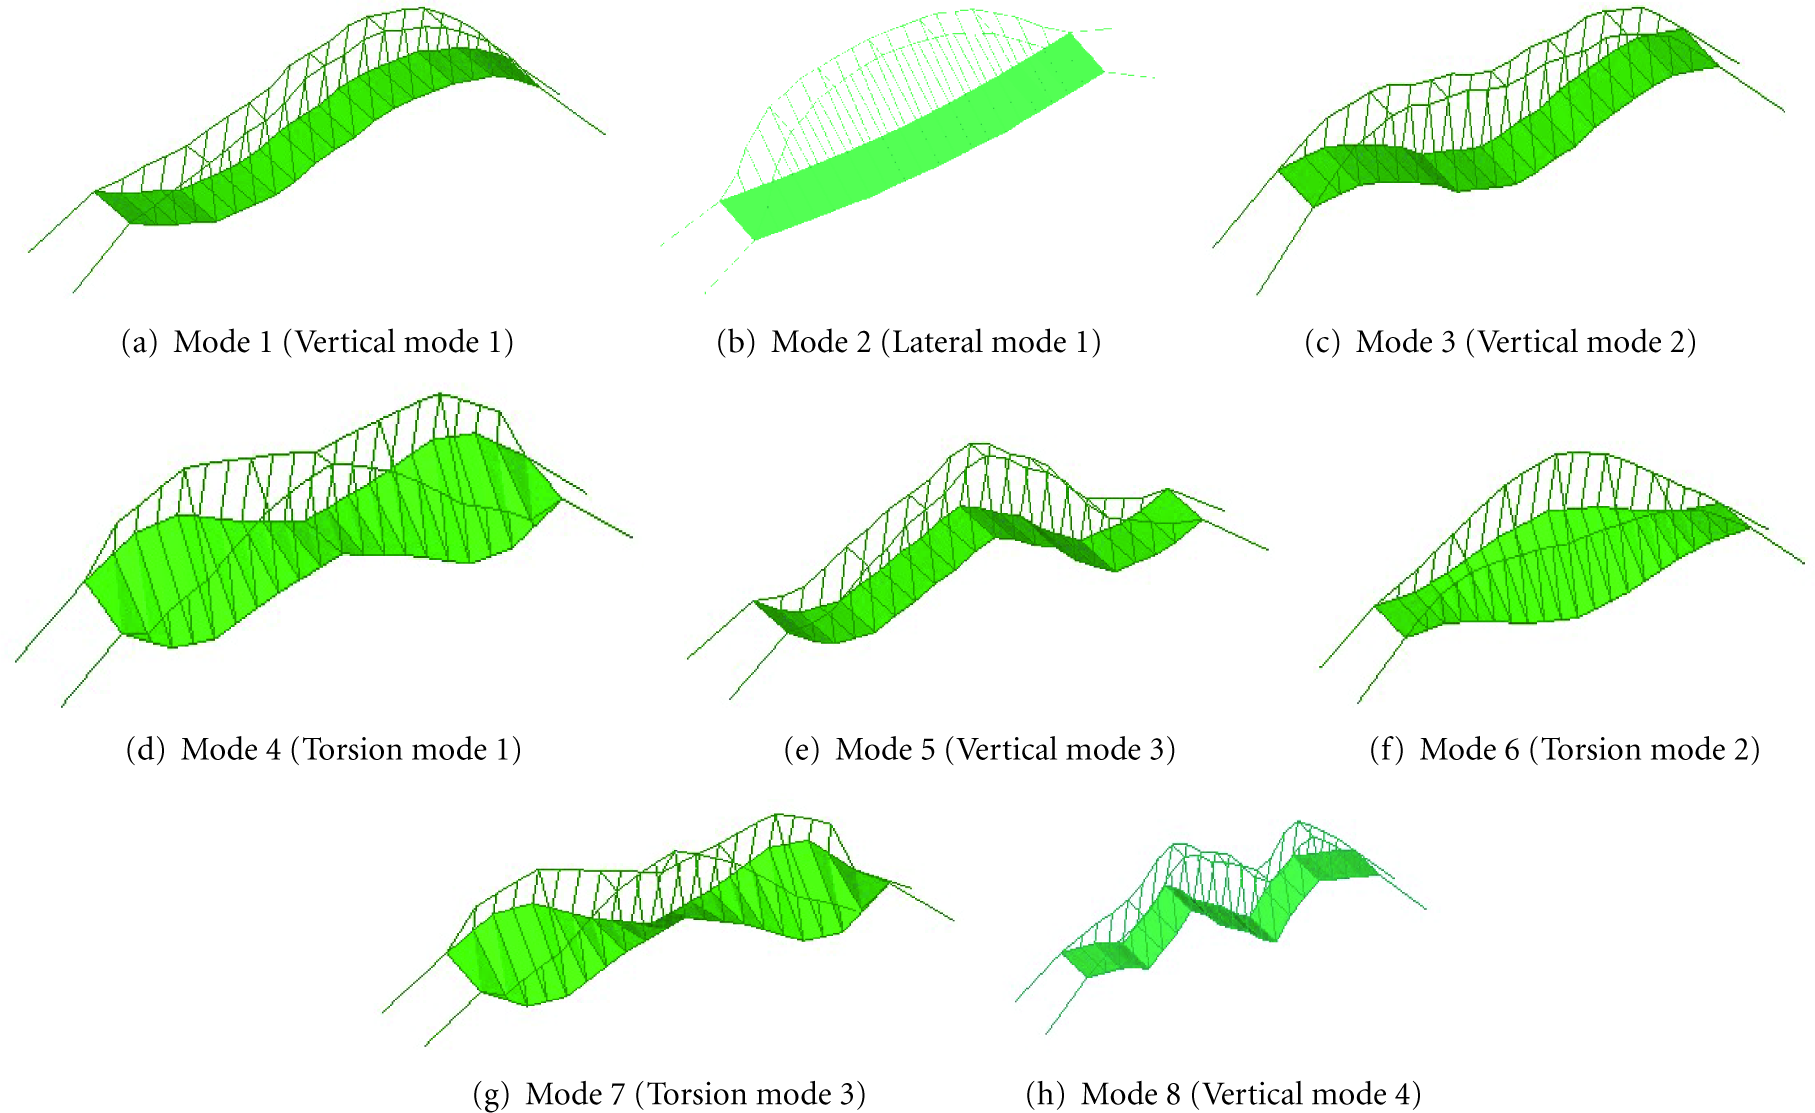
3D view of identified mode shapes of Wuyuan Bridge based on wireless sensing data.
All the identified results of natural frequencies and mode shapes based on wireless sensing data are consistent with those based on conventional tethered data. Larger differences have been found in the identified damping ratios from wireless sensing data. Considering the commonly occurring uncertainty in damping ratio identification, even using traditional tethered sensing data, the performance of WSN for output-only modal identification has been well demonstrated in these two field ambient vibration tests.
6. Conclusion and Discussion
This paper presents the quantitative experimental studies on time synchronization, data quality, and accuracy for output-only modal identification using a single-hop WSN system. Both short-span to long-span bridge applications are studied. The cross-correlation function between wireless and tethered signal is employed to assess the time synchronization accuracy of the WSN. The field experimental results illustrate that time synchronization errors are bounded by 3 ms for the entire duration of the data collection. Hence the time synchronization error of the single-hop WSN is regarded as negligible in output-only modal identification of civil structures.
In addition, this paper proposes two data quality indexes, correlation coefficient (CC) and percent root-mean-square difference (PRD), for assessing the accuracy of wireless sensing data. High-quality data (CC: 80% to 97%; PRD: 10% to 22%) was collected when ambient vibration amplitude is relatively large (RMS > 1 mg, i.e., accelerometer voltage change > 0.98 mV). However, the data quality indexes decline when the vibration amplitude is low (e.g., accelerometer output < 0.98 mV). Potential approaches to further improve data quality include higher resolution sensors, more powerful signal conditioning circuit with larger amplification factors [41], and higher resolution A/D converters.
The output-only modal identifications of Baicheng Footbridge and Wuyuan Bridge were carried out based on the wireless and cable-based sensing data. The results demonstrate that the identified natural frequencies using wireless sensing data are very accurate, where average relative difference from the tethered results is 0.236% for Baicheng Footbridge and 0.47% for Wuyuan Bridge. The mode shapes are also reliably identified. The averaged MAC value between wireless and tethered data is 0.996 for Baicheng Footbridge, and 0.956 for Wuyuan Bridge. However, large relative differences (averaging 13.5% for Baicheng Bridge test and 34.4% for Wuyuan Bridge test) in identified damping ratios were observed between wireless and tethered data. However, such difference is primarily due to the difficulty of damping ratio identification in general, rather than being caused by the difference in wireless and tethered data. Because the vibration amplitude of Baicheng Footbridge is larger than that of Wuyuan Bridge, providing higher signal-to-noise ratio, modal identification results from the former is overall more accurate than the latter.
In summary, the field ambient vibration tests demonstrate the feasibility of output-only modal identification using WSN. The accuracy can be assured if the ambient vibration amplitude is larger than RMS 1 mg, or in this case, when the analog sensor output voltage changes by more than 1 mV. From our experience, in addition to extremely low-amplitude ambient vibration test, another two challenges facing WSN in ambient vibration tests are the bandwidth limitation of wireless communication and the power supply for wireless sensors. Low power wireless sensors and energy harvesting technologies [42, 43] should be developed for next generation wireless sensing systems. Wireless sensors, with the characteristics of low cost, mobile, easy installation, and increasingly more powerful embedded computation capability, are expected to keep evolving and to enable exciting future applications on civil infrastructure. WSN, a significantly valuable product from technology revolution in modern era, is highly promising for widespread deployment in the vibration testing and safety monitoring of civil structures.
Footnotes
Acknowledgments
The authors are grateful for the financial supports from the China National High Technology Research and Development Program through Grant No. 2007AA04Z420 and from State Key Laboratory for Disaster Reduction in Civil Engineering at Tongji University through Project No. SLDRCE10-MB-01. Y. Wang is supported by the US National Science Foundation CAREER Award CMMI-1150700. Any opinions, findings, and conclusions or recommendations expressed in this publication are those of the authors and do not necessarily reflect the view of the sponsors. The authors would like to thank Professor J. P. Lynch from University of Michigan, Ann Arbor, MI, USA for providing valuable support on this research. In addition, Assoc. Prof. Yu Song from Xiamen University is gratefully acknowledged for the assistance in modal identification and field testing.