
Abstract
The social network formed by people is one of the key applications of Delay-Tolerant Network (DTN). Owing to its intermittent connectivity and unique human mobility patterns, how to transmit data in an effective way is a challenging problem for the social network. In this paper, we propose the idea of Trip History Model (THM) which establishes a model on a single person's mobility, and then a Spatial and Temporal Correlations-Based Routing Algorithm (STC) is proposed. In STC, the node delivery probability is calculated according to both a node's current moving prediction and its history record to give guidance for message transmission. Our simulation results show that, compared with LABEL and PROPHET algorithms, STC effectively improves the routing performance of the network.
1. Introduction
The application of wireless network adapters in portable communication devices, such as mobile telephone, personal digital assistants, and laptops, can provide more chances to access global information resources. These portable devices can be connected to dynamic networks. By such networks, people can transfer information to each other. The movement of people and the limited communication range make the network unable to always guarantee its own connectivity. To make communication possible, DTNs (delay tolerant networks) [1] were proposed, which overcome the problems associated with intermittent connectivity, long or variable delay, asymmetric data rates, and high error rates by using store-and-forward message switching. PSN (pocket switched network) is a kind of DTNs, which is composed of mobile communication devices and has broad application in the future.
Because of the dynamic topology and the intermittent connectivity of PSN, people can only communicate by using store-and-forward message switching when they meet. Currently, many proposed PSN routing algorithms are based on historical records, and data is transmitted to the node which can constantly communicate with destination node. Since these algorithms fail to predict the trajectories of mobile nodes, they cannot guarantee the reasonableness of data forwarding. In addition, [2] shows that many people will move according to some certain rules. For instance, they like moving to specific sites periodically; in this case, regular space and time rules can help to guide routing in PSN.
Based on human movement discipline, this paper proposes Trip History Model (THM) to automatically predict the destination of people by studying their trip history recorded by portable communication devices. Meanwhile, according to the spatial and temporal characteristics of human movement, STC (Spatial and Temporal Correlations Routing Algorithm) is designed to forward the message to next node according to the prediction of the current node. Simulation results show that STC effectively improves the routing performance.
2. Related Work
In recent years, there has been extensive research on routing protocols in delay-tolerant networks. Vahdat and Becker [3] present epidemic routing protocol, which is the representative flooding routing protocol. It attempts to give all nodes a copy of every message through the communication with them to achieve high delivery ratios. Flooding routing protocol requires no knowledge about the sensor network, but it also has some defects. For instance, since there exists huge amounts of copies of messages, a large proportion of network bandwidth and node buffer resources will be occupied. Meanwhile, more energy of the sensor nodes will have to be consumed to send and receive these copies messages. Based on the research on human society, some scholars proposed the community-based intermittent connectivity routing algorithm.
Literature [4] proposes a Replication-based Efficient Data Delivery (RED) scheme, which consists of two key components for data transmission and message management, respectively. Data transmission scheme decides when and where to transmit data messages based on the delivery probability, and message management scheme makes decisions on the optimal erasure coding parameters according to its current delivery probability. However, the calculation of erasure coding parameters is not a refined one, and a lot of data blocks split by RED will consume lots of energy of the sensor nodes.
Literature [5] presents a LABEL routing scheme, which assumes every node belongs to a community and marks nodes in the same community with the same label. When a node needs to send a message, it will only select the nodes within the communication range which belong to the destination node community as the next hop node. However, when the source node is far from the destination node community, the message cannot be transferred. For this reason, Hui and Crowcroft [5] propose a BUBBLE routing scheme, which takes the node activity into account. Each node has a global level and a local level; the higher its global level is, the more active the node will be and thus having the stronger ability to transfer messages.
In addition, Daly and Haahr [6] present a delay-tolerant network routing technique (SimBet) based on the small-world social phenomenon, which comes from the observation that individuals are often linked by a short chain of acquaintances. The betweenness centrality and the social similarity value are jointly decide the Simbet value of each node. When two nodes meet in the network, the message will be transferred to the node with larger Simbet value in order to improve the delivery performance. Simulations using three real trace data sets demonstrate that the achieved delivery performance may be closed to that of Epidemic Routing but the overhead can be significantly reduced.
3. Analysis
In recent years, great progress has been made in the research of human complex social systems. Based on the tracking data of the wireless mobile network users, Hsu et al. [7] sum up two characteristics of people's movement, that is, preferring specific locations and going to the same location periodically. Based on the tracking data of thousands of anonymous mobile phone users, González et al. [8] propose people's activities have regular space and time rules. These research results prove the movement of people is nonrandom and it has regular space and time rules. In addition, a project named Mobidrive [9] recorded the movement of people in six weeks and found that human movement between 4 to 6 major locations may occupy more than 70% of all the movements. Therefore, the movement of people can be described as a spatial one between regular locations and thus the conclusion that the movement of many persons can be predicted.
The current human movement models fall into the following categories: firstly, the random movement model, including random waypoint, random walk, and so forth. In the random movement model, node randomly select the destination, direction, and thinking times, and so forth. The movements of all nodes in the models mentioned before follow the same rule. These models have simple structure and can be clearly defined, but they cannot reflect the movement features of people in real world for its lack of authenticity. Second, modeling and analyzing the movement features of people are done based on the collection of the real trajectory. Chaintreau [10] considers intercontact time of portable wireless devices nearly obeys the power-law distribution rather than the original exponential distribution. For such models, the main difficulty lies not in the model itself, but in how to organize data and obtain the implied movement mode through a series of mathematical methods. Third, the movement model is established based on community. Literature [11] divides people into different groups based on the social relations between them. These groups are randomly placed in the simulation area and the nodes select their destination and move according to certain rules. Literature [12] introduces agenda-based routing protocol (ARP), which considers the relationship between human social activities and movement locations based on the survey data of US Transportation Department, but it does not consider the two characteristics of human movement, that is, spatial and temporal. The models above have their defects, and therefore we propose Trip History Model that takes into account the two characteristics of human movement to predict the human activities, which can be easily saved and processed.
4. Network Model
4.1. Trip History Model
This paper assumes that the sensor nodes are distributed in a two-dimensional
In addition, the movements of all the sensor nodes follow the Trip History Model. The power of portable devices can be replenished in time, so we assume that the energy of sensor nodes is infinite.
We consider the human activities have certain rules and can be described as a series of data including time and location. All the records of time and location of a person's activities constitute his travel history. Since a person's activities include some repetition every day, we save a person's trip in a day as a record cycle. Meanwhile, a day can be divided into two discrete sets, that is, Day (Mon., Tues., Wed., Thurs., Fri., Sat., Sun.) and Time (<8, 8-9, 9–11, 11-12, 12-13, 13–15, 15–17, 17–19, >19). For instance, the trip history of a person can be described as follows:
Mon. 7:40 move from home to workplace along a certain way. Mon. 17:30 go home from the office and pass by the supermarket for some shopping. Sat. 10:20 move from home to the shopping mall. Sat. 18:30 go home from the shopping mall and pass by the restaurant to eat something.
The forth trip record presents a stopover, and such behavior is true in real life. The trip history above can be described as in Table 1.
Records of the trip history.
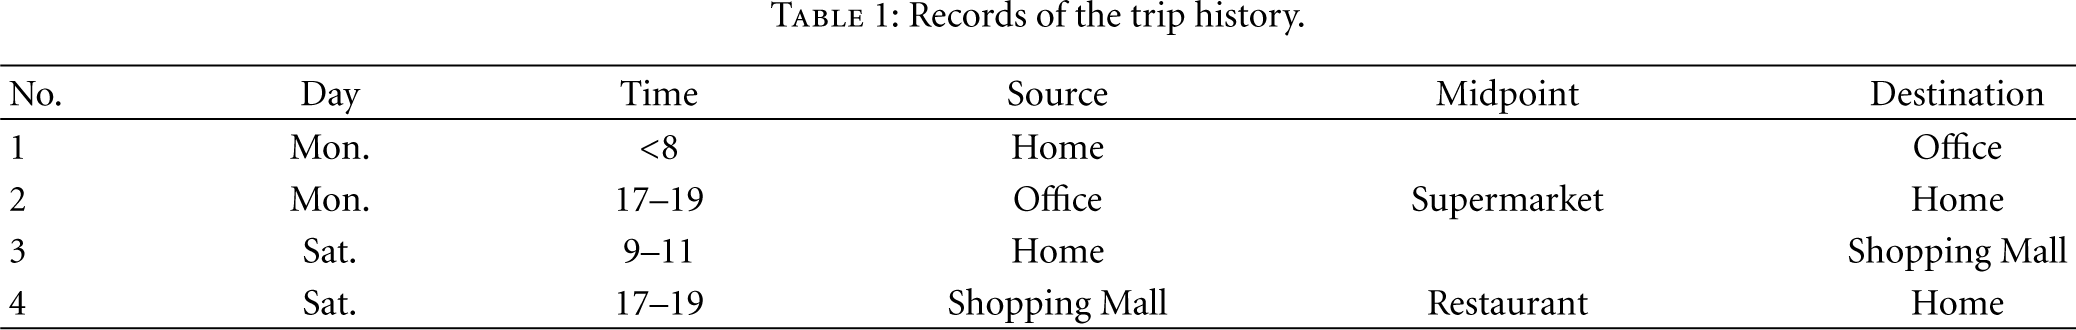
In addition, for getting easy computing and saving, we adopt some methods to change continuous location into discrete value. Home or Office, or Supermarket, and so forth is not a real GPS location, but a neighborhood GPS location set. People probably play and move near home and office, and the value of GPS may be some measurement errors, so we can consider the positions within a certain range (100 meters) as the same position.
When a person starts moving, the portable device records the current time and position until he reaches the destination. After a trip is finished, the portable device compares the trip with the shortest way according to the map. If the trip is the shortest way, the portable device will save the time, source, and destination and delete other trip history data. Otherwise, it records the time, source, destination, and the midpoints which the person passed by.
4.2. Decision Tree
We use a decision tree to save Trip History Model and help make some decisions on transferring messages in order to improve the delivery performance. As Figure 1 shows, THM can be presented as the branches and leaves of the decision tree. 
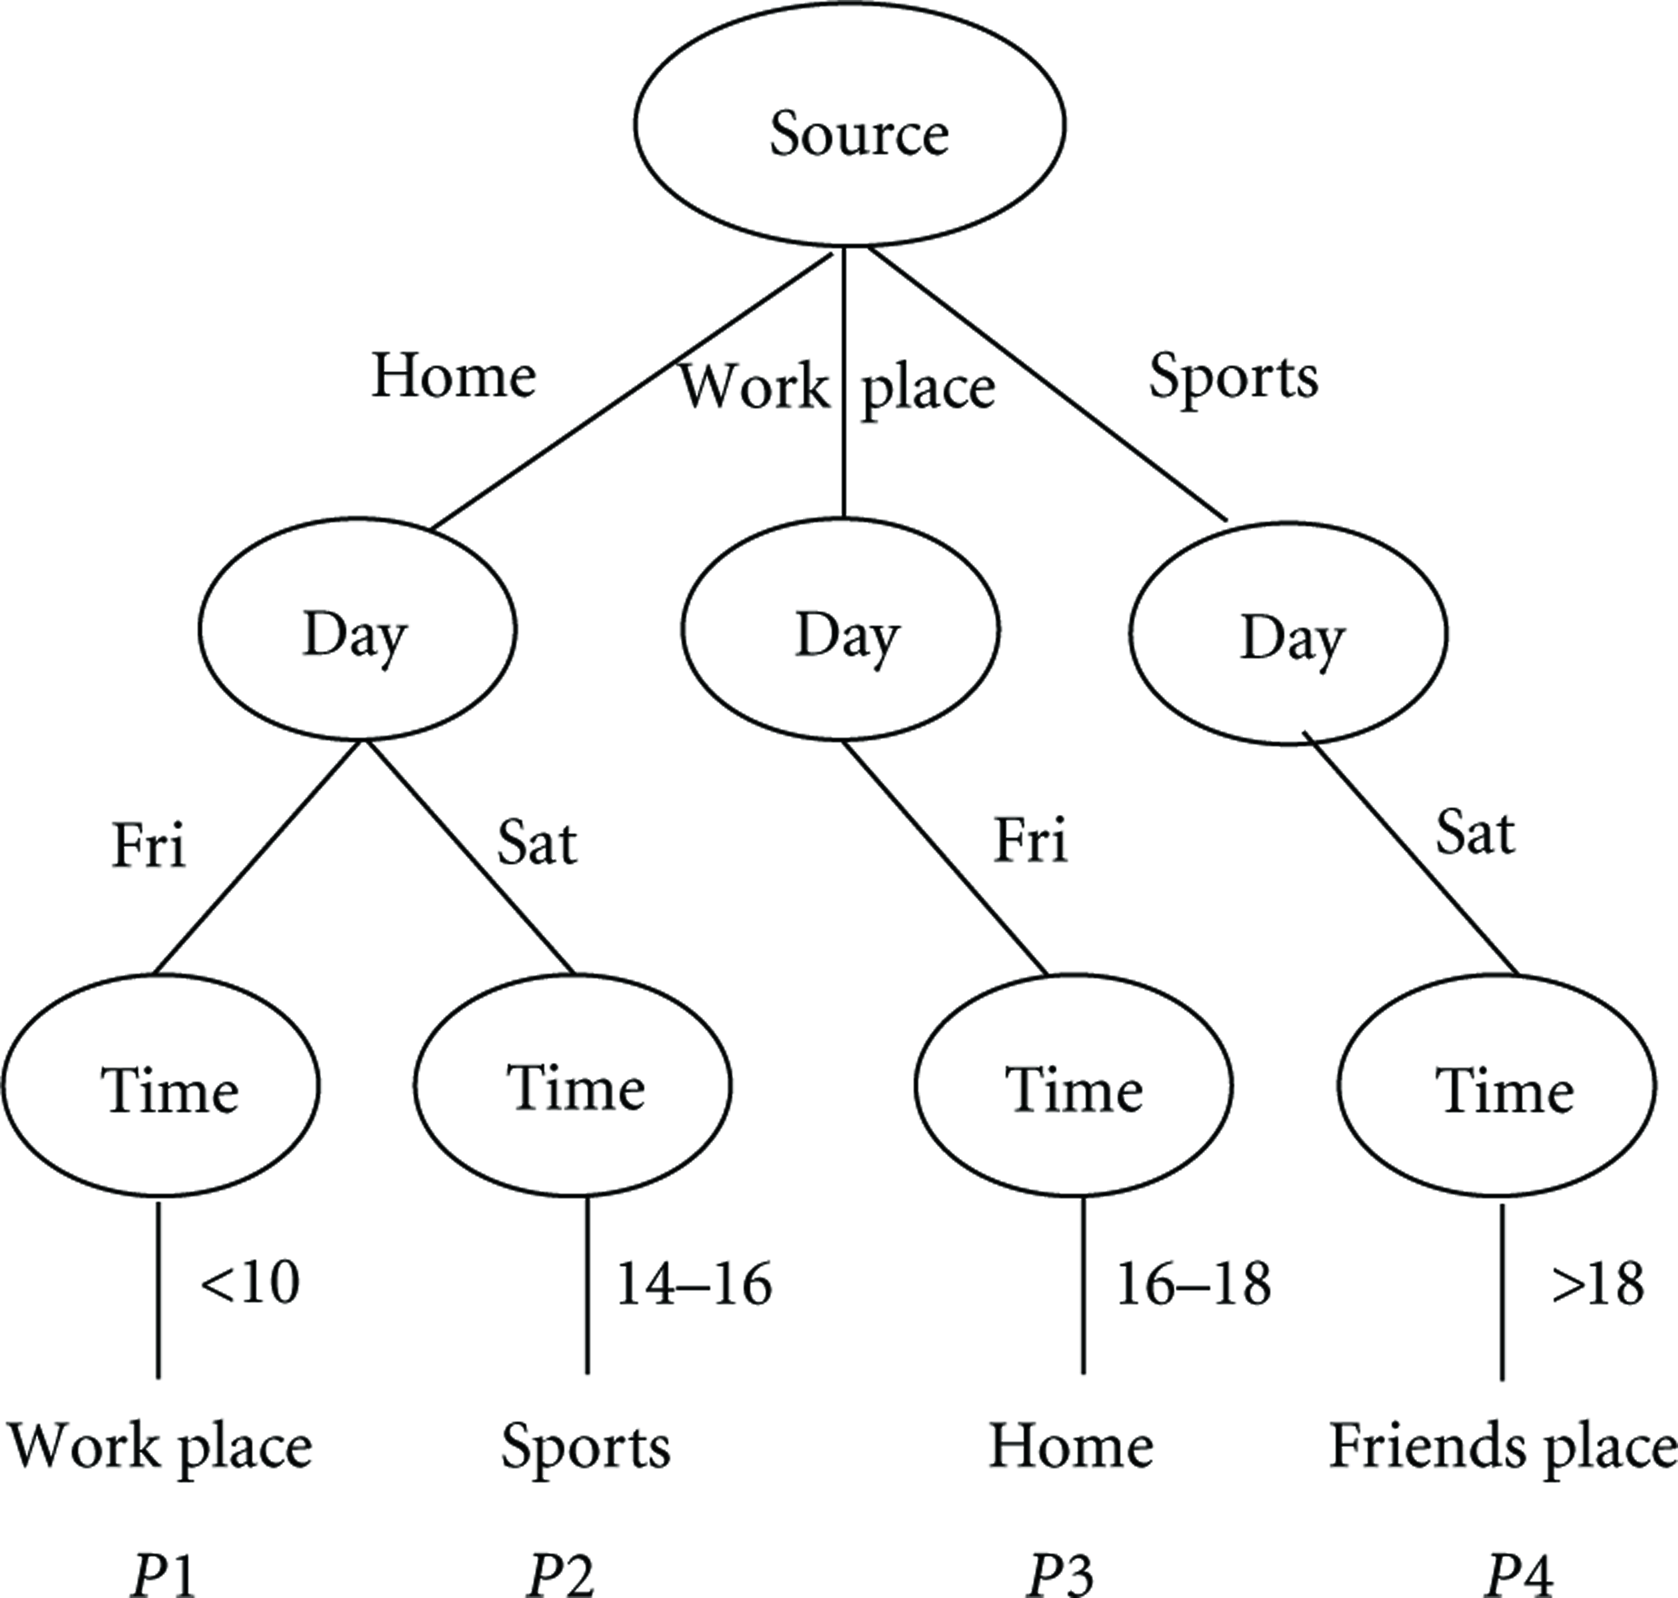
The structure of decision tree with trip history model data.
During the movement of people, the portable device will continue to check the current position and identify, if people are still on the way, the predicted midpoint, or destination. If the position disagrees with the predicted route, the new destination prediction will be calculated as

5. Spatial and Temporal Correlations Routing Algorithm (STC)
The trip history data is collected by the Trip History Model, including spatial and temporal information. To make use of the history data and to predict the movement of the people (nodes) in near future, we introduce spatial and temporal correlations routing algorithm (STC).
5.1. The Encounter Information Table
Assume each node n saves the encounter information including ID, encounter frequency, and predicted destination, as in Table 2.
Encounter information table.

Assume the node If If no,
5.2. Transmission Probability
Let 

Transmission probability calculation (blue lines present the streets).
5.3. Message Transmission
Suppose node
6. Simulation Results
6.1. THM Performance
First, the performance of trip history model is evaluated through the investigation of human trip. In order to get human real trip data, we conducted a 9-week investigation. Invite 5 campus staff members to participate in the survey, and these volunteers have smart handheld devices. In the survey, the drivers need to record the start time, start position, stop position, and midpoint position. The collected trip history data is shown in Table 3. We input these data into the electric map of Chengdu and establish trip history model for each volunteer. Finally, we divide the trip history in Table 3 into two parts. The trip history data in 1–8 weeks regarded as the training set is used to generate the decision tree, and the trip history data in the 9th week considered as the target set is used to evaluate the predicted result.
Trip history collection of investigation.

When the vehicles began to travel, completed a quarter of the trip, half of the trip, three quarters of the trip, and all the trip, the hitting rate compared the predicted destinations of the decision tree with the real destinations, and the results are shown in Figure 3. The average starting accuracy rate is 65.83%, and with the movement of vehicles, the average prediction accuracy rate increases gradually, from 77.56% to 82.77%, to 91.42%, and finally to 97.04%. Although individuals' daily activities are highly regular, the trip in 1–8 weeks cannot fully cover the schedule in the 9th week. Unpredicted circumstances cannot be avoided, so the final average prediction accuracy cannot reach 100%.

The prediction accuracy of trip history model.
6.2. STC Performance
To compare STC to other algorithms, we simulate STC, LABEL, and PROPHET algorithms. In PROPHET algorithm, each node calculates the transmission probability for different destination nodes and only transmits the message to the node which has larger transmission probability for the destination nodes.
6.2.1. Simulation Setting
Assume that the simulation area is
6.2.2. The Position of Nodes at Different Time
Figures 4 and 5 show the nodes' positions in the simulation area at 8:00 AM and 12:00 AM. The positions of nodes in Figure 4 are different from those in Figure 5, and this shows nodes have already moved. The positions of the nodes are randomly distributed at different times because the sites are randomly distributed in the simulation. In addition, we also find that the density of nodes in the central region is bigger than that in the edge region, and the nodes tend to move to the central region. Considering the actual situation, there will be an uneven distribution of nodes, for example, more nodes should be at “home” in the evening.

Node distributions at 8 AM.

Node distributions at 12 AM.
6.2.3. Performance Comparison
The following is the performance comparison of three algorithms under default parameters in Table 4. STC's delivery ratio is bigger than PROPHET's delivery ratio, but the average number of the copies of each message in STC is lower than that in PROPHET, and this shows the former's average transmission energy consumption is smaller. In addition, we do not consider the energy consumption of exchanging routing tables between two nodes in PROPHET. If the network has more nodes, the energy consumption will be enormous. In STC, when two nodes meet, they do not need to exchange the routing information and much energy will be saved. Table 4 shows the average delivery ratio of LABEL is the lowest and the average delay of LABEL is larger than that of STC, because nodes only transmit collected data to the node with same predicted destination with them in LABEL, and so message transmitted slowly and transmission delay will be longer.
The performance comparison under default parameters.

6.2.4. TTL's Impact on Performance
We change TTL (Time To Live) of messages from 50 s to 300 s, and the simulation results are shown in Figures 6(a)–6(c). In the figures, with the increase of TTL, the average delivery ratio of these three algorithms will increase. There is little difference between STC and PROPHET in terms of the delivery ratio, but compared with LABEL's delivery ratio, theirs are much higher. It shows that the longer survival time the messages have, the more opportunities they get to be transferred to the destination node. Figure 6(b) shows the average number of the copies of each message will increase with the growth of TTL. Although there is little difference between STC and PROPHET in terms of the delivery ratio, the average number of the copies of each message in STC is much lower than that in PROPHET, which implies that STC has less energy consumption. Figure 6(c) shows that average delay increases with the growth of TTL, and the average delay in STC is slightly lower than that in PROPHET.

TTL's impact on performance. (a) Average delivery ratio. (b) Average copies number. (c) Average delay.
6.2.5. Node Density's Impact on Performance
The total number of nodes is increased from 100 to 300 to change the node density, and the simulation result is shown in Figures 7(a)–7(c).
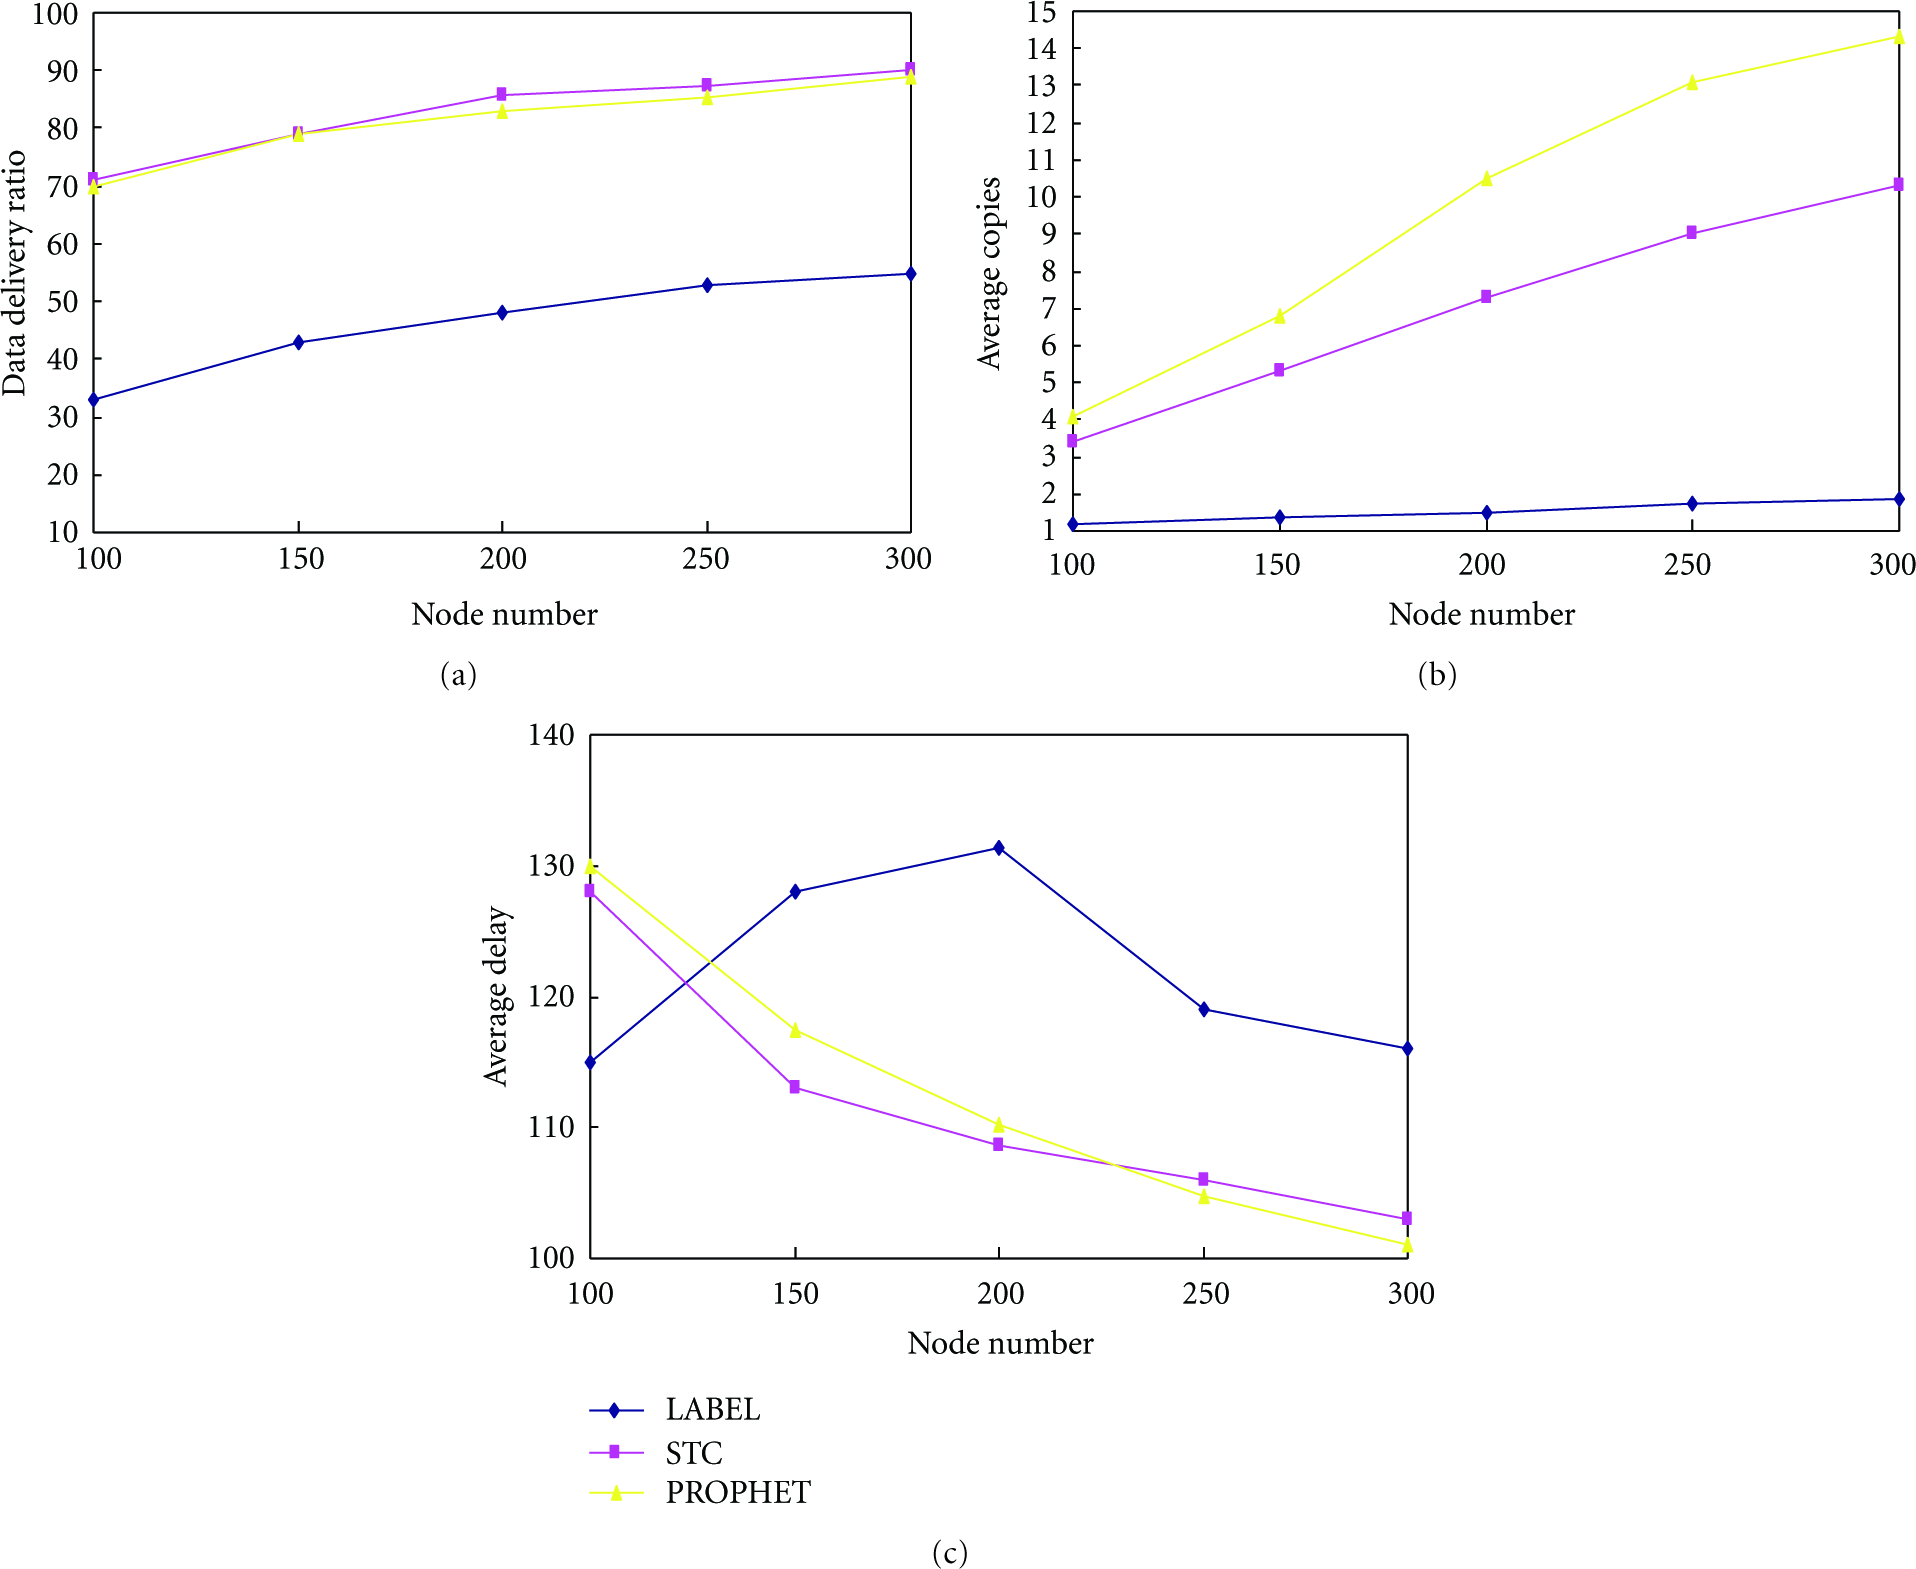
Node density's impact on performance. (a) Average delivery ratio. (b) Average copies number. (c) Average delay.
Figure 7(a) shows that in all the three algorithms the delivery ratio will increase with the growth of node density. The increase in the number of nodes will cause a change in the transmission range of each node; as a result, there will be more next hop nodes satisfying the transmission conditions, and thus increasing the delivery ratio. Figure 7(b) shows the average number of the copies of each message will increase with the growth of node density. Although there is little difference between the delivery ratio in STC and that in PROPHET, the average number of the copies of each message in STC is much smaller than that in PROPHET. Figure 7(c) shows the average delay in STC is much lower than LABEL with the number of nodes increasing. With the increase in the number of nodes, there will be more message copies in the network, and it will reduce the number of hops between the source node and the destination node.
7. Conclusions
This paper explores the trip history model (THM) of people's activities and proposes spatial and temporal correlations routing algorithm. In view of the observation that many people have some regularities in their daily movements, we create a model (THM) to describe the mobility characteristics of people who may be treated as mobile nodes and further make motion prediction. Investigation and experiment results have shown that THM can more accurately predict the moving destination of individuals.
In order to make better use of THM, we propose spatial and temporal correlations routing algorithm (STC). Messages route based on the prediction of node movements in THM, and data will always be transferred to the node which has higher transmission probability of meeting the destination node. Combined with judgments of human's trajectory, STC effectively avoid the blindness in data forwarding caused by the random movement model. According to simulation results, STC can obtain a higher data delivery ratio with lower energy consumption and transmission delay.
Footnotes
Acknowledgment
This work is supported by the National Natural Science Foundation of China under Grants nos. 60903158, 61170256, 61173172, 61103226, 61103227.