
Abstract
In existing anomaly detection approaches, sensor node often turns to neighbors to further determine whether the data is normal while the node itself cannot decide. However, previous works consider neighbors' opinions being just normal and anomalous, and do not consider the uncertainty of neighbors to the data of the node. In this paper, we propose SLAD (subjective logic based anomaly detection) framework. It redefines opinion deriving from subjective logic theory which takes the uncertainty into account. Furthermore, it fuses the opinions of neighbors to get the quantitative anomaly score of the data. Simulation results show that SLAD framework improves the performance of anomaly detection compared with previous works.
1. Introduction
Recently wireless sensor networks (WSNs) have been widely used in military surveillance, traffic monitoring, habitat monitoring and object tracking, and so forth [1, 2]. Such networks deploy lots of sensor nodes with sensing, data processing, and wireless communication capabilities in the monitoring area. Sensor nodes are resource-constrained and susceptible to interference from the environment so that their sensing data are often unreliable. Potential sources of anomalous data in WSNs are classified into three categories: faults (errors), events, and malicious attacks [3, 4]. While sensor nodes fail, their sensing data are faulty data [5]. Once the number of faulty data increases, it will bring great influence on the user query. Thus, they should be eliminated or corrected. When some event happens, the sensing data of the nodes in the area are informational data, which are different from the normal data. They should be reported to user for further deciding. The thirdly potential source of anomalous data is attacks which are beyond the scope of this paper. Anomaly detection is considered as a solution to detect faulty data and informational data.
In existing anomaly detection approaches, sensor nodes turn to neighbors to further determine whether the data is normal while the node itself cannot decide. In this process, existing solutions, including voting algorithms [6, 7] and aggregation frameworks [8– 10] which detect anomaly in the process of aggregating data, provide neighbors' opinions being just normal and anomalous. However, no neighbor can always say that the data of the node are absolutely normal or anomalous, and something is neglected by previous works which we call uncertainty. Thus, taking the degree for neighbors' opinions about the data being normal or anomalous into account can more realistically describe the view of neighbors. Consequently, the performance of anomaly detection is able to be improved.
In this paper, we propose SLAD (subjective logic-based anomaly detection) framework, which takes uncertainty into account, to improve the performance of anomaly detection. It includes three phases: preprocessing, self-monitoring, and cooperant detecting. Among them, pre-processing run on sink and self-monitoring execute on each node. After the two phases, sensor nodes send suspicious data to its neighbors to turn to further determine. The third phase is the key of our framework.
The important element of SLAD is ESLB (extended subjective logic-based algorithm), which is the key of the third phase mentioned above. Before plunging into the detail of ESLB, we first propose SLB (subjective logic-based algorithm) which elementarily describe our work. In SLB, each neighbor gives the quantitative opinion to the suspicious data involving with subjective logic theory. After fusing the opinions of all the neighbors, SLB gets the quantitative anomaly score, which demonstrates the degree of the suspicious data being considered as an anomaly. We extend SLB to ESLB in order to avoid the impact of those neighbors whose data are suspicious, effectively distinguish the faulty data from the informational data, and take the historical spatial correlations of the node and its neighbors into account.
The main contributions of this paper are as follows.
Proposes SLAD framework which takes the uncertainty of neighbors to the data of the node into account. It redefines opinion deriving from subjective logic theory and can more realistically describe the view of neighbors on the data of the node. Presents SLB and ESLB algorithms. SLB fuses all the opinions of neighbors for the data of the node to get the quantitative anomaly score of the data. We extend SLB to ESLB to improve the performance further. Constructs the experiments to verify the detection performance of the framework we propose. Simulation results show that SLAD framework is effective and gains a lot of performance improvement of anomaly detection compared with the previous approaches.
The rest of the paper is organized as follows. Section 2 summarizes the related work of this paper. Section 3 presents preliminary concepts. Our framework SLAD is introduced in Section 4. Section 5 gives SLB algorithm and its extended algorithm ESLB. Section 6 discusses some problems which are not involve in the above sections. Section 7 describes the experimental setup and evaluates the performance of framework in realistic data set. Finally, Section 8 concludes the paper.
2. Related Work
Lots of efforts have been made in recent years to detect the anomaly in wireless sensor networks. We briefly survey the recent researches relevant to our work as follows.
First category involves voting algorithm and its improved algorithms. Authors in [6] propose majority voting algorithm. If some node v is aware that it's sensing data x maybe anomalous, it sends x to its all one-hop neighbors. Each neighbor
Second category is to detect anomaly in the process of aggregating data in the network. Authors in [8] propose a robust aggregate framework, which performs the similarity tests among sensor nodes to classify the particular node as anomaly. It returns the aggregate results excluding anomaly, which is also maintained and sent to the users. Furthermore, authors in [9] define minimum support MinSupp, which is the minimum count of sensor nodes to prove the data of the node being normal or anomalous. For some node holds on anomalous data, if it has MinSupp number of nodes whose data are similar to it, it is determined that some events happen, otherwise it is faulty data. On this basis, [10] present the in-network anomaly detection framework based on position sensitive hash function. It achieves the load balance of the network. Using comparison pruning methods, it assures the detection performance and energy efficiency. Authors in [12] introduce PAO framework to reliably and efficiently detect anomaly in WSNs, which is able to operate over multiple window type, and operate in exact or approximate mode suiting for a variety of application requirements. However, the outputs of similarity test for all these frameworks mentioned above are also only yes or no, which depends on the prethreshold, and do not provide quantitative determination, which are similar to the voting algorithms.
The third one regard the sensing data of the nodes as time-series data to some extent. Authors in [13, 14] construct autoregressive (AR) models for sensor nodes. Every sensor node sends the coefficients of the models to sink after establishing AR models, and sink estimates approximate values of the sensor nodes in the following rounds without getting real data from sensor nodes. Thus, it reduces the number of messages sent in the network a lot. Once the data are no longer predicable from AR models, it maybe due to that the models are not suitable to the data or anomalous data arise. If the reason is the former, it needs reconstructing AR models and repeating the process mentioned above. Otherwise, the anomalous data are identified to be eliminated or corrected. Authors in [13] use two thresholds to distinguish them. However, the approach only relies on the predefined thresholds and does not employ the spatial correlations among sensor nodes. If taking spatial correlations into account, it can make full use of neighbors' opinions to achieve better performance of anomaly detection.
According to the above-related works, we can draw the conclusion that providing quantitative opinions is very important for anomaly detection after self-monitoring on each node in WSNs. As we know, in subjective logic theory, the subjects express subjective beliefs about the truth of the objects with degree of uncertainty and indicate subjective belief ownership whenever required [15, 16]. Subjective logic provides the quantitative evaluation for the trust degree of the object. From this perspective, judgment among the adjacent nodes in WSNs is similar to trust evaluation. So we take subjective logic theory into the anomaly detection in WSNs. Subjective logic is involved to offer quantitative neighbors' opinions about the suspicious data of the node.
Besides, authors in [17– 19] use machine learning techniques to detect anomaly in WSNs, which are different from our solution. For machine learning techniques are resource intensive that are difficult to be implemented on sensor nodes, the early studies, for example [17], run their algorithms on gateway (or sink). Authors in [17] identify anomalies in critical gas monitoring using offline echostate network in an underground coal mine. The following researches try to do something to make it possible to run the algorithms on sensor nodes. Authors in [18] compares and classifies the input signals in accordance with online learned prototypes on node-level, and then sends the results of classification to a fusion center for further processing. Based on [17], the authors in [19] propose a general anomaly detection framework which unifies fault and event detection. It runs on sensor nodes, distinguishes faults from events, and improves the performance of detection. The focuses of [18, 19] are how to select appropriate machine learning techniques and then decrease the complexity to make the algorithms be suitable to run on nodes. It is different from our solution, the difficulty of which is how to provide the quantitative neighbors' opinions to improve the performance of detection.
3. Preliminaries
Suppose that a sensor network is modeled as an undirected connected graph
For the data of sensor nodes can be regarded as time series data [13, 14], we construct AR model on each node. Suppose that the data of node
We make the following assumptions about our framework.
The wireless sensor network is static, and the topology does not change in the network lifetime. All sensor nodes are homogeneous and have the same energy and capabilities, and there is only one sink which holds on infinite energy. Sensor nodes are deployed densely; that is, if some events happen in the network, adjacent sensor nodes (one-hop neighbors) can monitor them at the same time. Of course, the situation can be extended to not densely deployed, which will be discussed in Section 6.
4. SLAD Framework
SLAD framework consists of three phases: preprocessing, self-monitoring, and cooperant detecting. Among them, preprocessing phase is executed on sink, self-monitoring run on each node, and cooperant detecting is semidistributed algorithm, that is, run on sink and sensor node.
In the first phase, all sensor nodes collect N rounds of data and transmit them to sink. Sink constructs autoregressive models
For each node
In the second phase, each node uses p coefficients of its AR model and the most recently p rounds of data to predict current round of data. If the difference between the predicative data and the real data is less than the threshold τ, SLAD considers the data as normal. Otherwise, the data is regarded as suspicious which needs to be determined further among adjacent neighbors. It is noted that, if the data is thought to be normal, it does not compute the confidence interval. However, while v considers
In the third phase, sensor node whose data is suspicious sends its data to all its neighbors, and each neighbor produces its opinion about the suspicious data. SLAD fuses all the neighbors' opinions and gets the expectation of the consensus opinion. And thus we get the anomaly score of the suspicious data. If the anomaly score is more than the threshold, the suspicious data is anomalous, or else the data is normal. Additionally, to avoid the impact of those neighbors' opinions whose sensing data are suspicious, SLAD removes those opinions from the consensus opinion. In order to take the historical spatial correlations of the node and its neighbor nodes into account, SLAD computes the neighbors' opinions in another way. For the reason of different treatments to faulty data and informational data, SLAD adopt the approach as follows. The suspicious data, if anomalous, is to be marked as faulty data. When the faulty data of sensor nodes at this round are all sent to sink, sink distinguishes faulty data and informational data by employing the spatial correlations of adjacent nodes. The detailed process will be discussed further in Section 5. The third phase is the fundamental step of SLAD framework, which will be discussed in detail in Section 5.
5. Subjective Logic-Based Algorithms
In WSNs, no neighbor can always say that the data of the node are absolutely normal or anomalous, and something is neglected by previous works which we call uncertainty. On the other hand, subjective logic theory is suitable to model the situations with consideration to uncertainty. This drives us to involve subjective logic theory in anomaly detection to improve the detection performance.
Before detailing the subjective logic-based algorithms, it is necessary to address three problems, including expressiveness of neighbors' opinions, value assignment of neighbors' opinions, and consensus of neighbors' opinions. With the solutions of the problems, we propose SLB and ESLB which is the extension of SLB.
5.1. Expressiveness of Neighbors' Opinions
Definition 1.
Given sensor network

Definition 1 defines neighbor
5.2. Value Assignment of Neighbors' Opinions
In this section, we discuss how to determine neighbor's opinion
To scale them down, we take advantage of the observation that the data of the nodes are changing smoothly most of the time and changing nonsmoothly every some periods for the reason the sampling rates of the nodes are high in WSNs. We have taken into account the data trends while constructing AR model. So we just use the data at the current round to determine neighbors' opinions while the data are changing smoothly. Only while the data are changing non-smoothly, we use several rounds of data to get the neighbors' opinions. As we know, data trends of the nodes can be get according to historical data.
The detailed opinion If the data are changing smoothly,
If the data are changing nonsmoothly,


5.3. Consensus of Neighbors' Opinions
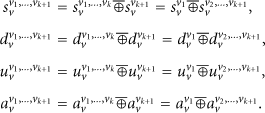
The opinions of neighbors
Lemma 2.
Given
If
If

Proof.
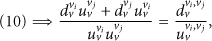
From [15], we know that posteriori probabilities (ppdf) of binary events can be expressed as

Here
Let
Let
The following is the process to prove that the equations of the lemma are correct. Because we want to get the consensus about the proposition on node v's data is anomalous, we get the equations with exchanging r and t of (9); respectively,


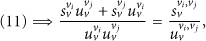


Let
If

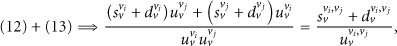
Combining (17) onto (12), we get

Combining (17) onto (13), we obtain
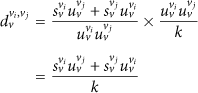

If
To be simply presented, we denote
Example 3.
Suppose that the opinions of neighbors
As we all know, each node has many neighbors in WSNs. We need to fuse the opinions of all neighbors into the consensus opinion. Suppose that node v has m neighbors, their opinions about the data of v are
Theorem 4.
Given i neighbors

Proof.
We utilize the mathematical induction approach to prove the theorem.

we need to prove that (21) is true while

It is equivalent to

For


Equation (26) = (28); that is,
It is easy to know that the others (
The above procedure illustrates that (21) is true while i is no less than 2 and no more than m. That is, the theorem is proved to be true as follows:

Given m neighbors
Definition 5.
Suppose that the consensus of all the neighbors' opinions about node v's data is

There are some to be said. In the scenario that node v has one neighbor, Lemma 2 is not able to deal with it. To do with that, we suppose an imaginary neighbor who holds the opinion
In the following sections, we present two algorithms to further determine whether suspicious data are normal or anomalous. The notations used to describe the algorithms are shown as in Table 1.
Notations used in the algorithms.

5.4. SLB Algorithm
The process of subjective logic-based algorithm (SLB) is as follows with discussion above. This process is executed among the node and its neighbors. Supposing node v has m neighbors
(1) (2) (3) compute the opinion (4) (5) (6) (7) (8) compute the opinion (9) (10) (11) get the consensus opinion (12) compute the expectation (13) get the anomaly score (14) (15) x is normal data, (16) (17) x is anomalous data, (18) (19)
5.5. ESLB Algorithm
SLB algorithm fuses the opinions of all the neighbors about the data of the node to decide whether the data is normal or anomalous. However, it has the following disadvantages. (1) In the process of judgement among the node and its neighbors, the opinions of the neighbors whose data are suspicious are also included so as to affect the performance of anomaly detection. It is more severely affected especially when the proportion of anomalous data is ascending. (2) It does not distinguish the faulty data from the informational data. (3) The base rate a of all the neighbors' opinions is set to 0.5 which is not reasonable. It does not take the historical information of the node and its neighbors into account.
To overcome the disadvantages of SLB, we extend SLB to ESLB. For the first point, ESLB removes the opinions of those neighbors whose data are suspicious. To solve the second point, ESLB employ the correlations of anomalous data. If those data are spatial correlated, they are the informational data or else the faulty data. Thirdly, we define a as follows in considering the historical information.
Suppose that
Definition 6.
Given the historical opinion of neighbor 
Theorem 7.
Suppose that historical opinion of neighbor
Proof.
From the definition of the expectation, we know that


We extend SLB to ESLB algorithm as follows. If the data x is suspicious, node v turns to its neighbors set
(1) (2) (3) node v turns to its neighbors (4) (5) (6) (7) (8) (9) (10) (11) compute historical opinion (12) call SLB Algorithm (Line 1–10) to compute current opinion (13) (14) (15) call SLB Algorithm (Line 11–18) to get the result whether x is normal (16) (17) (18) (19) (20) (21) send message (22) (23) (24) sink receives all the messages at round r, and analyzes neighbors holding on faulty data at this round //following executes on sink node (25) (26) (27) x and (28) (29) x and (30) (31) (32)
6. Discussion
There are some problems to be explained further. First, authors in [8, 9] point out that voting algorithms cannot deal with the situation, in which the events are detected by sensor nodes which are not adjacent. However, our framework can do with the situation after minor revision. For example, suppose that node
Second, in order to reduce the energy consumption, we use the idea proposed by [13] to construct and maintain AR models. (1) It avoids unnecessary data transmission. While the data of nodes are normal, it does not transmit data in the network but estimates the data according to AR models by sink. (2) It reduces the computational complexity of constructing and maintaining AR models. The main computation is executed on sink and not sensor nodes. Please refer to [13] for more detail.
Third, although the thresholds, like θ and
7. Simulation Results
7.1. Experimental Setup
We implement our simulation experiments in OMNET++ platform [20]. The topology and the sensing data come from Intel Berkeley research lab data set [21]. 54 sensors are deployed in the Lab of
While using
If the sensing data are changing nonsmoothly, we would use the vector data to compute neighbors' opinions. To compute the base rate of neighbors to the node (historical information), it also needs to utilize the vector data. So, it needs to select the appropriate length of vector data

Impact of length on detection rate.
We randomly change some of normal data as faulty data and define the faulty rate as the proportion of faulty data to the whole data. In the experiments, we compare the performance of different algorithms at various faulty rate, and the results are mean of 20 times of executions.
7.2. Comparison of Detection Performance
In order to compare the anomaly detection performance of different algorithms, we define detection rate, false detection rate, and undetection rate. Among these definitions, the whole experimental data set is denoted as
Definition 8 (detection rate).
It is defined as the faulty data which are determined as faulty in the proportion of the real faulty data:

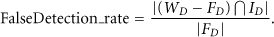
Definition 9 (false detection rate).
It is defined as those normal data which are determined as faulty in the proportion of the real faulty data:
Definition 10 (undetection rate).
It is defined as those faulty data which are determined as normal in the proportion of the real faulty data:

In this section, we compare the performance of different algorithms. These algorithms are listed as follows. (1) MV (majority voting algorithm) [6]. (2) DWV (distance weight voting algorithm) [7]: it use the Euclidean distance of sensor nodes as the weight, and the weight is smaller with the distance being farther. Please refer to Section 2 about the details of
Figure 2 shows the detection rate of five algorithms at different faulty rate. It indicates that detection rates of all the algorithms are greater than 0.8 when faulty rate is low. The performances of

Detection rate of different algorithms.
Figure 3 presents the detailed comparison results of these algorithms at different faulty rate. The false detection rate of all the algorithms increases as faulty rate becomes larger. The false detection rate of
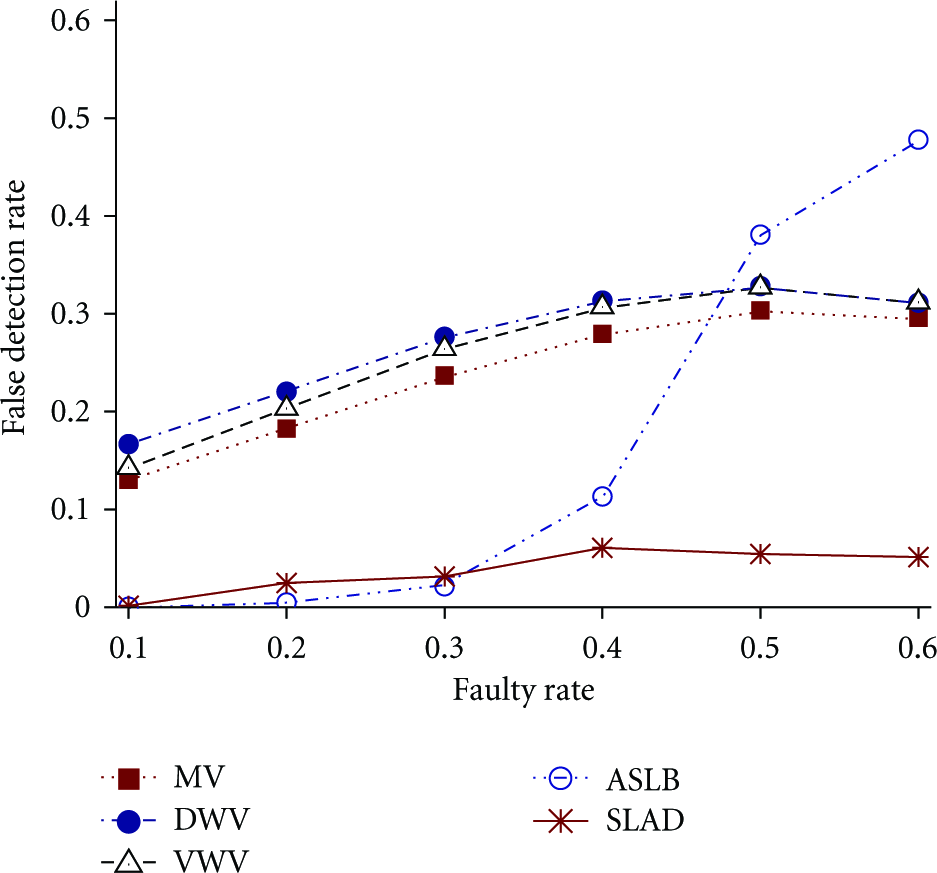
False detection rate of different algorithms.
We then study the impact of different faulty rate on undetection rate of these algorithms. The undetection rate of
From the above figures, we note that
We also draw the following conclusion according to Figures 2, 3, and 4. The overall performance of

Undetection rate of different algorithms.
The above experiments discuss the cases that the network are only involving the faulty data, and not including the informational data. In the monitoring area, some events randomly arise. The anomalous data of sensor nodes detecting the events are spatial correlations (i.e., informational data). The faulty rate, which is defined as the number of informational data in proportion of the whole data, is set to 0.2. The experiment shows that detection rate of
7.3. Impact of Radio Range on Detection Performance
In this section, we analyze the impact of radio range on detection rate, false detection rate, and undetection rate at different faulty rate. The number of neighbors affects the detection performance of the algorithm. Different radio range of the nodes leads to different number of neighbors. Thereby, we discuss the detection performance of
We conduct the experiments to compare the detection performance of

Impact of radio range on detection rate.

Impact of radio range on false detection rate.

Impact of radio range on undetection rate.
8. Conclusions
In this paper, we present SLAD framework which considers the uncertainty of neighbors to the data of the node. It includes three phases: pre-processing, self-monitoring, and cooperant detecting. In the first phase, sink constructs AR model for each node. In the second phase, it uses AR models to check whether the sensing data are suspicious. In the third phase, it presents two novel algorithms SLB and ESLB. The third phase is the key of our framework. In SLB, each neighbor gives the quantitative opinion to the suspicious data involving with subjective logic theory. After fusing the opinions of all the neighbors, SLB gets the expectation of the consensus opinion and anomaly score, which demonstrates the degree of the suspicious data being considered as an anomaly. We extend SLB to ESLB in order to avoid the impact of those neighbors whose data are suspicious, effectively distinguish the faulty data from the informational data, and take the historical spatial correlations of the node and its neighbors into account. Simulation results show that SLAD framework improves the performance of anomaly detection effectively compared with previous works.
However, we find there is something to do for further improving SLAD. We believe that the opinion of the neighbor, who holds the higher historical spatial correlation with the node, should be paid more attention to. An example is given to demonstrate that. Suppose node A and node B are the neighbors of node C and node A and node C are located in the room while node B is out of the room. Generally, the historical spatial correlation between node A and node C is higher than that between node B and node C. Thus, the opinion of node A to node C should be given more attention. Unfortunately, the subjective logic, which works as the foundation of SLAD, treats the opinions equally and has no capability to deal with it. As the preparatory work, we proposed an operator for subjective logic which is capable of making the consensus on several neighbors' opinions with their weights in a fair way [22]. With the support of the new operator, we can map the historical spatial correlation to the weight of the opinion to improve SLAD. In theory, we believe it will improve the performance of anomaly detection for SLAD. It is our future work.
Footnotes
Acknowledgments
This work is supported by the National Science Foundation (61070056, 61033010), the National 863 High-tech Plan (2008AA01Z120), Program for New Century Excellent Talents in University, and the Research Funds of the Renmin University of China (10XNI018).