
Abstract
We consider a set of mobile wireless sensors that collect observations about a brief, localized event. As they continue to move about, one of them processes its observations, decides that an event of interest occurred, and wants to determine if other sensors confirm its results. This sensor assumes the role of a Cluster Head (CH) and requests that all other sensors that collected observations at that time/location reply to it with their decisions. The motion of the sensors since the observation time determines how many wireless hops their decision must cross to reach the CH. We analyze the effect of this motion in the 1D case by modeling each sensor's motion as a Correlated Random Walk (CRW). We also account for measurement errors and communication or processing errors in each wireless hop. Quantities, such as the error probability of the final decision at the CH and the minimum energy required to collect the local decisions from all relevant sensors, can then be directly calculated as functions of time and the parameters of the CRW, the measurement noise and the channel noise. These results allow rapid characterization of the time-dependence of distributed detection algorithms that are executed in mobile sensor networks.
1. Introduction
The systems-level work reported in this paper is motivated by a security scenario that has arisen in the context of the eStadium project [1–3], which develops smartphone applications/games, wireless communication networks, and wireless sensor networks for football games and other large-scale events. One security scenario of great interest occurs in the hour immediately before or immediately after a large event. At these times, large numbers of fans, stadium personnel, and concession staff are typically walking toward or away from the stadium. This is a time when they are very vulnerable to deliberate or accidental exposure to hazardous chemical or biological agents.
Suppose that the smartphones that the fans are carrying, or possibly the tickets that they have bought, have sensors embedded in them that can detect these agents. Capabilities like this are the goal of the US Department of Homeland Security's “Cell-All” program [4]. These sensors would necessarily be small and inexpensive and might thus have high false-alarm rates or low rates of correct detection. It is thus important that as many of their individual decisions as possible be fused with each other to ensure a correct final decision. They must therefore be able to communicate with each other or with a designated Cluster Head (CH) to accomplish this goal. These mobile, battery-powered, wireless sensors can thus be modeled as a mobile ad hoc network that is supporting an application that performs distributed detection.
Our first goal is to develop algorithms to efficiently calculate the performance of distributed detection algorithms in this dynamic and complex scenario. These numerical algorithms should account for as many factors as possible, including the motions that are typical of people in crowds, measurement errors in the sensors, errors made during wireless communication, and fusion algorithms with low enough complexity that they can be executed on very low-power processors or on processors that are shared by many different applications.
This paper is organized as follows. Section 2 describes the scenario that has motivated the work in this paper and that is analyzed as an example in Section 8. Prior work in this area is summarized in Section 3. In Section 4, the transient behavior of semi-infinite correlated random walks is reviewed. The solution to the finite case, which is a good model for the motion of people in the scenario of interest to us, is provided in Section 5. Its statistical properties that have the greatest impact on detection applications are analyzed in Section 6. In Section 7, the performance of detection tasks in mobile wireless sensor networks is determined. Numerical and simulation results are provided in Section 8 for the scenario described in Section 2. They demonstrate (i) the use of the mobility model in calculating the minimum energy required to collect data from each sensor participating in the data fusion process, and (ii) the decision error probability at the cluster head once the decisions from all participating sensors have been gathered. These two quantities are functions of both time and the parameters of the mobility model and we demonstrate how the results in this paper provide the ability to rapidly and accurately calculate or simulate them. Some conclusions and a discussion of future work are provided in Section 9.
2. Scenario: Distributed Detection in a Mobile Ad Hoc Network
To evaluate the tools developed in this paper, we assume a situation like that shown in Figure 1. The wireless nodes shown in the figure are carried by people or vehicles that are moving. They have been moving for some time, generally toward the stadium entrance, which is at position
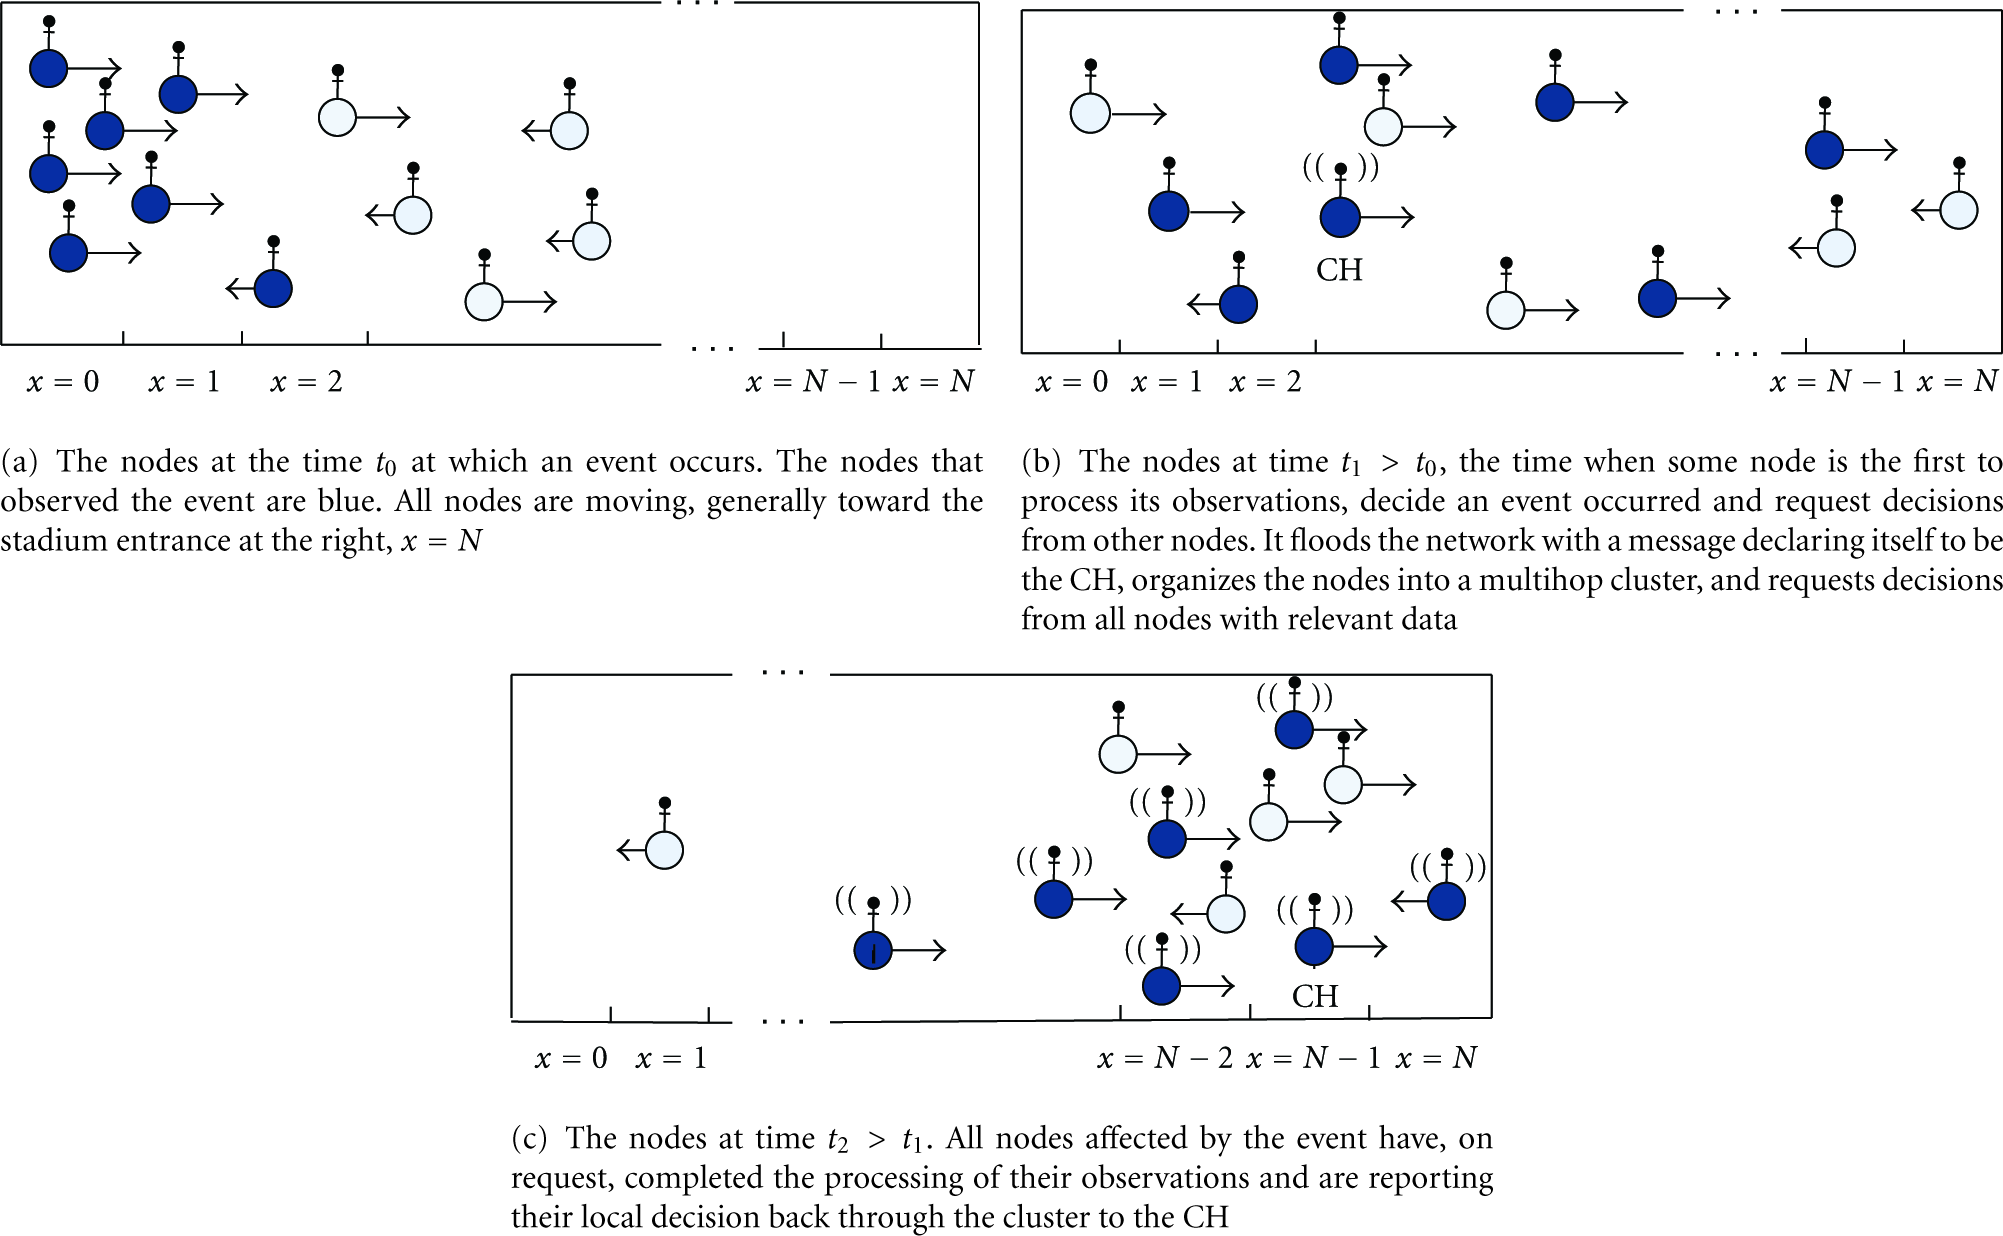
A security scenario that arises when large crowds are moving toward a stadium or other venue to participate in an event.
At time
At time
At time
It is during this data collection phase that the behavior becomes quite interesting. From the moment it starts, we want to determine the best decision that the CH can make given the multi-hop network that exists at time
We develop analytical models of this scenario and numerical methods to calculate the best possible performance that can be expected at any time t. We are thus interested in the behavior of the network as it changes over time, where these changes are due to the motion of the crowd. The transient behavior of stochastic models of this motion is critical to understanding this scenario and eventually determining the optimal time at which to make a decision.
We must first model how sensors organize into a cluster, which must be done very rapidly in mobile, event-driven scenarios. We thus assume the existence of a very fast, low-complexity algorithm for clustering that is triggered by an event—in this case the request by one node for other nodes' data. The algorithm we choose is the one defined and analyzed in [5, 6]. We will only consider the single-cluster case that is created in the scenario in this paper; the more general case of hierarchical clustering is relevant if we need to collect results from all sensors participating in an event. In this more general case, many thousands of sensors may be involved, one for each person attending the event.
In the single-cluster scenario, the communication architecture is some variation of the 2-hop cluster shown in Figure 2. The sensor in the center of the cluster, called the CH, is the one that requested the decisions from other sensors. The sensors shown in the first ring are one wireless hop from the CH; the ones in the second ring are two hops away, and so forth. Three sensors in a sector of ring 2 are shown forwarding their decisions to one sensor in ring 1. Each sensor's observation is affected by measurement noise and all communications throughout the network will be affected by channel noise, fading, and transceiver errors. Because the cluster is multi-hop, decisions forwarded from the outer rings will suffer repeated exposure to the sources of communication error and more energy must be expended to get them to the CH.
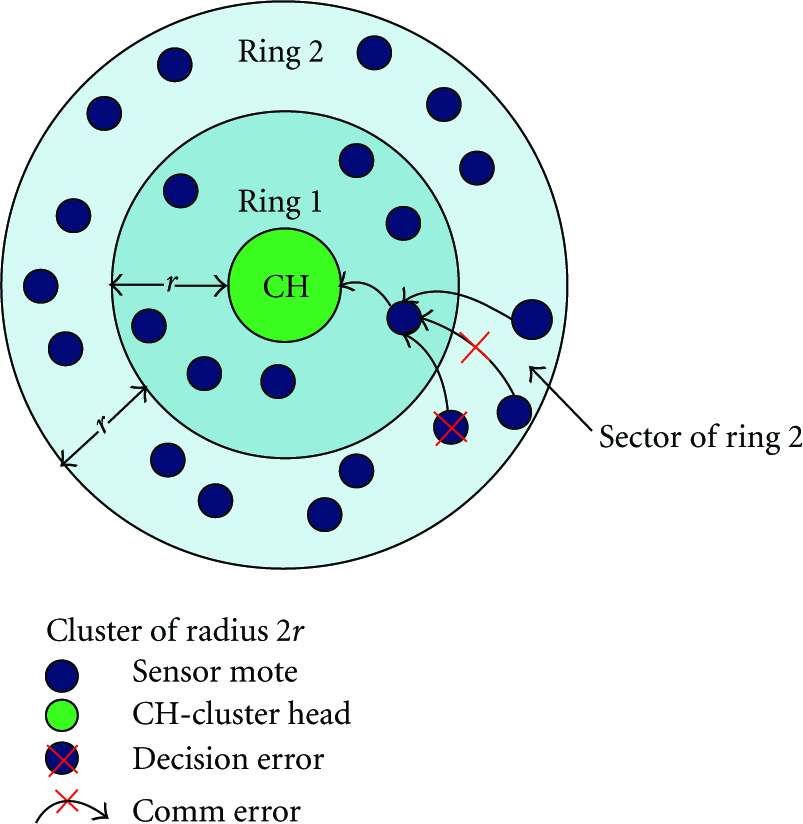
A 2-hop, 2D cluster. The mobility of the sensors produces this temporary, multi-hop cluster. Each sensor's decision may be incorrect because of measurement noise; transmitted packets may suffer bit errors because of noisy communication channels. If the number of hops in the cluster increases with time, the energy required for communication will increase and detection performance will decrease.
The mobility model governing each sensor and the time since the event of interest will clearly affect the number of hops, and thus both the probability of detection at the CH and the energy consumed to gather the local decisions. It will also affect the network's performance in terms of coverage, maximum throughput, and throughput-delay trade-offs.
3. Prior Work on Mobility Models and Distributed Detection
Many mobility models have been proposed for analyzing the behavior of mobile ad hoc networks like the one described previously. In [7, 8], those models are categorized into four classes: random models, models with temporal dependency, models with spatial dependency, and models with geographic restrictions. For instance, random walks and random waypoint models are random models; Gauss-Markov mobility models and Smooth Random models are models with temporal dependency; group mobility models [7] are models with spatial dependency; Pathway mobility models and Obstacle mobility models are models with geographic restrictions. These models are useful as analytical or simulation tools but none of them can account for all of the constraints or features of real systems.
We thus use Correlated Random Walks (CRWs) as the model for the motion of the sensors in our security scenario. They can account for time dependency, geographical restrictions, and nonzero drift. They are more general than random walks but are still amenable to analysis, sometimes in closed-form. The limiting distribution for a discrete-time 1D doubly-infinite CRW on the integers was derived in [9]. The probabilities of being at any lattice point at the nth step for a discrete-time 1D CRW in different cases were found in [10–13]. The absorbing probability and expected duration of a discrete-time CRW was found in [14]. The transient behavior of the continuous-time CRW on a semi-infinite, 1D state space, is solved, in closed-form in some cases, in [15]. The behavior of multiple sensors whose motion is modeled by discrete-time processes related to CRWs has been studied in [16]. In this paper, we use continuous-time, 1D CRWs on finite state spaces to calculate the behavior of mobile sensors in the security scenario described previously.
Ultimately, our goal is to determine—by numerical analysis instead of simulation—the effect of the mobility of the nodes on the detection problem that exists at the application layer of the mobile, ad hoc network. The performance of these applications will vary with time because of the nodes' motions. Understanding the significance of these transient effects, and being able to precisely determine such quantities as a lower bound on the probability of detection, is critical to developing a strategy for reaching a decision meeting certain criteria in the minimum amount of time.
In [17], an optimal distributed detection strategy in a single-hop network was studied. In [18], a decentralized detection problem under bandwidth-constrained communication was investigated. The noise at different sensors was assumed to be independent, but the statistics of the noise were assumed to be unknown to the CH, so it treats all received detection results equally. It is shown in [19] how the performance of detection algorithms is improved by knowledge of the channel. The limits of detection performance in a one-hop sensor cluster with nonideal channels were determined in [20].
In [21], the performance of distributed detection in a random sensor field is analyzed. The works of [22, 23] discuss the distributed detection problem for Gaussian signals under communication constraints. In [24], the authors consider the detection and localization problem of material releases with sparse sensor configurations. In [25], the sensors adopt robust binary quantizers for distributed detection. Censoring and sequential tests have also been adopted in distributed detection to achieve the same detection accuracy with less energy [26, 27], and they have been combined to further save energy [28, 29].
4. Basic Results on Transient Analysis of a Correlated Random Walk on
In this section, we briefly review results on the transient probability distributions of continuous-time, 1D CRWs on
It takes a step in the same direction as its previous step with probability
The time at which the sensor takes its next step is governed by a Poisson process of intensity λ.
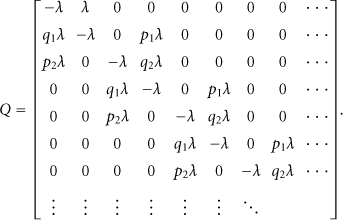
A CRW on

A Correlated Random Walk (CRW) on
Let


For this QBD process,


The boundary variables must also satisfy the following:


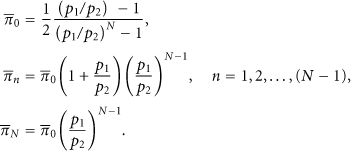
We find numerically that, for all possible values of
Thus by recursion,

5. New Results on Transient Analysis of Correlated Random Walks on
A CRW on


A Correlated Random Walk on
Thus, solving for

As a check on the aforementioned results for the transient behavior of the CRW, we can use the previous results to find its limiting distribution. Since
Note that this approach to analyzing the transient behavior of a simple CRW can be extended to model more complex motion. The number of states in each level of the QBD—two states in the case of the CRW in Figure 4—can be increased. With four to five states per level, the walker can pause, can walk at different speeds at different times, and so forth. The only difference in the algorithms for calculating the transient distribution is that the eigenvalues and eigenvectors of
6. Statistical Properties of Distances of Nodes from the CH
Suppose that the CH is motionless and there are a total of K sensors in the cluster. As described in the introduction, they start at the the same location as the CH (

Now assume that the CH is also mobile, that its position is governed by the same CRW as any sensor, and, as before, their motions are all independent. Then

The probability distribution of the distance between any two sensors


Thus, for both the motionless- and mobile-CH cases, computing
7. Detection in Wireless Sensor Networks
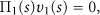
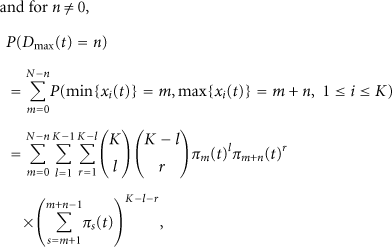
Here we assume a multi-hop sensor network in which each wireless hop is modeled as a Binary Symmetric Channel (BSC). The BSC cross-over probability captures the effect of channel errors on each individual decision bit and is easier to estimate than the full characteristics of the channel. The assumptions of symmetry and the same cross-over probability for each mote-to-mote channel are easily relaxed—they are used only to simplify the analysis so that important trends can be discerned. This paper also assumes that the error probabilities of the individual-received detection results are learned over time by the CH. Hence, the CH is assumed to know the optimal weights for the weighted median in the MAP detector [35] it uses to fuse the received detection results.
In [35], a MAP approach to the distributed detection problem in a multi-hop cluster in a sensor network was developed. It considered a cluster with K rings and
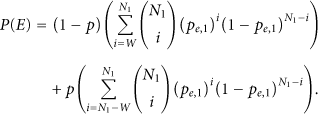
In a one-hop cluster, suppose that the correct decision should be s. Assume the prior probability
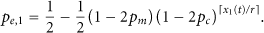
Now we summarize key results in [35] for the multi-hop case. For a mote that is k hops away from the CH, the detection result received by the CH after being relayed over these hops has error probability:

Theorem 1.
Define
Because the weighted median is the MAP detector, we assume—even for sector-level fusion algorithms—that the CH calculates this weighted median after receiving inputs from all motes in the cluster. To understand what happens in these more complex cases, the asymptotic behavior of the weighted median must be determined for the single- and multi-hop cases; otherwise, it is too difficult to determine the probability of a clusterwide decision error at the CH.
The asymptotic behavior of the median filter in one-hop clusters has thus been studied using large deviation techniques in [36]:

We now find the error exponent for the decision error probability for the multi-hop case.
Theorem 2.
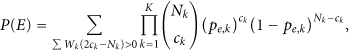
In multi-hop sensor networks in which

Proof.
In the context of the weighted median filter, the decision error probability at the CH is


This error exponent is accurate and the bound is tight when the motes are densely deployed; that is, the number of sensors is large. Minimizing
Figure 5 compares the large deviation bound on the error probability with the error probability from simulations for a 3-ring cluster. It shows the desired result that the large deviation error exponent is accurate—the bound is parallel with the simulation result over the entire range of spatial densities. Of course, the bound is high by a multiplicative factor, which is often the case with large deviation techniques.

Comparison for a 3-ring cluster of the error probability obtained via simulation and its large deviations bound. The error exponent is clearly correct and the difference approaches zero asymptotically. Comparing the performance of complex strategies via their error exponents will thus correctly show which strategy is best when motes have large numbers of 1-hop neighbors. Direct calculations and simulations are used to confirm those results for small to moderate numbers of neighbors.
If the CH is static, then we have

The expected energy consumption for collecting the data is then

If the CH is also mobile and its position is governed by a CRW, then we have


8. Numerical Results
Figure 6 shows the transient probability distribution of two CRWs on

Transient probability distribution calculated for two CRWs on
Figure 7 shows the transient probability distribution of the distance from a static clusterhead to the furthest of five mobile sensors for each point in time. The static clusterhead is assumed to be at location 0. This distance d is important for calculating the number of wireless hops between each sensor and the CH that is trying to gather data. If the transmission radius of each sensor is r, then the number of hops to the CH is the ceiling of

Calculations of the transient probability distribution of the distance d from a static CH to the furthest of five sensors that are moving according to independent CRWs on
Figure 8 shows the transient probability distribution of the maximum distance between any of the five sensors and the CH when the mobile CH moves according to the same mobility model as the sensors. This is probably the most realistic case for mobile networks. It leads to an interesting phenomenon when the motion is on a finite grid and the CRWs are all asymmetric in the same direction. The sensors start at 0 when they gathered their observations. With time, they spread out but they all tend to move to the right. As they get close to the other barrier, they then tend to bunch up again. This effect is similar to a crowd moving in a given direction and then gathering around that destination. The distance here, when divided by the transmission radius of the sensors, tells the maximum size, in wireless hops, of the cluster.
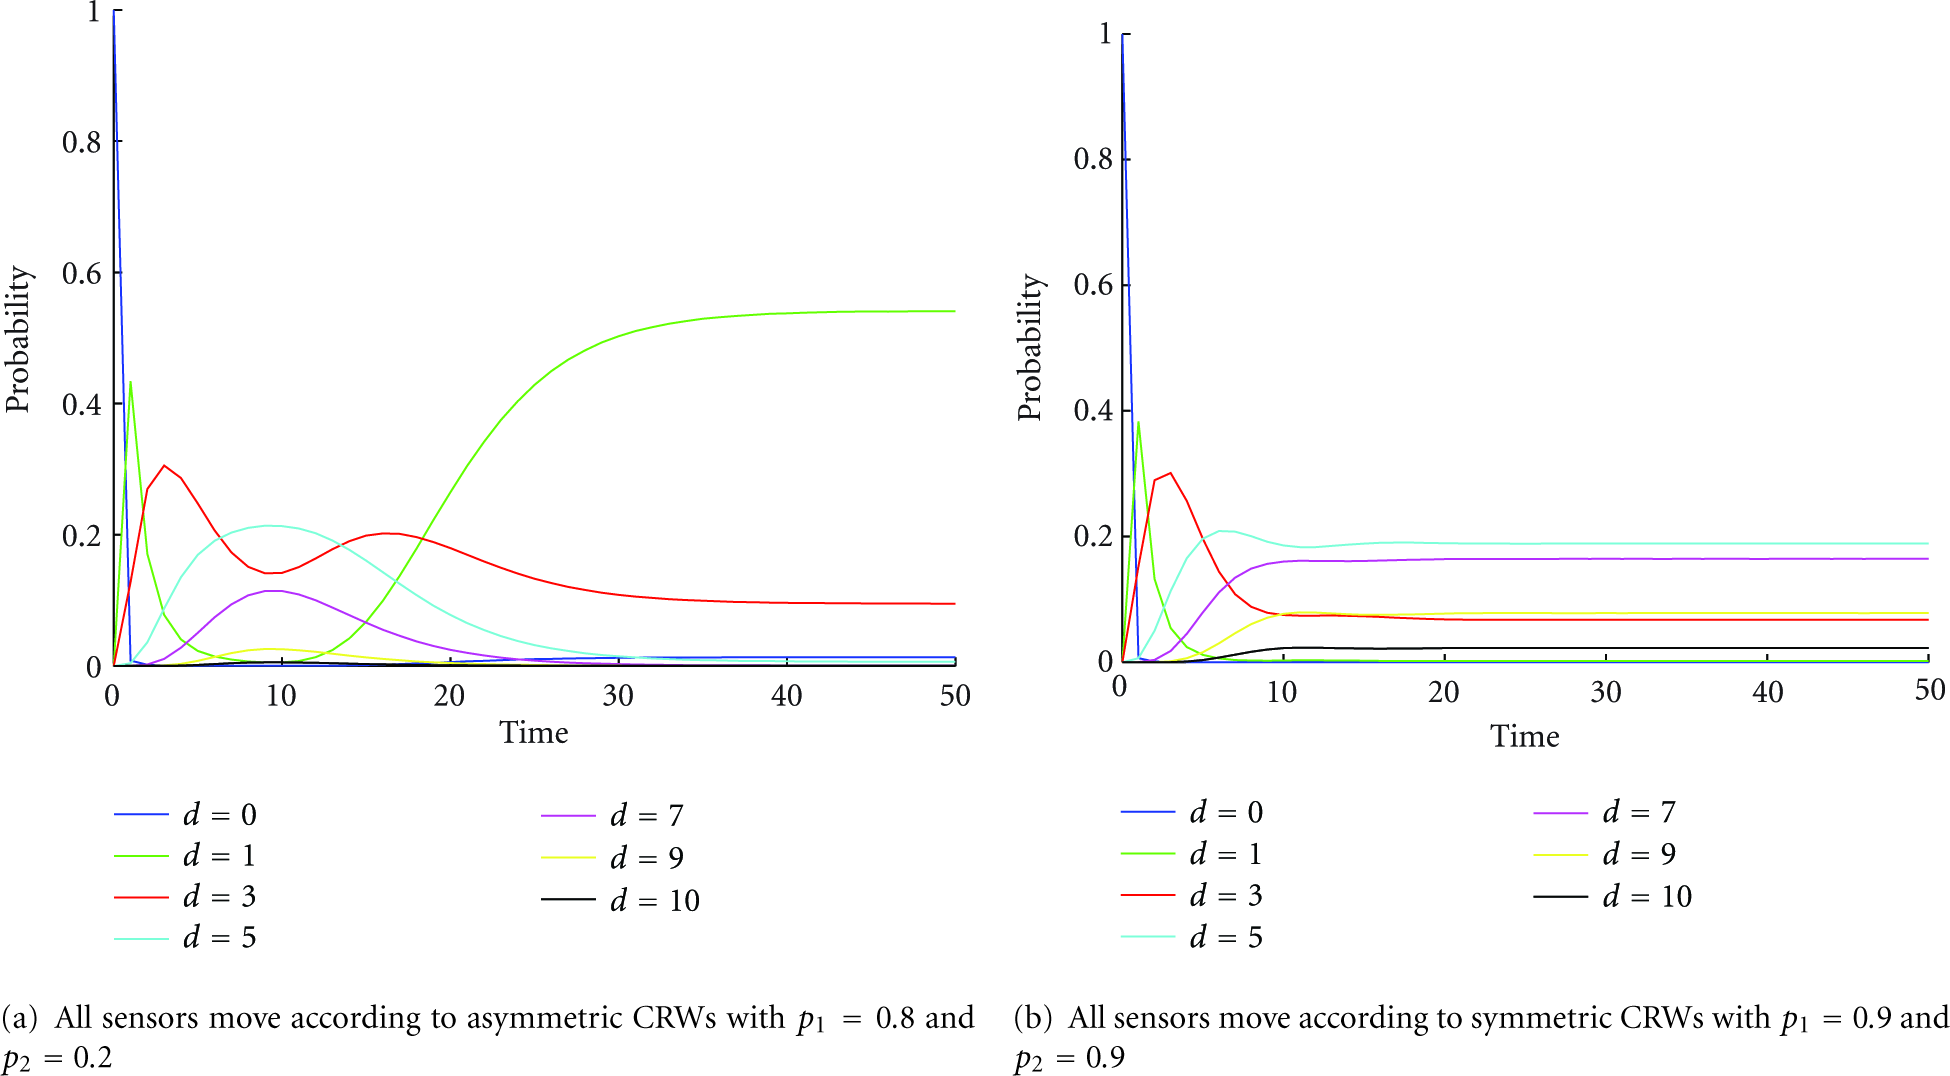
Calculations of the transient probability distribution of the distance d from a mobile CH to the furthest of five sensors for d from 0 to 10. The CH and the sensors are all moving independently and according to CRWs on
Figure 9 shows the expected energy consumed—as a function of the time at which data collection starts—for a static or mobile CH to collect one packet of data from five mobile sensors. The six sensors all collected measurements at the same time/place but then continued to move. By the time a request to send in all data has been received, they are at locations in the state space with probabilities determined by their CRWs. The data collected and decisions made by the sensors that have wandered the furthest require the most energy to collect—that data must travel over the largest number of hops to reach the CH.

Calculation of the expected energy consumed by the network when the collection of data from the five mobile sensors begins at time t. The cases considered are when the transmission radius of each sensor is
Note that some curves in Figure 9 have a stepped appearance. This is due to the existence of the rings in the network that result from the fixed transmission radius for each node. When a node in ring i moves further from the cluster head, it may cross from ring i to ring
Also note that the mobility of the CH has a significant impact on the energy consumed to collect data. If it is mobile and all sensors are moving according to a CRW that is asymmetric, then the energy required for collection first increases and then decreases. In this case, it is better to collect data either very quickly after the event, or, if that is not possible because of the time to process measurements, to wait until the CH and the other sensors bunch up again at their destination.
Figure 10 shows the large deviation bound of the error probability as a function of time for a static or mobile CH to collect one packet of data from five mobile sensors. It shows good agreement with the results in Figure 9, which shows the expected energy consumption as a function of time for a static or mobile CH to collect one packet of data from five mobile sensors.

Calculation of the large deviation bound of the error probability when the collection of data from the five mobile sensors begins at time t. The cases considered are when the transmission radius of each sensor is
Figure 11 shows the expected error probability as a function of time for a static or mobile CH to collect one packet of data from five mobile sensors. The same comments made previously about the effects of the mobility of the CH, and the effects of symmetric and asymmetric CRWs, apply here. The values of the probabilities of the nodes locations used to calculate these expected error probabilities were obtained in this case by simulations of the CRW.
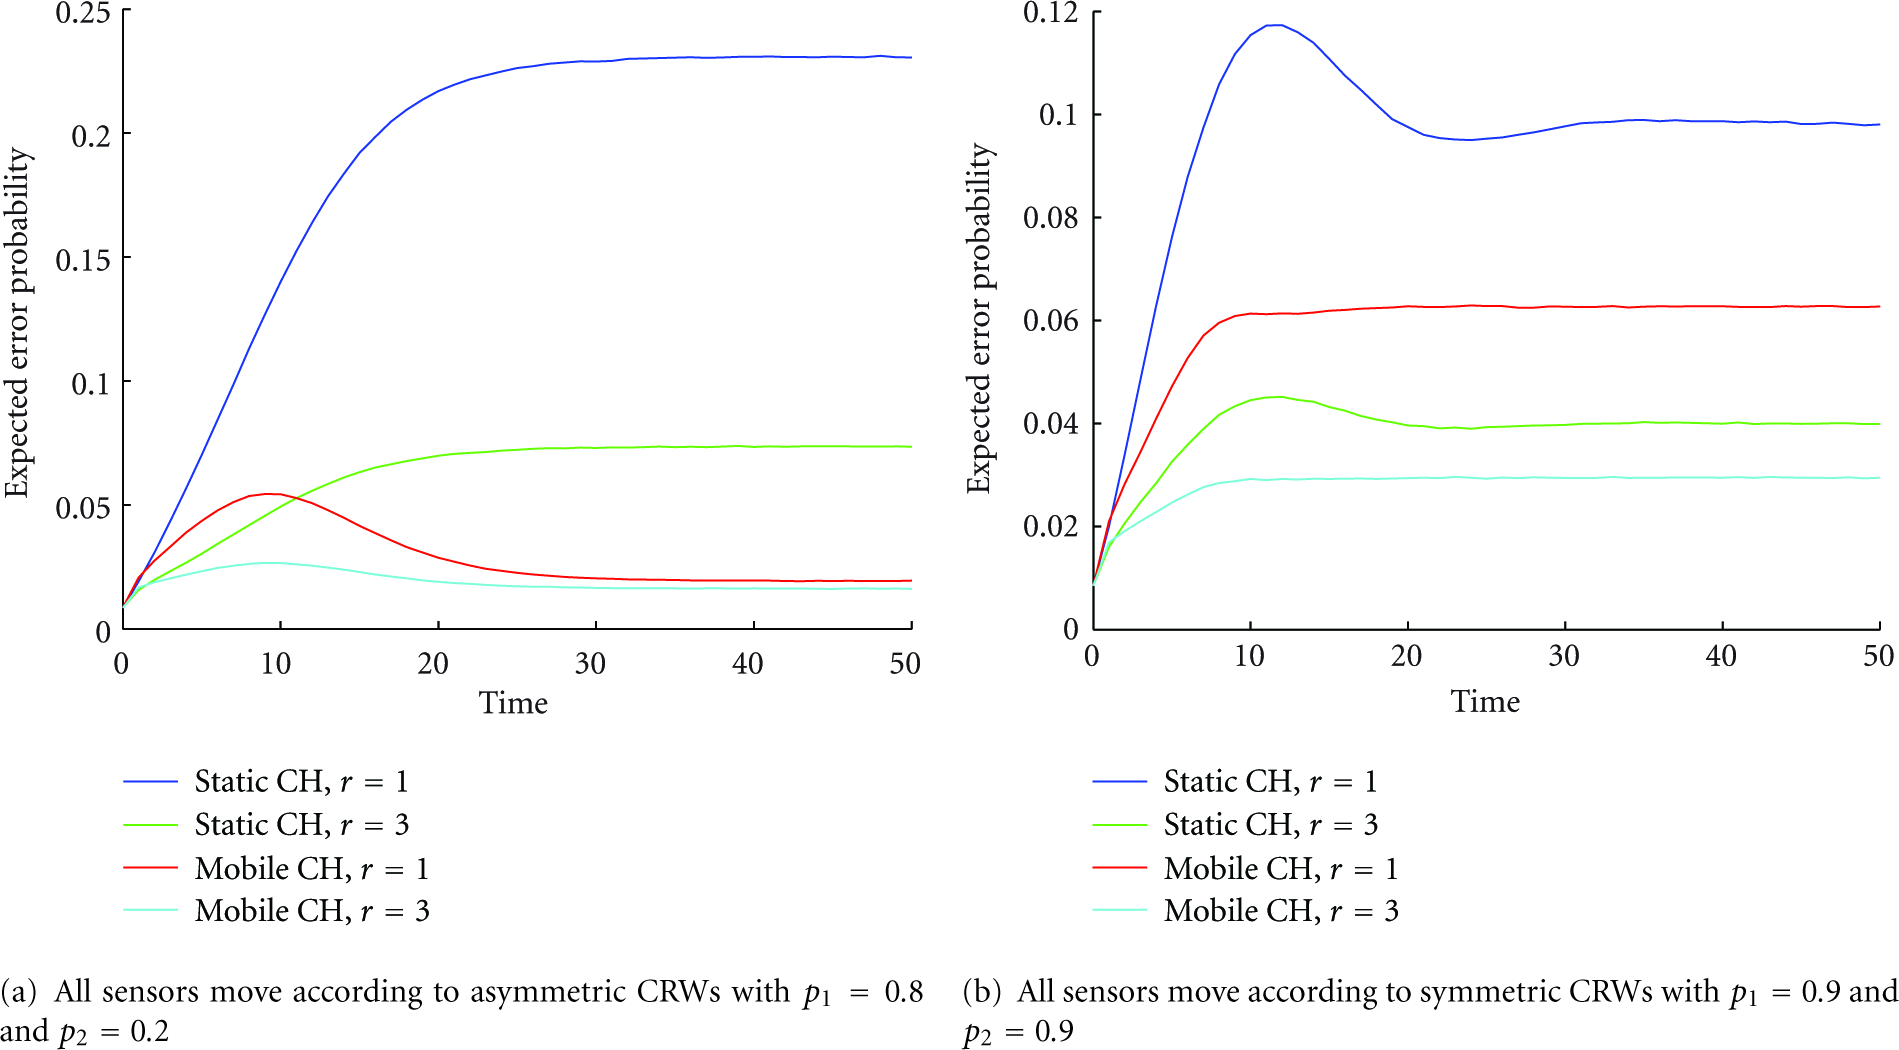
Expected error probability when the collection of data from the five mobile sensors begins at time t. The cases considered are when the transmission radius of each sensor is
9. Conclusions
In this paper, the solution to the finite state space CRW was provided and its statistical behavior was studied both analytically and numerically. As an illustration of the application-specific performance measures it can help address, we studied the impact of motion on the error probability of the final decision at the CH and the energy required to collect the decisions from all relevant sensors. Thus the temporary cluster head can decide the most appropriate time to call for data reports to help it make decisions within the allowed time frame and energy budget. In future research, we will study the impact of motion on the energy required to gather data and the error probability of the final decision in complex mobile wireless sensor networks.