
Abstract
Adequate sensor placement plays a key role in such fields as system identification, structural control, damage detection, and structural health monitoring (SHM) of large-scale civil infrastructures. Many optimal sensor placement (OSP) methods have been developed for general optimized solution searches. Due to the limitations of equipment facilities and cost, the number of sensors to be installed in a structure is relatively few. It is very important to determine the necessary number of sensors to be installed and where to deploy these sensors. Taking into account energy attenuate during the signal propagation, combined with classic reverberation matrix method, a two-step method is proposed to determine the sensors arrangement using the scattering matrix in this paper. First, calculate the utmost distance of wave propagation on a special structure by the principle of elastic wave propagation and determine the preliminary number of sensors; second, the utmost distance and number of sensors are applied to a sensor optimization algorithm named Effective Independence Driving-Point Residue method. In the bridge benchmark model case study, it shows the validity of proposed method under a special detection system.
1. Introduction
A typical SHM system includes three major components: a sensor system, a data processing system (including the data acquisition, transmission, and storage), and a health evaluation system [1–3]. The most common used methods of data acquisition and analysis are based on vibration test (active excitation or ambient excitation). The number and location of sensors directly affect the accuracy of the identified modal parameters. Thus, the sensors must be judiciously placed in order to provide adequate information for the identification of the structural behavior. On the other hand, using too many sensors as well as accessorial facilities will also cause exorbitant cost.
In the past years, many methods have been developed for general optimized solution searches such as effective independence method [4], kinetic energy method [5], and some modern-type methods [6–10]. These methods solve the sensor optimization position through, as much as possible, information getting from the data acquisition system based on the analysis of finite element model (FEM). Another approaches range from applying the constraints on the objective function (evaluation criteria) to streamline the optimization process to applying the advanced artificial analysis techniques such as the genetic algorithms and simulated annealing.
As illustrated in [11], damage detection techniques based on modal parameters represent the “traditional” approach to the problem. This approach could appear convenient when a complete characterization of the structure is strictly required, but, in general, it may present some critical issues. For example, the modal-based identification procedures are almost never completely and often not universal, but rather specifically related to the facility under examination. Moreover these techniques are not efficient in tracing the micro damages that could early occur in the process of damage, as illustrated by Peeters and Roeck [12]: modal parameters variations can be caused both by the presence of damage, whether as a result of changes in environmental conditions. Therefore making certain optimal number of sensors and placing sensors on appropriate locations are especially important.
But up to now, a few works were studied about the optimal number of needed sensors especially for data acquisition validity and micro damage detection. In fact, the effectiveness and the amount of information are equally important to the subsequent data analysis. The energy of wave (the strength of signal) will attenuate during the propagation. On the other hand, there are additional frequency component of wave at the damage position, the higher the frequency is, the rapid the wave attenuates. So even if the sensor got the signal, it cannot be judged if there is really damage when the energy of wave does not match the requirement of data acquisition system. The results of measurement are unreliable under this condition.
Reverberation matrix method is put forward in recent years. It is an effective way to analyze the transient dynamic response of structure based on wave propagation and classic Timoshenko beam theory [13, 14]. It has been proved that there is an obvious effect of inertia due to the shear deformation at high frequencies on the dynamic properties of structure [15]. Based on reverberation matrix method, a two-step method is hereby proposed in this paper to determine the sensors arrangement using the scattering matrix in this paper. First, calculate the utmost distance of wave propagation on a special structure by the principle of elastic wave propagation and determine the preliminary number of sensors; second, the utmost distance and number of sensors are applied to a sensor optimization algorithm named Effective Independence Driving-Point Residue method. In this way, the number and location of sensors can be optimized simultaneously.
2. Basic Theory
2.1. Analysis of Antinoise Capacity of Data Acquisition System
In actual engineering, different data acquisition system required different precision of the sensor based on the system's antinoise capacity. It is needed to analyze the system's antinoise capacity in order to ensure the validity and reliability of the measurement. The noise level that the system can tolerate must be estimated and peak signal to noise ratio (PSNR) must be calculated.
It is assumed that the given instrument's measurement range is δ, precision is μ, so the absolute deviation threshold is

According to (1), the needed signal minimum amplitude of acceleration

2.2. The Utmost Distance of Sensor Arrangement
The lateral motion equation of modification Timoshenko beam taking account of the shear displacement is:

where κ is section shear coefficient, A is the area of section, G is shear module, ρ is density, I is the moment of Inertia.
After Fourier transformed, the solutions of (3) are

the “
The moment and shear can be expressed as follows in the frequency domain:

So the solutions of (5) are

In reverberation matrix method, node scattering matrix is defined as
where

where
The x in (6) represents the distance of wave propagation. The data acquisition system can correctly identify the signal only if the peak value of wave signal is greater than
2.3. Effective Independence Driving-Point Residue (EFI-DPR) Method
As mentioned above, previous works addressing the issue of optimally locating a given number of sensors in a structure have been carried out by several investigators. And the comparisons of different sensor placement methods have been done [2]. Because this paper mainly discusses the number of needed sensors taking into account data acquisition validity and micro damage detection sensitivity, so we just select a common method to optimize the location of sensors. In fact, a method named Effective Independence Driving-Point Residue (EFI-DPR) method is adopted in the aspect of location optimizing process.
The effective independence method (EFI method) was proposed by Kammer at 1991 [4]. The main idea of the EFI method is to gradually eliminate the degree of freedom which contributes the smallest to linearly independent of target mode vector from all measured points and to achieve the goal of that as much as possible modal parameters information is collected with limited number of sensors. The elimination process is implemented by the computing of effective independence distribution vector

where
The other optimal sensor placement method is Kinetic energy method (KEM). The basic idea of KEM is that the node's response is relatively large with larger modal strain energy, and then the sensors are installed on these nodes according to modal strain energy distribution map of every modal shape [16].
The step to optimize sensors location of KEM is similar to effective independence method (EFI), but the KEM method is highly dependent on the mesh level of finite element model. The sensor will be distributed more far away if the mesh is divided more coarsely, vice versa.
The definition of Kinetic energy matrix

A residue coefficient

where K represents stiffness matrix of structure,
To multiply (9) by

The optimal process of EFI-DPR method is similar to the classic effective independence method. The performance of EFI-DPR becomes a little bit excellent through combining the advantages of the two traditional methods (EFI and KEM) [17]. (For more information, please see the reference [17].)
3. Process of Optimal Sensor Placement
3.1. The Optimal Minimum Number of Needed Sensors
First, utmost distance
3.2. The Optimal Position of Sensors
First, the optimal location of sensors is obtained using Effective Independence Driving-Point Residue (EFI-DPR) method according to the N. Then the distance between every two sensors will be checked after the sensors are placed by EFI-DPR. The number of sensors will be added if there is any distance longer than the ultimate distance
4. Case Study
4.1. Model Analysis and Utmost Distance Calculation
This paper considers the optimal sensor placement for a bridge benchmark model structure as shown in Figure 1. The length, width, and the height of model are 12 m, 2 m, and 1 m separately. All beams of the structure are joist steel, the elastic modulus is 2.08e11 N/m2, mass density is 7800 kg/m3, and Poisson's ratio is 0.31.The parameters are shown in Table 1. All the joints are connected by bolts. The nine columns are fixed on the ground. The data acquisition system is Intelligent Signal Acquisition Analyzer INV306U-5160 produced by Beijing Orient Institute of Noise & Vibration. Its measurement range δ is ±10 m/s2, precision μ is 0.001. According to (2), the needed minimum signal acceleration peak value is that
Material parameters of structure.


Benchmark model of bridge structure and its finite element model (FEM).
In fact, there are various frequency components of wave at the damage position due to different damage type. According to the results of simulation of the damage due to stiffness decrease, a wave with 2000 Hertz and 0.13 m/s2 acceleration was taken as an example data. The attenuation curve of wave is shown in Figure 2.
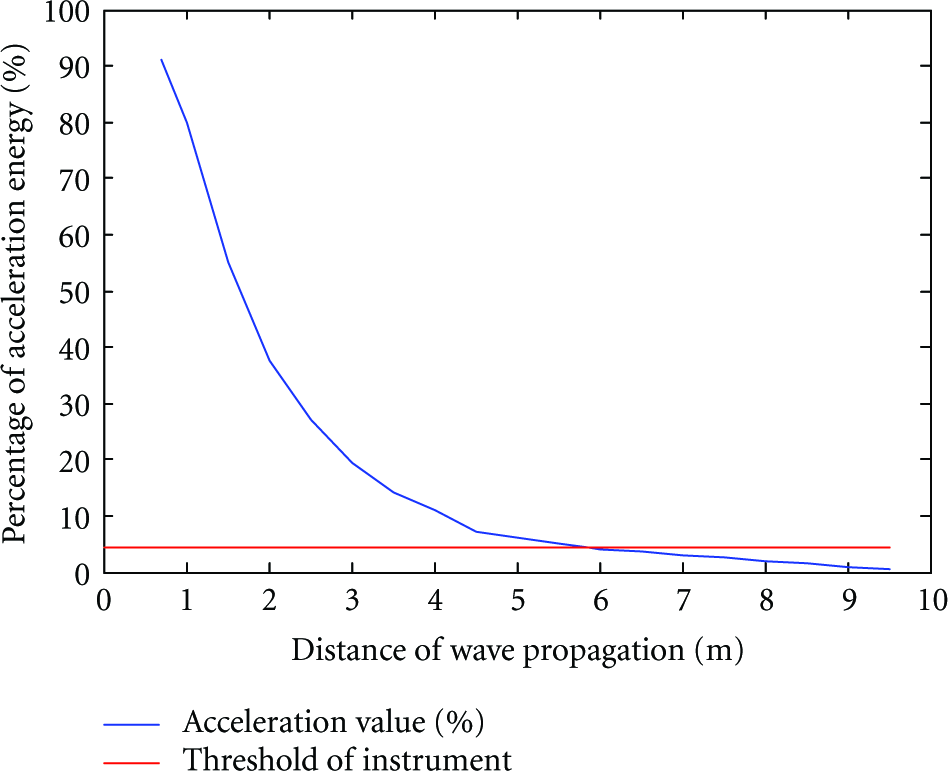
Wave acceleration peak value attenuation.
The utmost distance of sensor arrangement was calculated using the proposed method. The results indicate that the distance of wave propagation is 5.86 meters when the peak value of acceleration attenuates to 4.3% of the origin (from 0.13 m/s2 to 0.0056 m/s2). So the utmost distance of sensor arrangement is 5.86 meters.
4.2. Final Placement Plan
Based on the utmost distance
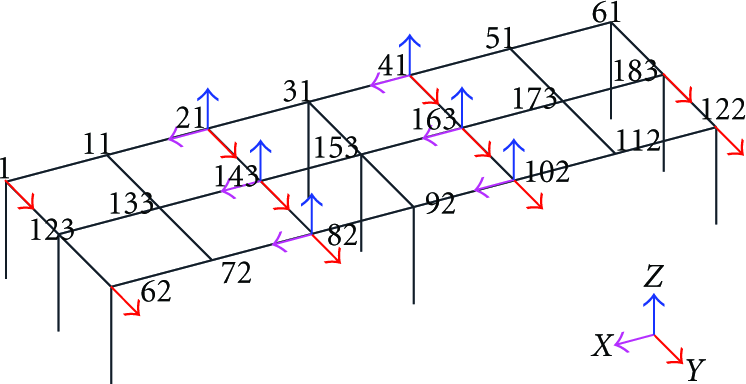
Optimal sensor placement of Benchmark model.
4.3. Results Analysis
In order to check the validity of the proposed method, the values of mean square deviation (MSD) and modal assurance criteria (MAC) between FEM and the measured data from the installed sensors are calculated. Results are shown in Tables 2 and 3 and Figures 4 and 5.
Mean square deviation (MSD) value between FEM modal shape and curve fitting of test.

Modal assurance criteria (MAC) value between FEM modal shape and curve fitting of test.

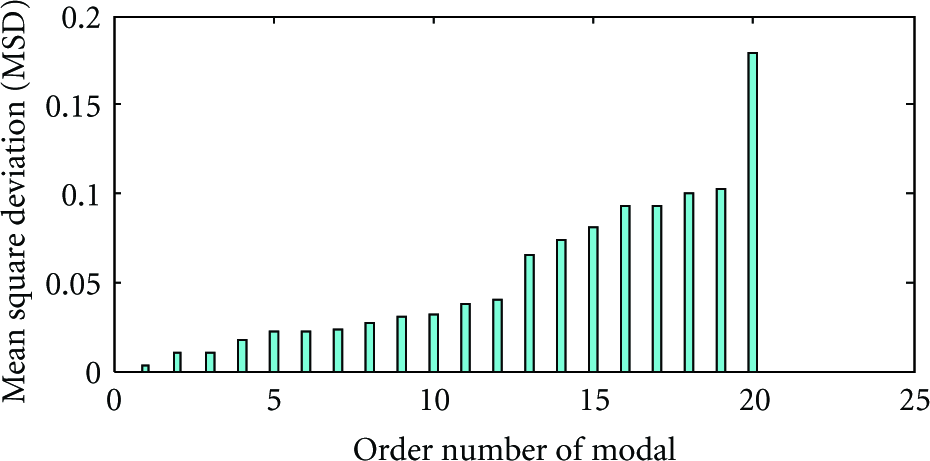
Values of mean square deviation (MSD).
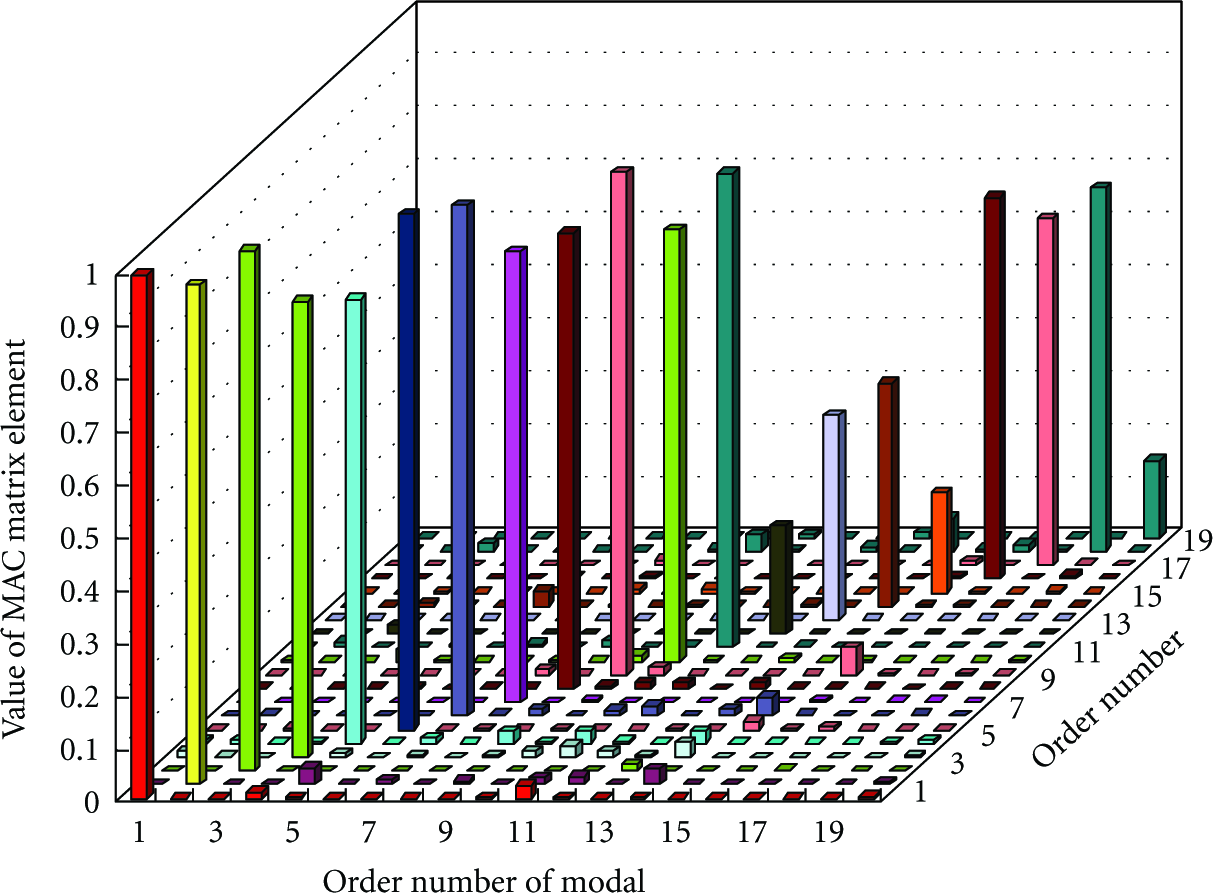
Values of modal assurance criteria (MAC).
Table 2 shows that the mean square deviation (MSD) value is very small at the first several modes. Table 3 shows the value of modal assurance criteria (MAC) is close to 1 at the first three modes, six-order mode, and seven-order mode. MAC is a very good common tool for evaluating the orthogonality of two vectors, and in general, the data of first several modes is enough for ordinary test.
At the same time, the mode shape comparison has been made between the simulation of FEM and the data of curve fitting based on the measured data from the installed sensors (the dashed line in Figure 6). Figure 6 shows that there is no significant difference between the mode shape of FEM and the one by curve fitting.

Modal shapes between finite element model (FEM) and cubic spline.
All the results show that the information measured from the installed sensors was consistent with the finite element model (FEM) at the first 1 to 6 modes, that is, the optimal sensor placement with proposed method is number enough and effective under the given data acquisition system.
5. Conclusions
This paper presents an alternative way to make effective optimal sensor placement especially for data acquisition validity and micro damage detection in structure health monitoring. Taking into account energy attenuate during the signal propagation, combined with classic reverberation matrix method, a two-step method is proposed to determine the sensors arrangement. The optimal number and location of sensors are calculated simultaneously through applying the utmost distance of sensors to a sensor optimization algorithm. The bridge benchmark model test is representative and the results show the validity of proposed method.
Although the study provides an alternative way for optimal sensor placement in structure damage detection and structure health monitoring, and this may make the system more economical and effective, there is still much more work need to do. The establishment of scattering matrix S is more cumbersome. There are different S for bar system and plate system. A little bit variation of S exists even in the similar structure. On the other hand, more damage types must be considered for the selection of excitation wave in large structures. And how to determine the order of the monitoring modes still needs further research.
Footnotes
Acknowledgments
This research work was jointly supported by the National High Technology Research and Development Program (“863” Program) of China (Grant no. 2006AA04Z437) and the National Natural Science Foundation of China (Grant nos. 51278420 and 50878184). The authors would also like to thank the anonymous reviewers for their valuable suggestions.