
Abstract
To improve the corrosion-resistant properties of carbon steel, usually cladding process is used. It is a process of depositing a thick layer of corrosion-resistant material over carbon steel plate. Most of the engineering applications require high strength and corrosion resistant materials for long-term reliability and performance. Cladding these properties can be achieved with minimum cost. The main problem faced in cladding is the selection of optimum combinations of process parameters for achieving quality clad and hence good clad bead geometry. This paper highlights an experimental study to predict various input process parameters (welding current, welding speed, gun angle, contact tip-to-work distance, andpinch) to getoptimum dilutionin stainless steel cladding of low carbon structural steel plates using Gas Metal Arc Welding (GMAW). Experiments were conducted based on central composite rotatable design with full replication technique, and mathematical models were developed using multiple regression method. The developed models have been checked for adequacy and significance. Using Artificial Neural Network (ANN) the parameters were predicted, and percentage of error was calculated between predicted and actual values. The direct and interaction effects of process parameters on clad bead geometry are presented in graphical form.
1. Introduction
Prevention of corrosion is a major problem in Industries. Even though it cannot be eliminated completely it can be reduced to some extent. A corrosion-resistant protective layer is made over the less corrosion-resistant substrate by a process called cladding. This technique is used to improve life of engineering components but also reduce their cost. This process is mainly nowadays used in industries such as chemical, textiles, nuclear steam power plants, food processing, and petrochemical industries [1].
Most accepted method employed in weld cladding is GMAW. It has got the following advantages [2]:
high reliability,
all position capability,
easy to use,
low cost,
high Productivity,
suitable for both ferrous and nonferrous metals,
high deposition rate,
absences of fluxes,
cleanliness and ease of mechanization.
The mechanical strength of clad metal is highly influenced by the composition of metal but also by clad bead shape. This is an indication of bead geometry. Figure 1 shows the clad bead geometry. It mainly depends on wire feed rate, welding speed, arc voltage, and so forth. Therefore it is necessary to study the relationship between process parameters and bead parameters to study clad bead geometry. Using mathematical models it can be achieved. This paper highlights the study carried out to develop mathematical and ANN models to predict clad bead geometry, in stainless steel cladding deposited by GMAW. The experiments were conducted based on four-factor five-level central composite rotatable designs with full replication technique [3]. The developed models have been checked for their adequacy and significance. Again using ANN, the bead parameters were predicted. These predicted and actual parameters were compared. The parameters were presented in graphical form.

Clad bead geometry.
2. Experimental Procedure
The following machines and consumables were used for the purpose of conducting experiment:
a constant current gas metal arc welding machine (Invrtee V 350-PRO advanced process with 5–425 amps output range),
welding manipulator,
wire feeder (LF-74 Model),
filler material stainless steel wire of 1.2 mm diameter (ER-308 L),
gas cylinder containing a mixture of 98% argon and 2% of oxygen,
mild steel plate (grade IS–2062).
Test plates of size 300 × 200 × 20 mm were cut from mild steel plate of grade IS-2062, and one of the surfaces is cleaned to remove oxide and dirt before cladding. ER-308 L stainless steel wire of 1.2 mm diameter was used for depositing the clad beads through the feeder. Argon gas at a constant flow rate of 16 litres per minute was used for shielding. The properties of base metal and filler wire are shown in Table 1. The important and most difficult parameter found from trial run is wire feed rate. The wire feed rate is proportional to current. Wire feed rate must be greater than critical wire feed rate to achieve pulsed metal transfer. The relationship found from trial run is shown in (1). The formula derived is shown in Figure 2:

Chemical composition of base metal and filler wire.


Relationship between current and wire feed rate.
The selection of the welding electrode wire is based on the matching of the mechanical properties and physical characteristics of the base metal, weld size, and existing electrode inventory [4]. A candidate material for cladding which has excellent corrosion resistance and weld ability is stainless steel. These have chloride stress corrosion cracking resistance and strength significantly greater than other materials. These have good surface appearance, good radiographic standard quality, and minimum electrode wastage. Experimental design procedure used for this study is shown in Figure 3, and important steps are briefly explained.

Experimental design procedure.
3. Plan of Investigation
The research work was planned to be carried out in the following steps [5]:
identification of factors and responses,
finding limits of process variables,
development of design matrix,
conducting experiments as per design matrix,
recording the responses,
development of mathematical models,
checking the adequacy of developed models,
conducting conformity tests.
3.1. Identification of Factors and Responses
The following independently controllable process parameters were found to be affecting output parameters. These are wire feed rate (W), welding speed (S), welding gun angle (T), contact tip-to-work to distance (N), and pinch (Ac). The responses chosen were clad bead width (W), height of reinforcement (R), depth of penetration (P), and percentage of dilution (D). The responses were chosen based on the impact of parameters on final composite model.
The basic difference between welding and cladding are the percentage of dilution. The properties of the cladding is the significantly influenced by dilution obtained. Hence control of dilution is important in cladding where a low dilution is highly desirable. When dilution is quite low, the final deposit composition will be closer to that of filler material and hence corrosion-resistant properties of cladding will be greatly improved. The chosen factors have been selected on the basis to get minimal dilution and optimal clad bead geometry.
No significant research work has been conducted in these areas using these process parameters, and so these parameters were used for experimental study.
3.2. Finding the Limits of Process Variables
Working ranges of all selected factors are fixed by conducting trial run. This was carried out by varying one of factors while keeping the rest of them as constant values. Working range of each process parameter was decided by inspecting the bead for smooth appearance without any visible defects. The upper limit of given factor was coded as −2. The coded value of intermediate values was calculated using (2)

where X
i
is the required coded value of parameter, X is any value of parameter from
The chosen level of the parameters with their units and notation is given in Table 2.
Welding parameters and their levels.

3.3. Development of Design Matrix
Design matrix chosen to conduct the experiments was central composite rotatable design. The design matrix comprises of full replication of
3.4. Conducting Experiments as per Design Matrix
The experiments were conducted at SVS College of Engineering, Coimbatore, India. In this work thirty-two experimental runs were allowed for the estimation of linear quadratic and two-way interactive effects of each corresponding treatment combination of parameters on bead geometry as shown in Table 3 at random. At each run settings for all parameters were disturbed and reset for next deposit. This is very essential to introduce variability caused by errors in experimental setup.
Design matrix.

I: welding current; S: welding speed; N: contact tip-to-work distance; T: welding gun angle; Ac: pinch.
3.5. Recording of Responses
In order to measure clad bead geometry of transverse section of each weld overlays were cut using band saw from midlength. Position of the weld and end faces were machined and grinded. The specimen and faces were polished and etched using a 5% nital solution to display bead dimensions. The clad bead profiles were traced using a reflective type optical profile projector at a magnification of X10, in M/s Roots Industries Ltd., Coimbatore. Then the bead dimensions such as depth of penetration height of reinforcement and clad bead width were measured [6]. The traced bead profiles were scanned in order to find various clad parameters and the percentage of dilution with help of AUTO CAD software. This is shown in Figure 4.

Traced Profiles (Specimen No. 2).
02A represents profile of the specimen (front side) and 02B profile of the specimen (rear side).
The measured clad bead dimension and percentage of dilution are shown in Table 4.
Design matrix and observed values of clad bead geometry.
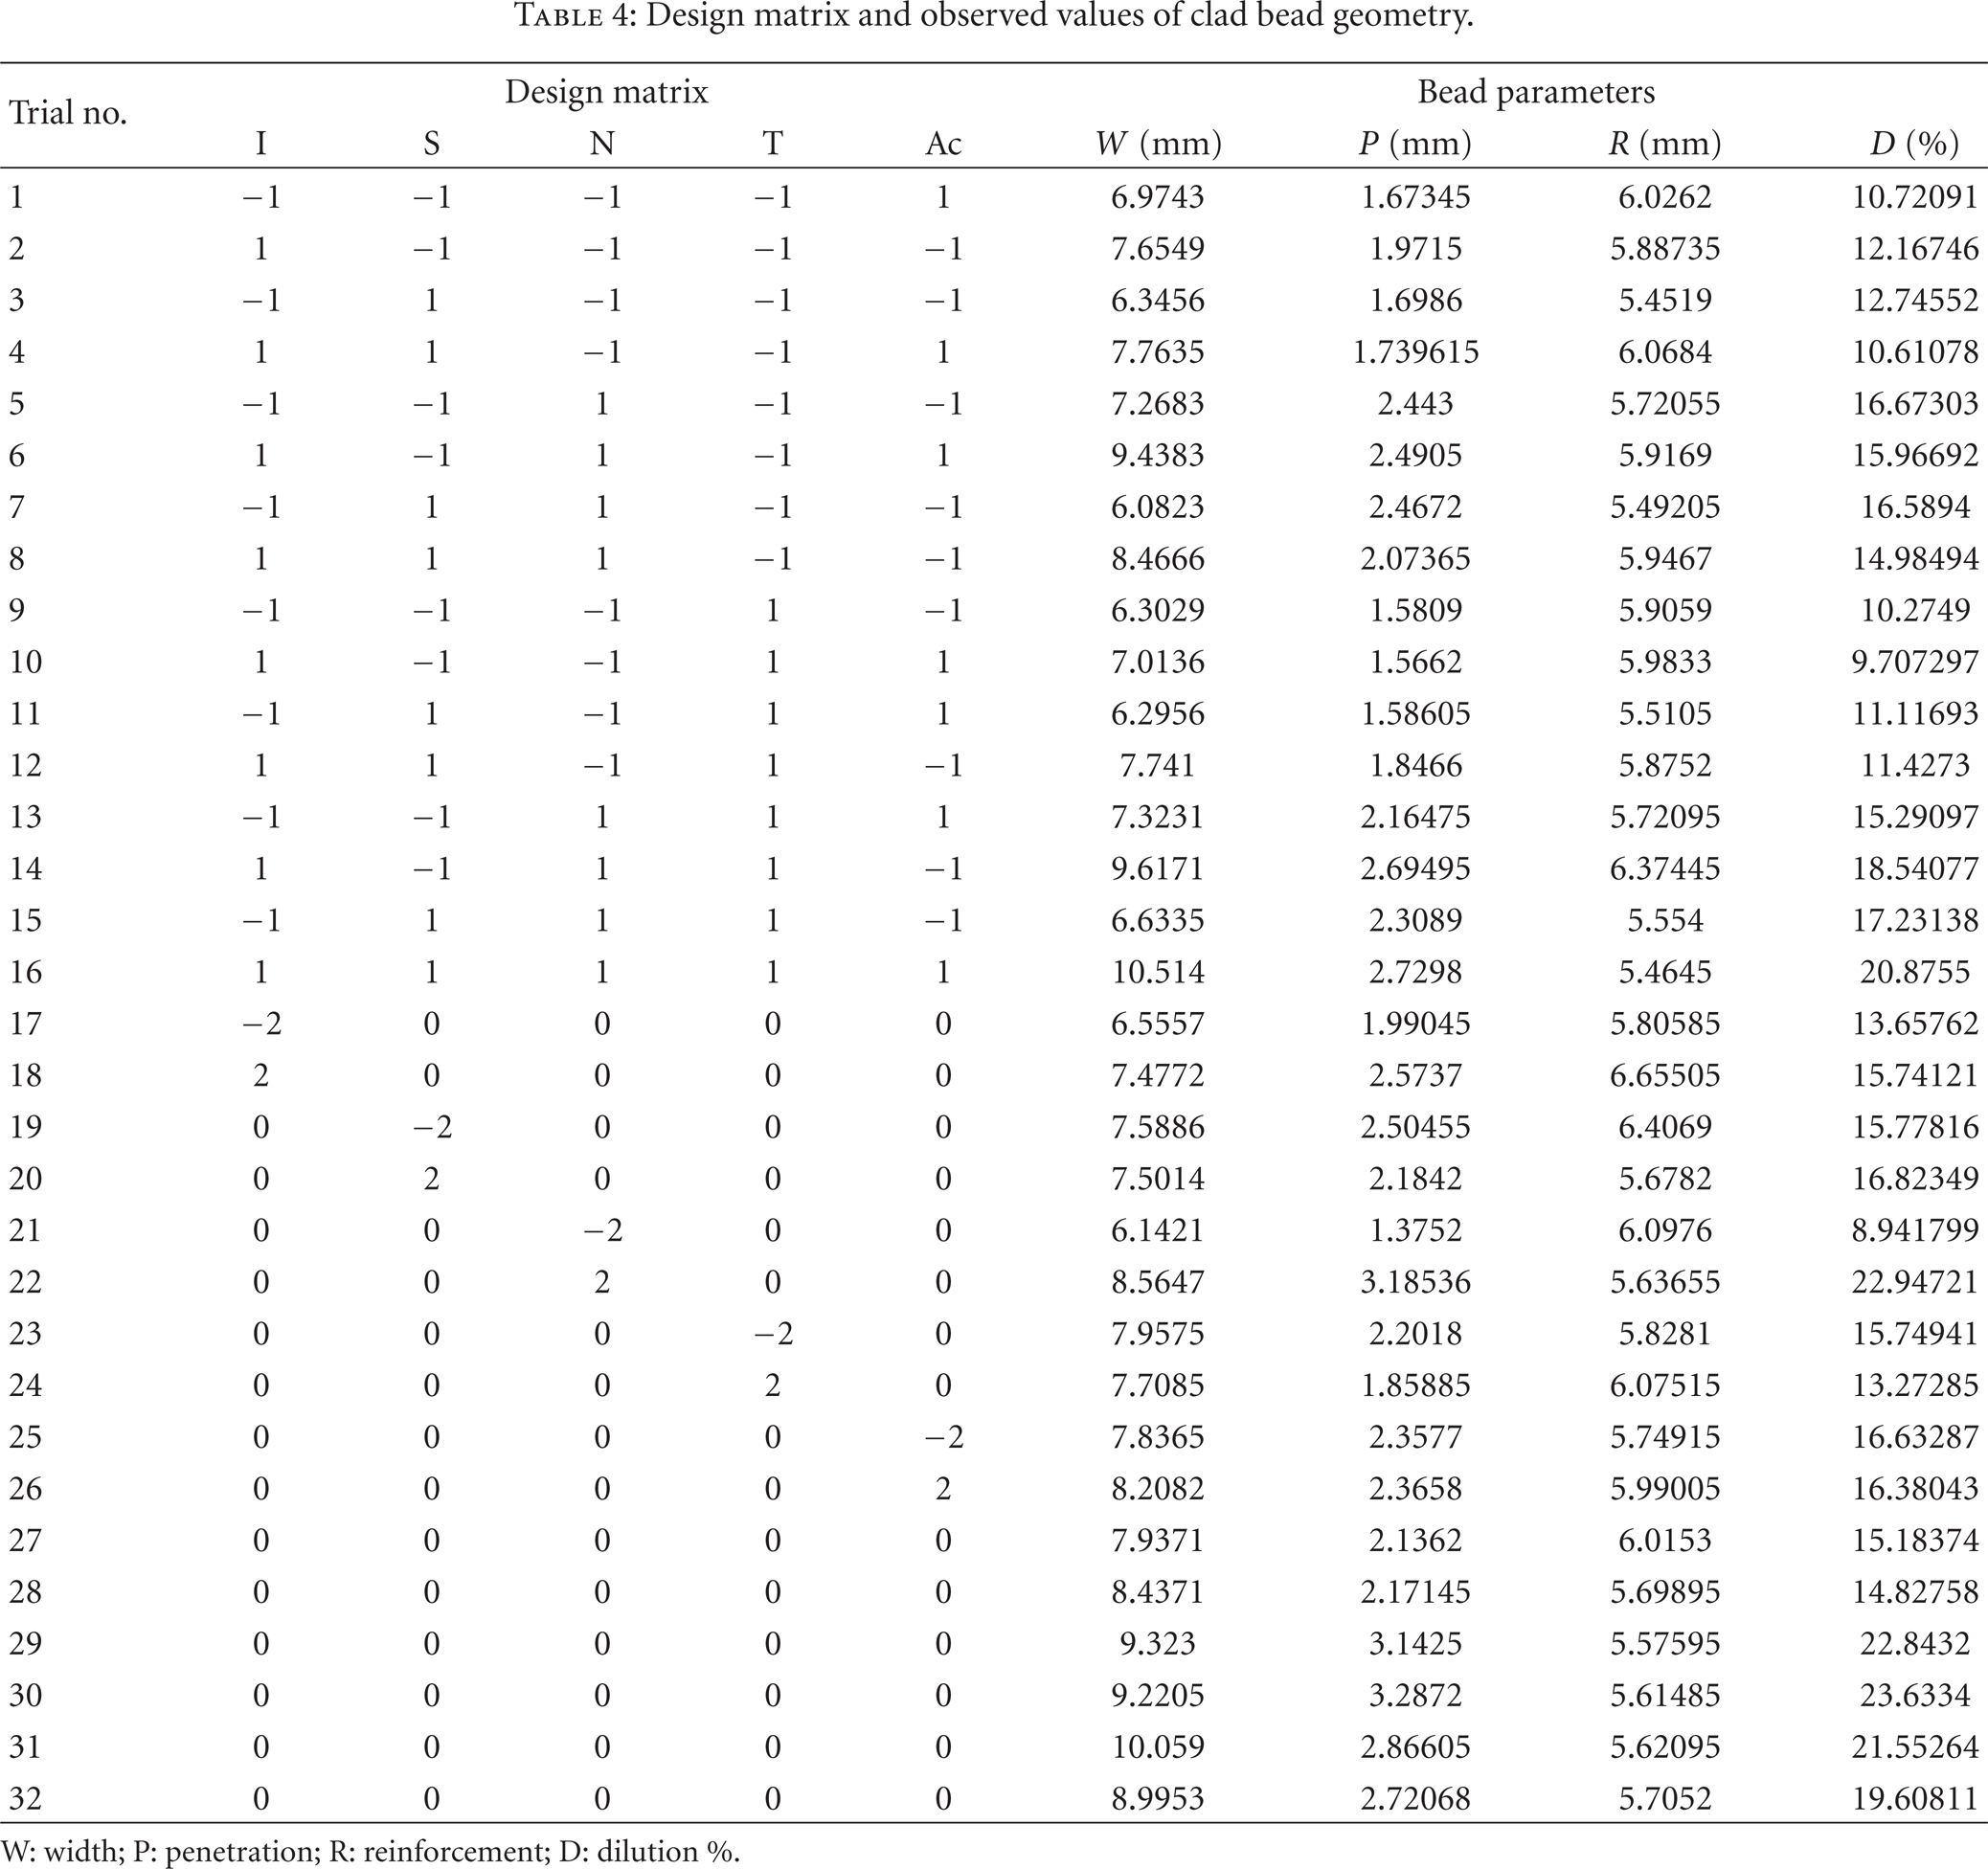
W: width; P: penetration; R: reinforcement; D: dilution %.
3.6. Development of Mathematical Models
The response function representing any of the clad bead geometry can be expressed as [7–9]

where, Y= response variable, A = welding current (I) in amps, B = welding speed (S) in mm/min, C = contact tip to work distance (N) in mm, D = welding gun angle (T) in degrees, and E = pinch (Ac).
The second order surface response model equation can be expressed as below:
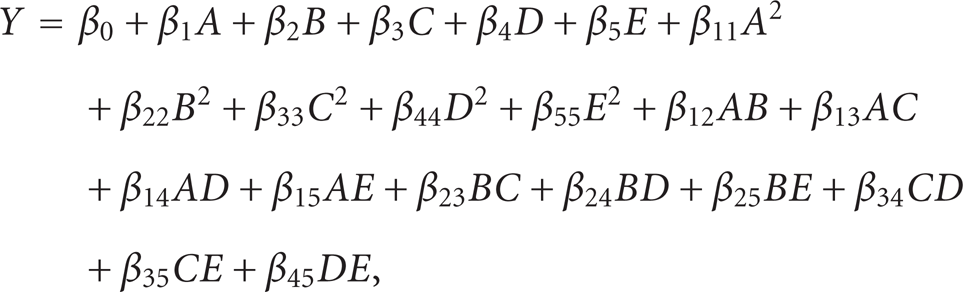
where β0 is the free term of the regression equation, the coefficient
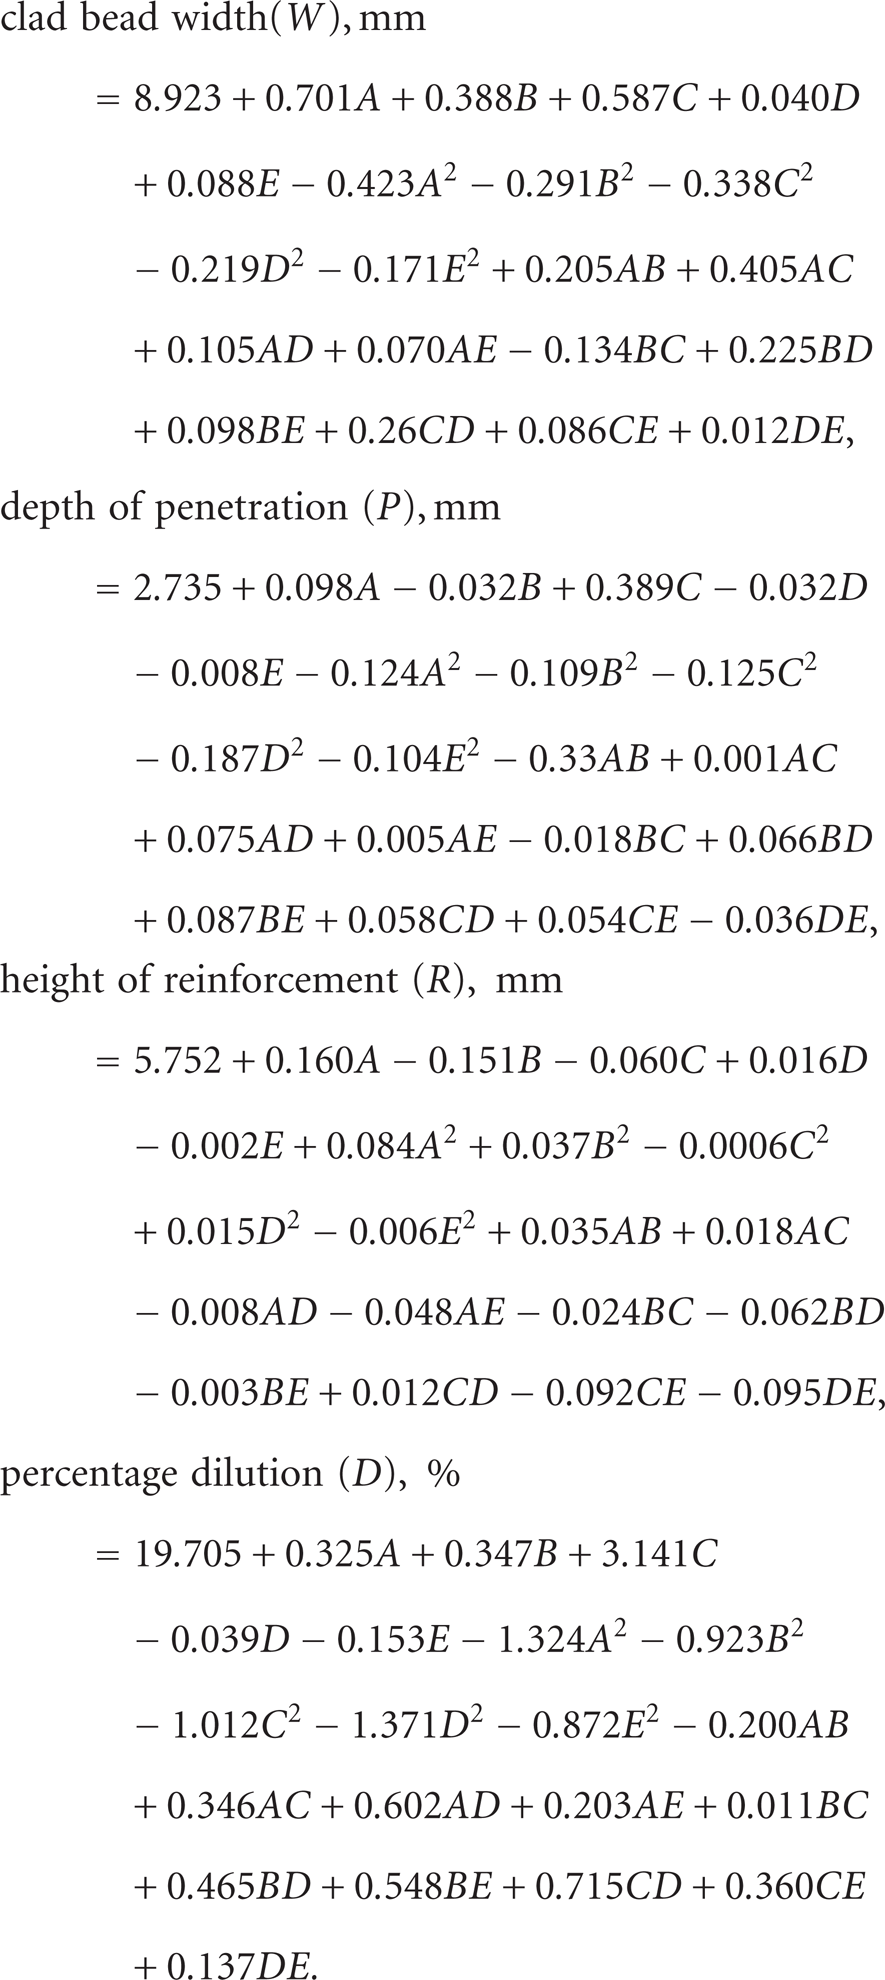
3.7. Checking the Adequacy of the Developed Models
The adequacy of the developed model was tested using the analysis of variance (ANOVA) technique. As per this technique, if the F-ratio values of the developed models do not exceed the standard tabulated values for a desired level of confidence (95%) and the calculated R-ratio values of the developed model exceed the standard values for a desired level of confidence (95%), then the models are said to be adequate within the confidence limit [10]. These conditions were satisfied for the developed models. The values are shown in Table 5.
Analysis of variance for testing adequacy of the model.

SS: sum of squares; DF: degree of freedom; F ratio (6, 5, 0.5) = 3.40451; R ratio (20, 5, 0.05) = 3.20665.
4. Artificial Neural Networks
Artificial neural network (ANN) is biologically inspired by intelligent techniques [11]. Neural network consists of many nonlinear computational elements operating in parallel. Basically it consists of neurons; it represents our biological nervous system. The basic unit of ANN is the neuron. The neurons are connected to each other by link and are known as synapses which are associated to a weight factor. An artificial neuron receives signals from other neurons through the connection between them. Each connection has a synaptic connection strength which is represented by a weight of that connection strength. This artificial neuron receives a weighted sum of outputs of all neurons to which it is connected. The weighted sum is then compared with the threshold for an ANN, and if it exceeds this threshold, ANN fires. When it fires, it goes to higher excitation state, and a signal is send down to other connected neurons. The output of a typical neuron is obtained as a result of nonlinear function of weighted sum. This process is clearly shown in Figure 5.

Output of a typical neuron.
Neural networks have many usages in the present decade. It has been successfully applied across an entire ordinary range of problems domains, in the areas such as finance, medicine, energy, geology, and physics where there is a problem of prediction neural network whichcan be used successfully [12]. It is an adaptable system that can learn relationship through repeated presentation of data and is capable of generalizing a new previously unseen data. One of the most popular learning algorithms is the back propagation algorithm [13, 14]. In this study feedback propagation algorithm was used with a single hidden layer improved with numerical optimization technique called Levenbery-Marguent approximation algorithm (LM) [15]. The topology of architecture of feed forward three-layers back propagations network is illustrated in Figure 6.

Neural network architecture.
MATLAB 7 was used for training the network for the prediction of clad bead geometry. Statistical mathematical model was used to compare results produced by the work. For normalizing the data the goal is to examine the statistical distribution of values of each net input, and outputs are roughly uniform; in addition the value should be scaled to match range of input neurons [16]. This basically ranges from 0 to 1; in practice it is found to be between 01 and 9 [17]. In this paper data base is normalized using (6)
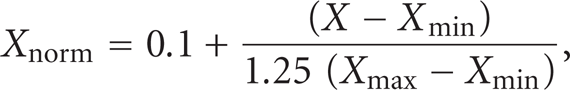
where X
norm
= normalized value between 0 and 1, X = value to be normalized, X
min
= minimum value in the data set range of the particular data set which is to be normalized,
The accuracy of prediction may be decreased with the increase in the number of neurons in the hidden layer. In other words increase in number of neurons could not directly improve the capability of function approximation of network. In this study five welding process parameters were employed as input to the network. The Levenberg-Marquardt approximation algorithm was found to be the best fit for application because it can reduce the MSE to a significantly small value and can provide better accuracy of prediction. So neural network model with feed forward back propagation algorithm and Levenberg-Marquardt approximation algorithm was trained with data collected for the experiment. Error was calculated using (7)

The difficulty using the regression equation is the possibility of overfitting the data. To avoid this, the experimental data is divided into two sets, one training set and other test data sets [18]. The ANN model is created using only training data; the other test data is used to check the behaviour of the ANN model created. All variables are normalized using (6). The data was randomized and portioned into two, one training and other test data:

Neural network general form can be defined as a model shown above y representing the output variables and x j the set of inputs, shown in the previous equation [11, 12]. The subscript i represents the hidden units shown in Figure 6, θ represents bias, and w j represents the weights. The above equation defines the function giving output as a function of input.
The training process involves the derivation of weights by minimization of the regularized sum of squared error. The complexity of model is controlled by the number of hidden level values of regularization constants and is associated with each input, one for biases and one for all weights connected to output.
4.1. Procedure for Prediction
The effectiveness of ANN model fully depends on the trial and error process. This study considers the factors that could be influencing the effectiveness of the model developed. For the MATLAB 7 tools there are five influencing factors which are listed below:
network algorithm,
transfer function,
training function,
learning function,
performance function.
The ANN structure consists of three layers which are input, hidden, output layer. It is known that ANN model is designed on trial and error basis. The trial and error are carried out by adjusting the number of layers and the number of neurons in the hidden structure. Too many neurons in hidden layer result in a waste of computer memory and computation time, while too few neurons may not provide desired data control effect [19].
Training is conducted using 28 randomly selected samples. Seventeen data sets are used for training and eleven used for test data. Table 4 shows randomized data with 1–11 for test data and 12–28 for training data. It is suggested that following guidelines should be followed by selecting training and testing of data such as 90% : 10%, 85% : 15%, and 80% : 20% with a total of the 100% combined ratio. To fit the randomized sample of 28, preferred ratio selected is 70% : 30% [20]:
(70/100) × 28 = 19–20 training samples.
(30/100) × 28 = 8–9 data testing samples.
It is necessary to normalize the quantitative variable to some standard range from 0 to 1 [21]. The number of neurons hidden layers should be approximately equal to
Many different ANN network algorithms have been proposed by researchers but back propagation (BP) algorithm has been found to be the best for prediction [22]. Researchers developed the model by using feed forward BP and radial basis network algorithm, and it was found that feed forward BP gives more accurate results.
Basically a feed forward network based on BP is a multilayered architecture made up of one or more hidden layers placed between input and output layers, shown in Figure 6. Transfer function, training function, learning function, and performance function used in this study are logsig, traingdm, traingdx, and MSE.
4.2. Determination of the Best ANN Model
In order to determine the best network structure of ANN prediction model the randomized data set is divided into two sets, one training data set which is used for the prediction of the model and the other test data which is used to validate the model. Seventeen data sets were used for training set and eleven data sets for test set. This is to avoid the overfitting of the data. An ANN model is created and trained using MATLAB 7 ANN tool box. The lowest MSE obtained is for twelve hidden neurons. Training the network is done, and this is shown in Figure 7. So a network structure 5-12-4, five input neurons, twelve hidden neurons and four output neurons. Then the test data is validated against the ANN model created; the results are shown in Table 6. Training data is shown in Table 7.
Comparison of actual and predicted values of the clad bead parameters using neural network data (test).
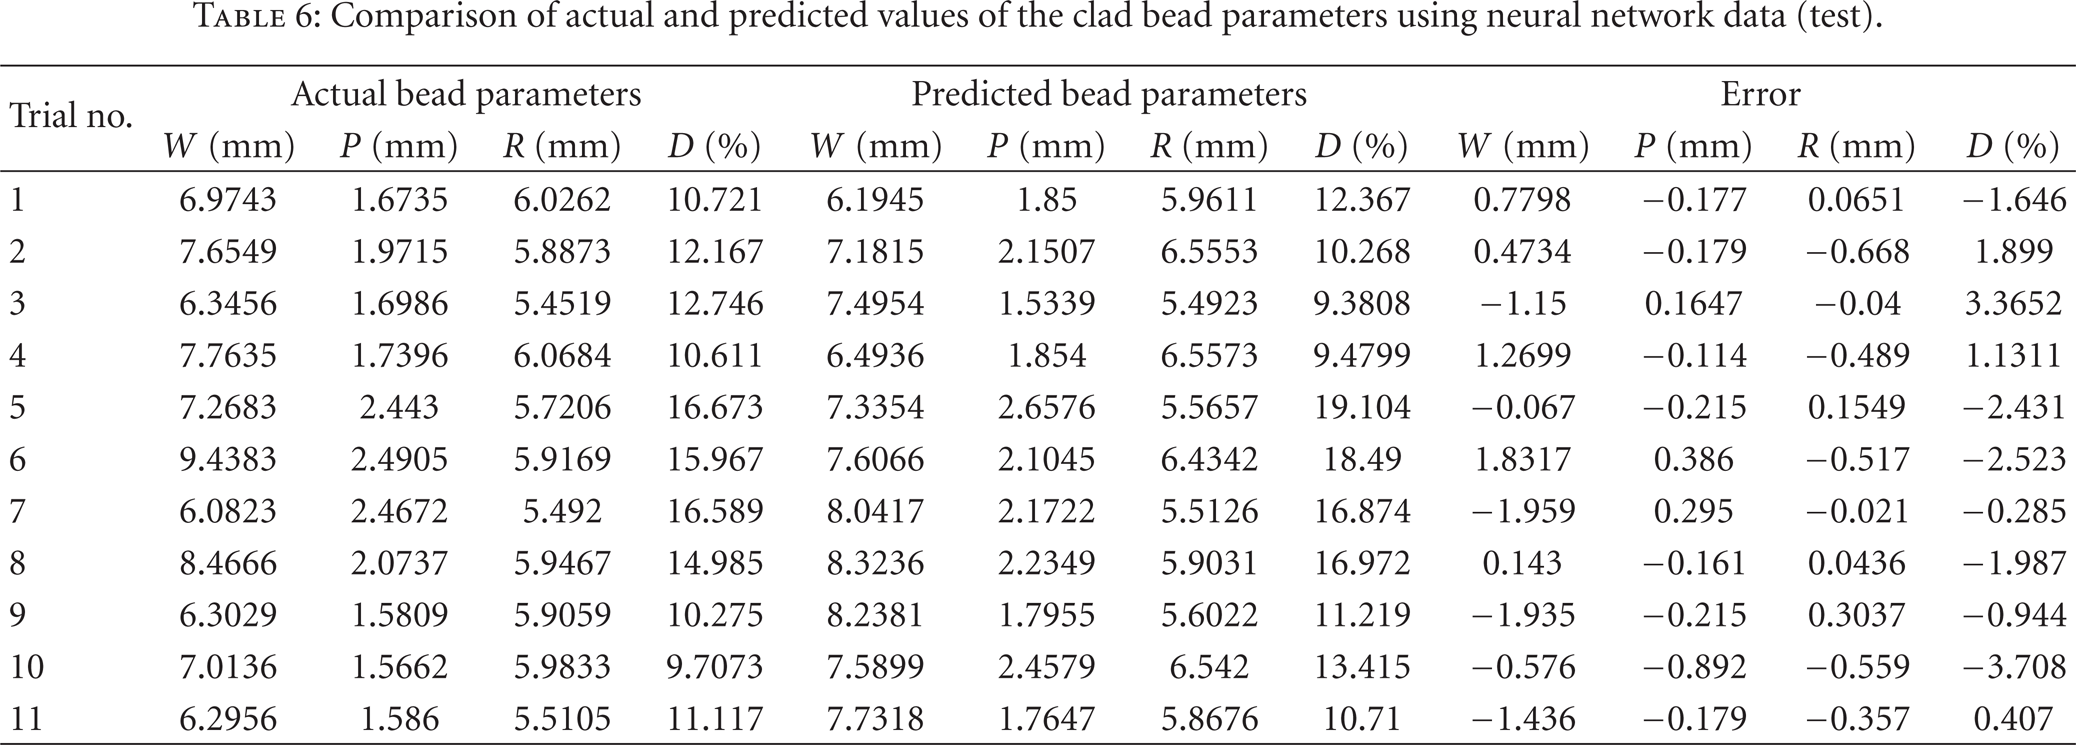
Comparison of actual and predicted values of the clad bead parameters using neural network data (training).


Observed hidden units versus RMS error.
5. Results and Discussions
Experiments were conducted using GMAW to produce cladding on austenitic stainless steel material. From the experimental results a mathematical model was developed using regression model. Further to enhance scope of work ANN model was developed by using feed forward back propagation algorithm.
In this study a feedback propagation neural network model to predict clad bead geometry was developed. To ensure accuracy of model developed to predict width, depth of penetration, reinforcement, and dilution the experimental and predicted results using the developed model are compared. The error which gives the deviation of the predicted model and actual model was calculated and presented in Table 6. Figures 8, 9, 10, 11, and 12 performance curve, regression model and graphs for training and test data are shown in detail.

Performance curve.

Scatter diagram for bead width, penetration, reinforcement, and dilution.

Test data set.
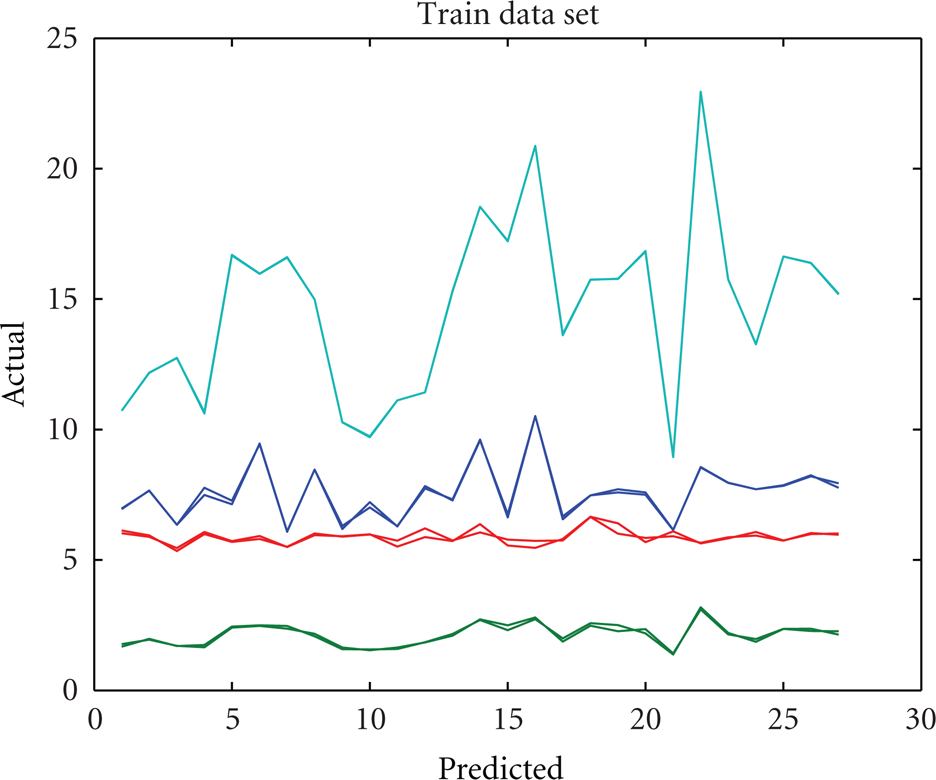
Training data set.

Observed and predicted bead width using ANN model.
The comparison of actual data and predicated data of clad bead width, depth of penetration height of reinforcement, and percentage of dilution shown from Figures 12, 13, 14, and 15. It can be seen that final results obtained by experimental method and predicted model are very close.

Observed and predicted dilution using ANN model.

Observed and predicted reinforcement using ANN model.

Observed and predicted penetration using ANN model.
In this study, a review of the ANN technique to develop the prediction model of clad bead geometry of stainless steel cladding deposited by GMAW has been discussed. In this study basic idea of ANN is being applied for modelling purposes particularly for prediction of clad bead geometry. The determination of the number of neurons in the hidden layers by trial and error method is very important for giving accurate and good prediction. In this study it is observed that by modifying the number of hidden layers and number of neurons in the hidden layer the same ANN training algorithm could give different results. In this study twelve hidden neurons with single layer were trained using MATLAB 7, and the lowest MSE was observed in the single layer with twelve neurons. This study also proved that accurate value of prediction of the clad bead geometry could be obtained using small training and testing samples by using the available experimental data. By dividing the total sample size of 28 into 17 training data and 11 for testing data it was found that applying ANN technique to a good prediction model can be created with the real cladding result. In other words, ANN is still capable of generating accurate prediction values of clad bead geometry with small number of samples. However the result of prediction depends on the number of layers modified in the hidden layer of the ANN structure. However researchers can create different models by modifying the number of neuron and layers in the hidden layer; the best results could be obtained, but in this case researcher has to sacrifice time and cost.
6. Conclusions
A neural network model has been developed from the experimental data to achieve desired clad bead geometry. Neural network models are capable of making prediction of clad bead geometry with reasonable accuracy.
The developed models are able to predict process parameters required to achieve the desired clad bead geometry of stainless steel cladding deposited by GMAW, and prediction of ANN models is within the limits of reasonable accuracy.
In this study the following steps were applied for prediction of stainless steel clad bead geometry using GMAW: (a) data collection using experimental studies, (b) analysing and processing of data, (c) training the neural network, (d) test of trained neural network, and (e) use of trained neural network for prediction of data.
The average error for bead width, penetration, reinforcement and dilution is found to be very negligible. To conclude the main quality indicator of neural network is its generalised ability to predict accurately the output of unseen verification of data.
The aim of the study was to show the possibility of the use of neural networks for calculation of clad bead geometry of stainless steel cladding deposited by GMAW method. The results showed that neural network models can be used as an alternative tool according to the present conventional calculation methods.
Footnotes
Acknowledgment
The authors sincerely acknowledge the help and facilities extended to them by the Department of mechanical engineering, SVS College of Engineering, Coimbatore, India.