
Abstract
The wireless sensor networks and opportunistic networks have nowadays presented a trend of technology convergence. On one hand, the nodes periodically sense the environment and continuously generate sensing data; on the other hand, the movements and sparse deployment of nodes usually lead to intermitted connected links and create some form of opportunistic communications. So it is a challenging problem to effectively collect the sensing data in opportunistic wireless sensor networks. In this paper, we propose an efficient data gathering algorithm based on location prediction in opportunistic wireless sensor networks. The algorithm first collects the network metadata such as history of node encounters and contact durations; then it creates a node contact graph, based on which predictive optimal data gathering locations are dynamically calculated and updated. Finally, the sink is controlled to move to these locations to collect sensing data, avoiding lots of unnecessary data exchanges and message transmissions. Extensive experimental results show that the proposed algorithm is effective to reduce the message transmissions and improve the data collection coverage rate.
1. Introduction
The wireless sensor networks (WSNs) and the opportunistic networks (or mobile delay tolerant networks) have nowadays presented a trend of convergence [1, 2]. On one hand, the sensor network has emerged some “opportunistic” characteristics in its nature: (1) often deployed in harsh environments, the signal is susceptible to external interference and leads to loss of messages; (2) the node is resource-constrained; many applications would take initiative to turn off the wireless radio devices based on energy considerations, resulting a disconnected network; (3) in mobile sensor networks, the movement of nodes also leads to opportunistic communications; (4) in sparse sensor networks, a mobile sink node is used for message and data collection; the communication is also opportunistic [3, 4]. On the other hand, similar to the “data-centric” sensor network, the opportunistic network is also a “data-related” network. End-to-end paths are not available in the opportunistic network, and it usually adopts a “store-carry-forward” mechanism to forward messages [1, 5]. The content of packets being forwarded plays an important role in the routing scheme. So the opportunistic wireless sensor network (OWSN) is a kind of opportunistic network that consists of nodes with sensing capabilities and actively or passively adopts the form of opportunistic transmissions. Research on OWSNs is a result of technology integration between wireless sensor networks and opportunistic networks.
Data gathering is a key application in the “data-centric” sensor networks. For example, in agricultural applications the deployed sensor network would collect the sensed data such as temperature and humidity for analysis [6]; in habit monitoring applications, data such as occurrence, skin color, and locations of the animals are to be collected [7]; recently Ayaki et al. [8] proposed a data gathering scheme in urban streets using mobile phones as the relayed nodes. However, the “opportunistic” characteristic makes the data gathering a challenging problem in OWSNs. Firstly, static communication links (or paths) between the source node and the sink are not available in the opportunistic network. Nodes adopt a “store-carry-forward” mechanism for message transmissions, and most of the existing data gathering algorithms based on a stable link assumption in WSNs cannot work properly. Secondly, most of the research in opportunistic network focuses on the message diffusion rather than particularly on the issue of data gathering. The goal of message diffusion algorithm is populating the messages to their varied destinations efficiently; yet for the data gathering algorithm, there is usually only one target (the sink node) for the large amount of sensed data that are injected into the network from different sources. So existing routing schemes cannot work properly for the data gathering applications in OWSNs.
In this paper we study the problem of data gathering in the OWSNs and propose an efficient data gathering algorithm called PDA (predictive dynamic data-gathering algorithm). The idea behind PDA is that nodes in OWSNs, for example, mobile phones, do not usually move randomly, but would roughly move according to some relatively stable patterns. If the moving pattern is known to the sink, the sink would then be programmed to move to the optimized locations to collect the sensing data, and lots of message exchanges and transmissions would be avoided to enhance the performance. More concretely, our algorithm firstly collects the network metadata such as the history of node encounters, contact durations, and so forth for modeling. Then it generates a node contact graph, based on which the predictive optimal locations are calculated. Finally, the sink is controlled to move to these locations to collect the sensing data and avoid lots of transmissions. Compared with other data gathering algorithms, PDA has the following features and advantages.
Data transmissions are based on the pattern of node movements. The algorithm collects the metadata for modeling to predict the optimized data gathering points, and it selectively exchanges data among the nodes, which cuts down the transmissions of data gathering.
The algorithm utilizes abundant resources of the sink node. The sink is programmed to travel among several optimized data gathering points to collect the sensing data, which avoids unnecessary data transmissions among ordinary nodes.
The algorithm attaches great importance on the success of “last hop” transmissions to the sink. Nodes with large volume of sensing data from other nodes stored on their storage would have larger probability to encounter with the sink and have enough connection length to route their data to the sink.
Extensive experimental results show that the proposed algorithm can reduce about 40~60 percent of message transmissions and improve data collection coverage rate about 8~12 percent compared with other epidemic and probabilistic data gathering algorithms.
The rest of the paper is structured as follows. Section 2 surveys some existing research related to this paper. Section 3 gives some assumptions about the network model and defines the cost model of data gathering. Section 4 describes the detailed mechanism of the proposed scheme PDA, including the initial run, calculation of data gathering points, data collection, and update of data gathering points. Finally, Section 5 describes the experimental setup and performance evaluation, and Section 6 concludes the paper.
2. Related Work
There exists some research on the data gathering applications in traditional MANET (mobile ad hoc network) and sensor networks, yet they assume the nodes are fixed and have stable links for communication [9, 10]. For the opportunistic network, most of the existing research focuses on the forwarding and routing of messages; there is no much work on the research of data gathering [5, 6, 11]. So in this section we survey some related work from areas of data forwarding and data gathering in the opportunistic networks and sensor networks.
2.1. Data Forwarding
Opportunistic networks adopt a “Store-Carry-Forwarding” strategy for message transmission [5, 11]. Messages are temporally stored on the nodes, and if there exists chance of communication at some proper time, the messages are forwarded to other nodes and finally routed to their target nodes. So utilization of the chance of opportunistic channel, constraint of energy and storage space, and the rate of successful message transmissions are all key factors for the message routing and forwarding algorithms [12].
Epidemic routing [13] uses a flooding-like mechanism for message routing. Encountered nodes would fully take advantage of the communication chance for message exchange to increase the rate of successful message transmission and decrease the message delay. To cut down message transmissions and handle the network congestion, controlled-flooding algorithm [14] is proposed, which selectively forwards the message based on the forwarding probability, as well as time-to-live (TTL) or kill time. In the prioritized epidemic routing PREP [15], messages are forwarded or deleted based on the current cost to destination, current cost from source, expiry time, and generation time, and messages closer to the destinations would have more copies to improve the rate of successful transmission.
Besides the flooding-like scheme, another type of message forwarding scheme is to utilize context information and knowledge of the network to optimize the message transmissions. ZebraNet project [7] uses a mechanism based on the history of node movements. Each node maintains a probability to the sink, and the node with higher probability would send its messages to the node with lower probability when two nodes encounter. Similar to [7], PROPHET [16] computes a forwarding probability based on the historical record of its observed contacts, and messages are routed to its neighbor only if it has higher probability than the neighbor. The CAR (context-aware routing) scheme [17] takes the contextual factors such as residual energy, change rate of topology, and moving speed as the input and uses Kalman filter to calculate the probability to the destination node. Messages are sent to the node with the highest probability. Most of the schemes mentioned above assume a random mobility model where the chance for communication is usually by accident and uncertain.
More recently, studies have focused on mobile social networks (special type of DTNs consisting of human-carried devices) and analyzed the social network properties of these networks to assist the design of routing algorithms, where data forwarding metric is centrality-based. bubble rap [18] uses betweenness as the centrality metric which measures the social importance of a node facilitating the communication among other nodes. In friendship-based routing [19], friendships in terms of their behaviors are defined between nodes (i.e., people) to facilitate message forwarding. In addition [20] studies the transient characteristics of node contact patterns. It formulates the transient social contact patterns of mobile nodes as a Gaussian function, based on which it develops data forwarding metrics to analytically predict the contact capability of mobile nodes with better accuracy. In addition [21] proposes a community-based message forwarding scheme CMTS. It organizes the network into different communities based on the contact frequencies among them. The number of message copies is determined by the communities, and messages are transmitted to target communities mainly relying on active nodes that have larger social degrees.
Yet schemes mentioned above are general message transmission schemes, which are not optimized for the data gathering application. The algorithm proposed in this paper would learn the moving pattern of nodes and actuate the sink node properly to improve the overall performance.
2.2. Data Gathering
Nodes in sensor networks continuously sense the environment and generate large volume of data. Traditional algorithms such as TAG [10], PULL/PUSH [9] all depend on infrastructures such as query trees or clustering to collect data. Yet in OWSNs these infrastructures are expensive to maintain as the full point-to-point links are usually not available, so infrastructure-free strategies are adopted in the data gathering algorithms.
Reference [6] introduces a real deployment of opportunistic network in agricultural applications which uses the PBR (potential-based routing) algorithm for data gathering. By setting higher potential to remote sensors and lower potential to data server, sensor data is autonomously gathered at lower potential nodes. In data mules system [22], the mule nodes collect the sensing data and route them to the access point through one or multiple hops of transmissions. In the message ferrying mechanism [23], ferry node loads data from the source nodes and then forwards them to the middle nodes while moving along its path. The path could be predefined or resolved from the requests of the ordinary nodes. Reference [24] uses a predictable mobility model to collect sensing data, where nodes would learn the connection time with the mobile nodes (e.g., buses) and wake up at that time to facilitate data communication. Our algorithm also learns the mobility model to improve the performance, but we assume all nodes are mobile nodes and besides the connection time, our scheme introduces other factors such as location, contact duration, and so forth for optimization.
Reference [4] uses a mobile sink node to collect static sensor readings by controlling the movement of the mobile sink. It models the data collection problem as sensor selection problem and analyzes the design of a feasible movement route for mobile sink to collect data and minimize the velocity requirements. The schemes use mobile sink node to assist in data gathering, but it assumes the ordinary nodes are static. In OWSNs, all the nodes are mobile and they adopt a style of opportunistic communication, so we need new and energy efficient algorithms that are suitable for the network to collect the sensing data.
3. Network Model and Cost Model
In this section, we define the network and analyze the cost model for data gathering within the network.
3.1. Network Model
We assume the network has the following characteristics (as in Figure 1):
there are one sink node and N sensing nodes, every node has a unique id
nodes periodically sense the environment and generate a tuple. These tuples are to be gathered at the sink; all copies of the same message have the same message id;
the sensed nodes have constraint on energy and storage space, yet the sink has no limit on these aspects;
nodes have the knowledge of their locations, and they could record their locations at proper time;
the movement displays some kind of patterns in cycles; and the sink is programmed and actuated by applications.

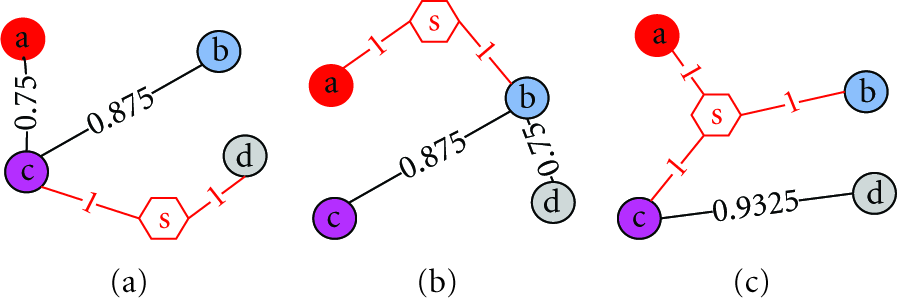
Illustration of data gathering strategies in OWSN.
The network uses an opportunistic way for message transmission. When two nodes encounter, they establish a temporary communication link for message exchange. Here we define some notions of network connection.
Definition 1 (chance for communication).
Given
For the sake of convenience, we use
Definition 2 (path).
For node
3.2. Cost Model of Data Gathering
As the network consists of N sensing nodes and one sink node, the collection of all encounters could be denoted as

where
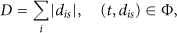
where s denotes the sink. If the total data
Since the sink could be programmed and actuated by applications, the time and place that the sink encounters with other nodes belong to the calculation of the data gathering problem. So the goal of the data gathering algorithm is to calculate the encounter collection

where
4. Data Gathering Algorithm Based on Location Prediction
4.1. Algorithm Overview
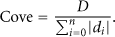
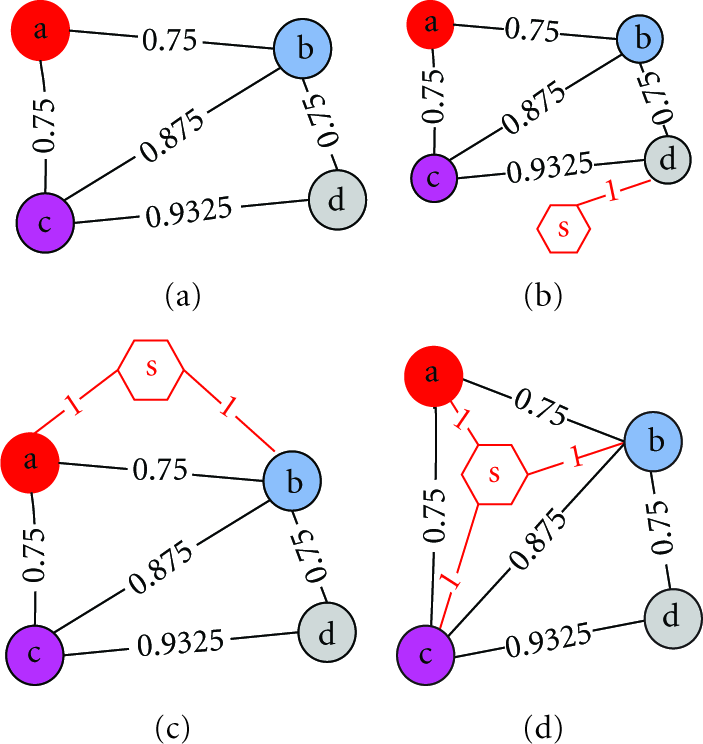
This section describes details of the proposed data algorithm PDA (predictive dynamic data-gathering algorithm) in OWSNs. As an overview, Figure 1 compares the PDA strategy with a probability-based data gathering scheme in OWSNs. The circles denote the nodes and the dashed lines denote the paths along which the nodes move, and Table 1 presents the time, nodes, and duration of the connections. In Figure 1(a), the sink s encounters node d, and d encounters nodes b and c, so the data forward probability is
Encountered nodes and their contact duration.
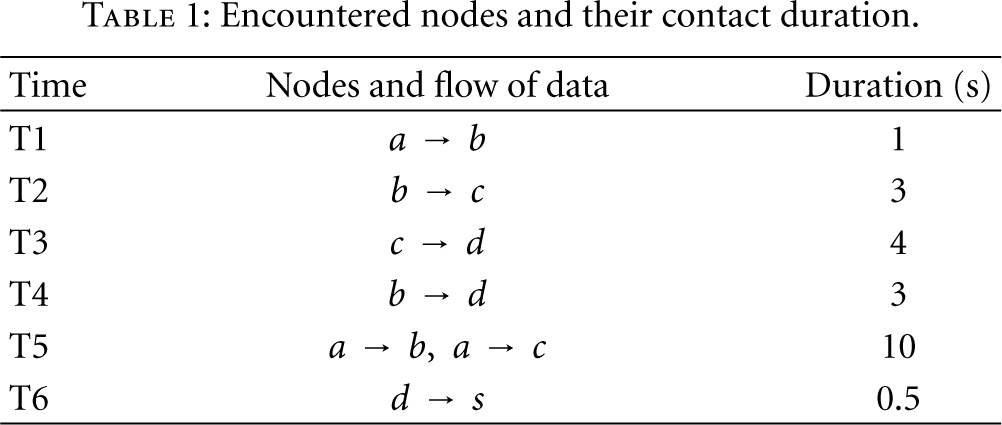
There are 4 phases in the PDA algorithm: (1) the sink collects metadata such as historical node movements, the contact durations, and so forth for modeling; (2) the sink builds an encounter graph to dynamically compute the optimal locations of data gathering points; (3) the sink is controlled to move to data gathering points to collect the sensing data, saving lots of transmissions and improving the data collection coverage; (4) gathering points are updated if necessary.
4.2. Initial Run
At the very beginning, PDA adopts the epidemic routing strategy [13] for message transmission and data gathering. The sink moves according to the way-point mobility model for information exchange in the sensing field. Each node, for example,
Examples of MTable.

The length of initial run is 1 sliding window. Within the time span MTables are disseminated from the ordinary nodes to the sink and also among the ordinary nodes. To avoid the over-flooding problem, PDA uses filtered and compressed version of MTables. For example, Table 2(b) shows a compressed version of the MTable in Table 2(a), where the compressed MTable only includes tuples whose contact duration is greater than 1.0s. Controlled-flooding strategies are also used to cut down transmissions in this phase, which would be further discussed at Section 4.4.
4.3. Calculation of Data Gathering Points
4.3.1. Constructing the Contact Graph
The sink would merge MTables from ordinary nodes and use them as the input for constructing the contact graph. Firstly, for every node

where T is the current epoch, and
If encounter probability
Contact graph G and possible positions of the sink.
4.3.2. Calculation of Data Gathering Points
The contact graph is actually a sketched description of the moving pattern of nodes, and it is used to calculate the data gathering points. Then the sink would move to these predefined gathering points to collect the sensing data. Figures 2(b) and 2(c) illustrate the possible positions of the sink when gathering the data.
We denote the position of the sink as s and denote the encounter probability of node

where

where


where ρ is the predefined threshold of the data coverage. When nodes move randomly, it is undesired to calculate the optimal data gathering positions; when nodes move according to some kind of pattern, then the edges in the contact graph represents larger chance of encounters and longer connections among the nodes. So the optimal data gathering points could be calculated according to (9).
A direct method for calculating
Possible spanning trees when the sink is added to the graph.
When the data gathering point is decided, suppose the set of vertexes connected with the sink is P, then the nodes represented by P could all connect with sink during some time period. The optimal location of the sink is defined as the geometrical center, which could be calculated from the information such as connection timestamp and location contained at edges of the contact graph.


where
4.4. Data Gathering
When the gathering position is decided, a set of nodes

where edge

where
4.5. Update of Data Gathering Points
Although we assume the pattern of node movements are relatively stable, as time goes by the gathering points may be obsolete. In more detail, there are two cases when PDA needs to adjust the data gathering points.
The sink encounters most of the nodes in
The sink only encounters a small part of the nodes in
It is worth mentioning that the MTable's are not affected by the DFP's of the nodes; they are flooded within the network. To cut down the cost of metadata transmissions, a TTL (time-to-live) segment is inserted into the message. When a piece of metadata is copied to a node, TTL increases by 1; the copy is stopped when TTL increases up to the predefined threshold. Moreover, a probability is used for the metadata exchange. When node
5. Experimental Study
We implement PDA in C# and compare it with other data gathering schemes. The experimental result shows that PDA reduces about 40~60 percent of message transmissions and improves data collection coverage rate about 8~12 percent, compared with other epidemic and probabilistic data gathering algorithms.
5.1. Environment Setup
To simulate the movement pattern of nodes, we adopt the community model described in [16]. In the model, the network is divided into

Snapshot of the simulation field (
Three other data gathering algorithms are compared with our algorithm: (1) Random: the sink moves according to the way-point mobility model and collects data from the nodes it encounters. There is no data exchange between ordinary nodes; (2) Epidemic [13]: the sink and ordinary nodes take advantage of all chances of communications and data are exchanged among any nodes if possible and finally routed to the sink; (3) PROPHET [16]: data are exchanged according to the data forwarding probability which is maintained by the nodes using the movement history. As the cost of communication dominates the depletion of the limited battery energy in sensor nodes, we present only the total communication cost (number of packets) incurred by various algorithms. We assume ideal links when two nodes meet and establish a connection. Table 3 lists the default parameters in the simulations.
Parameters of the simulation.

5.2. Performance Comparison and Analysis
5.2.1. Impact of Network Size and Radio Range
From Figures 5 and 6 we would see that the size of the network has great impact on the message transmissions, yet has little impact on the data coverage. Random has the smallest number of transmissions (about 5% of that in Epidemic); Epidemic and PROPHET have the largest number of transmissions, and the performance of PDA is in the middle, which cuts down about 38% of transmissions. But from the view of data coverage, Random has a coverage of 80%, and PDA is about 5~10% higher than Epidemic (about 89%) and PROPHET (about 83%). This lies on two aspects: (1) PDA takes advantage of the pattern of node movements, and controls the sink to collect the data at optimal data gathering points; (2) PDA requires less storage space than other algorithms (discussed in Section 5.2.2). When

Network size versus messages.

Network size versus data coverage.
Figures 7 and 8 shows the impact of radio range. From the figure, we could see that the data transmissions and coverage grow with the radio range. Random has the best performance on transmissions, and PDA has the best performance on data coverage. Yet when radio range grows up to 16 m, the data coverage and transmissions increase to their maximal. Note that when radio range is large (e.g., 24 m), the number of message transmissions in Random is about 1.8*104 and the data coverage is about 93%, which is a good performance for data gathering. Yet considering the increase of radio range is constrained by the hardware and would greatly increase the cost of per-unit data transmissions, to improve the performance by increasing the radio range is actually impractical in real deployments.
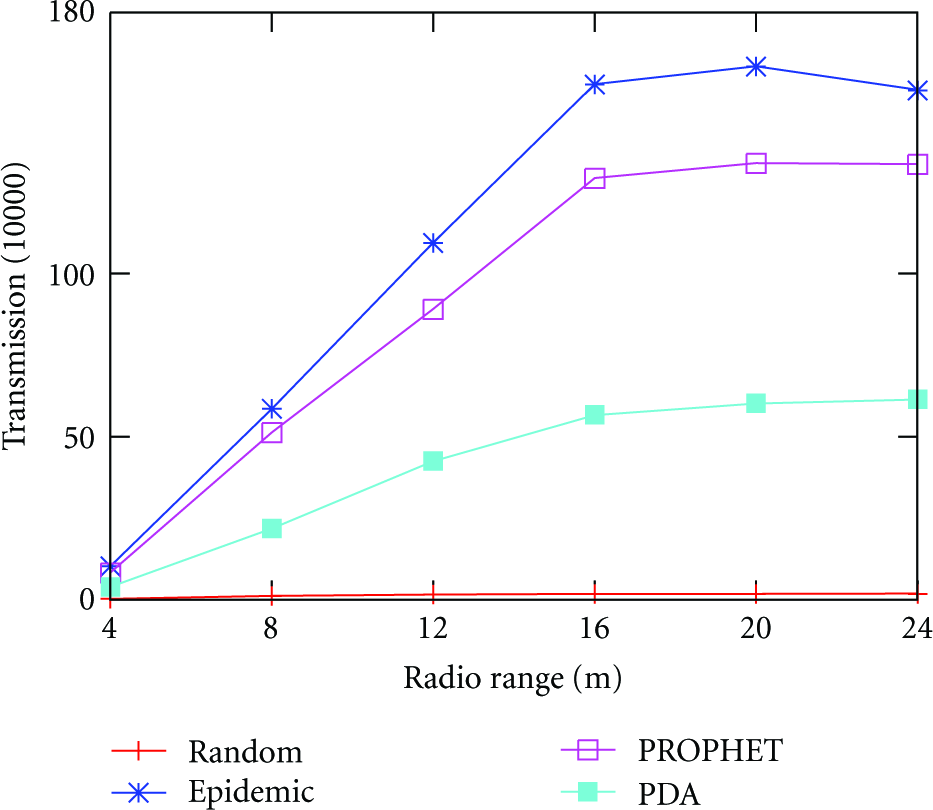
Radio range versus messages.
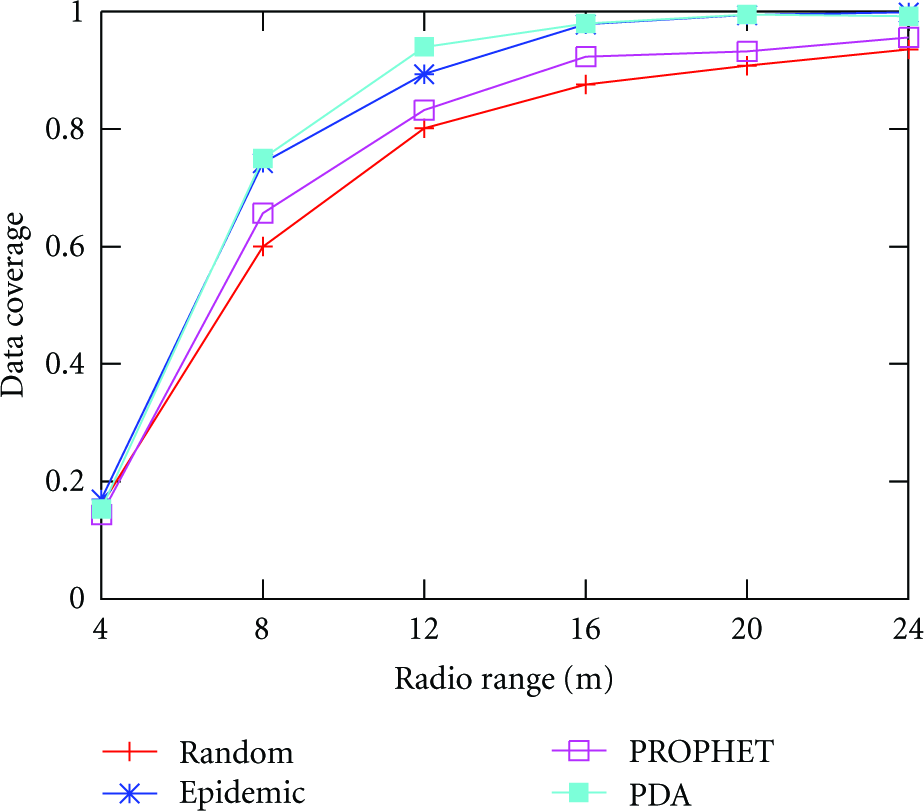
Radio range versus data coverage.
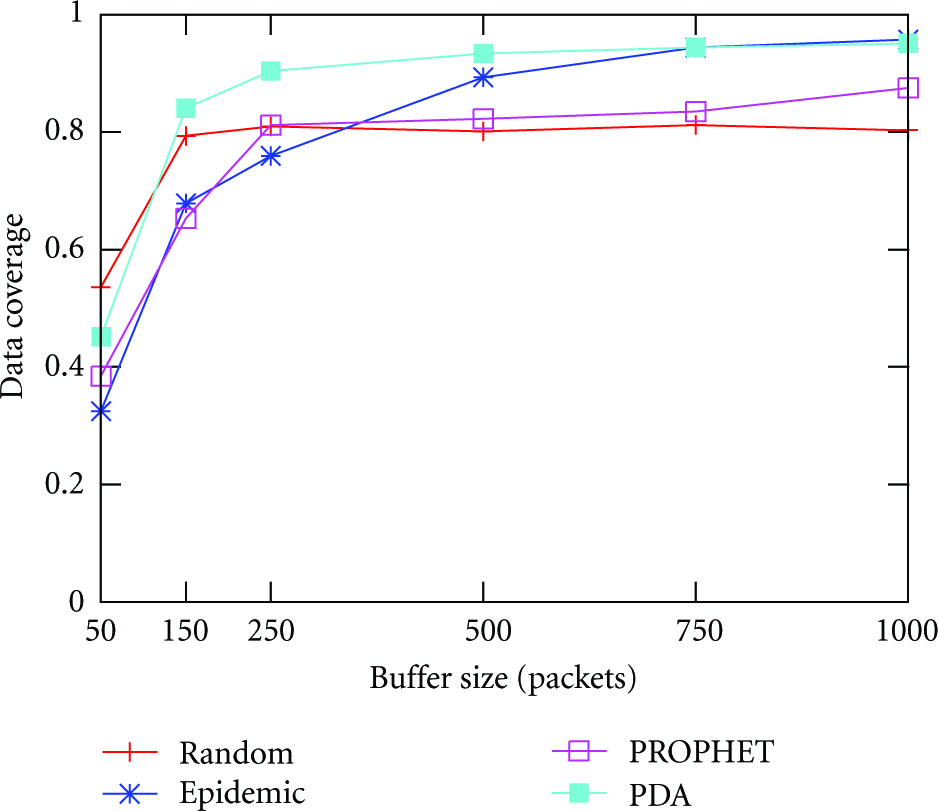
5.2.2. Impact of Buffer Size
As the algorithms adopt a “Store-Carry-Forward” scheme for message transmissions, the size of buffer would have a great impact on the performance. In Figures 9 and 10, every node would generate 0.2 packets per second, so each node would have 400 (

Buffer size versus messages.
Buffer size versus data coverage.
5.2.3. Impact of Moving Speed
The moving speed of nodes reflects the activeness of the network. When nodes move faster, more nodes would meet and make data exchanges. Figures 11 and 12 show that the data transmissions and data coverage increase with the average speed of nodes. When nodes move slowly (e.g., 2 m/s), all algorithms incur small transmissions and small data coverage as there are fewer opportunistic connections. Compared with Epidemic and PROPHET, PDA cuts down about 62% and 47% of message transmissions and increases about 5~8% of the data coverage.
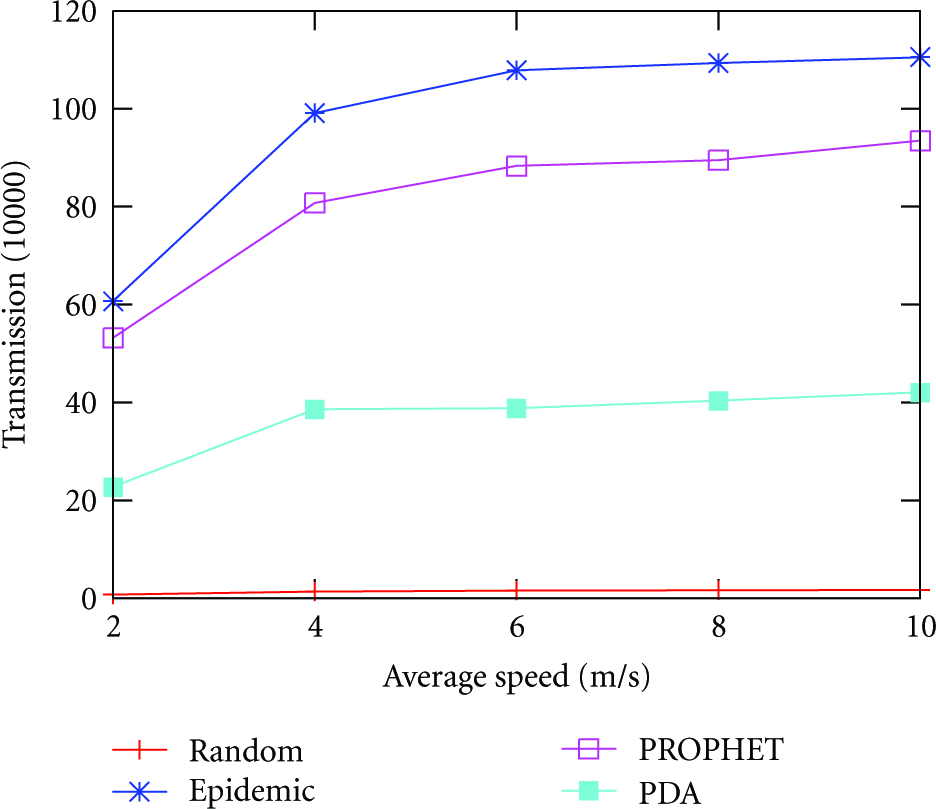
Average speed versus messages.

Average speed versus data coverage.
5.2.4. Comparison of Delay
Figure 13 shows that besides Random, the data coverage increases quickly with time and goes to a relatively stable point when the time is greater than 600 s. This is because all the algorithms are based on the epidemic copy strategy, and for PDA and PROPHET there is an initial phase when messages are copied among the nodes, which cuts down the delay for data gathering. But in Random, data would not be exchanged between ordinary nodes, so it has larger delay on the data gathering process. Random has a delay of about 500 s for its data coverage to climb up to 60% compared with other algorithms.

Change of data coverage with time.
5.3. Impact of Other Factors
5.3.1. Impact of Optimal Position Set
The optimal position

Impact of optimal position set.
5.3.2. Impact of Metadata
PDA collects metadata based on MTables within every observed period (or sliding window). The default size of window is 5 epochs, and each epoch is 100 s. As illustrated in Figure 15, the cost of metadata collection takes only a little portion of the whole transmissions for data gathering. When node connection threshold

Impact of node connection threshold.
5.3.3. Impact of Hot Communities
Figure 16 illustrates the impact of hot communities. As the number of hot communities increases, the data transmissions are relatively the same, yet the data coverage goes down from 94% to 78%. In PDA, hot communities of each node are randomly selected from the hot communities of the network, and each path of the node would contain at least one hot community of the node's hot communities. When there are fewer hot communities in the network, nodes have fewer overlapped hot communities, and the paths of nodes intersect with each other with higher probability, and there are more chances for nodes to meet each other and exchange their sensing data when traveling along their paths. So the pattern of node movements is formed here, and data is routed to the sink at predefined data gathering points and finally increases the data coverage. This also reflects that PDA is more efficient and suitable for cases when nodes move according to the patterns.
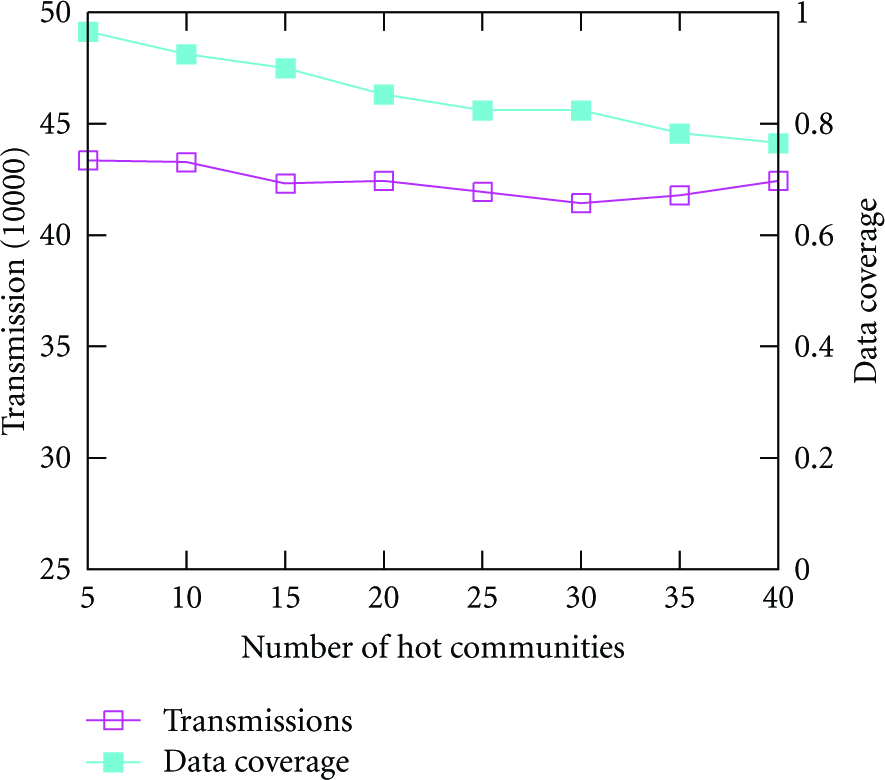
Impact of hot communities.
In order to study the unbalance of message transmissions in the network, we also present the maximal, minimal, and average number of message transmissions in PDA. As illustrated in Figure 17, the average number of sent messages is about 8000 for each node, and the minimal number is around 3000 messages. However, the maximal number of transmitted messages is about 30,000 when there are only 5 hot communities, and it goes down when there are more hot communities. When there are fewer hot communities (e.g., 5), the nodes are more likely to encounter each other at the communities. These nodes are the active nodes and they would exchange data from each other, making the maximal number of message transmissions larger. Here we assume that the nodes have enough energy to route their own or relayed messages. Yet it is possible that some nodes could not route their messages when they are out of energy. The unbalance of energy consumption is a common problem for the sensor network, and we leave this part of discussion as our future work.

Unbalance of message transmissions.
6. Conclusion
As the integration of opportunistic networks and wireless sensor networks, data gathering is becoming an important issue in OWSNs. In this paper we have proposed an efficient data gathering algorithm that takes advantage of the pattern of node movements. It collects the network metadata to create a contact graph, based on which the optimal data gathering positions are calculated and the sink is controlled to move to these positions to collect the sensing data, avoiding lots of unnecessary transmissions. Extensive experimental results show that the proposed algorithm can reduce about 40~60 percent of message transmissions and improve data collection coverage rate about 8~12 percent, compared with other epidemic and probabilistic data gathering algorithms.
For the future work, we are going to implement and deploy PDA on real test bed to validate the performance of the algorithm. We are also planing to investigate the impact of cache strategies and data redundancy of nodes to further improve the performance of the data gathering algorithms in OWSNs.
Footnotes
Appendix
For the static sensor network, the network topology is fixed. Each node, for example,
A virtual node vs is then added into the network.
with constraints:
The capacity constraint relates to the bandwidth constraint, and the flows from
Acknowledgments
This work is supported by the Natural Science Foundation of China (no. 61202012), Natural Science Foundation of Fujian (no. 2011J05156), Fundamental Research Funds for the Central Universities (nos. 2012121030, 2011121049), and Open Project Foundation of the Key Laboratory of Data Engineering and Knowledge Engineering, Ministry of Education (no. KF2011002).