
Abstract
Abrasive particles in the suspension mixture in an abrasive water suspension jet (AWSJ) machining causes acute skin friction effect thereby effectively changing the jet diameter due to wear, which in turn influences jet exit kinetic energy. This results in lowering the life of the jet for effective machining. In consideration of this aspect, the present work examines the effect of inlet pressure on skin friction coefficient and jet exit kinetic energy. It is inferred from the analysis that an increase in inlet pressure causes a significant increase in skin friction coefficient and also results in proportional increase in the exit kinetic energy of the jet. Further, it is revealed from the analysis that an increase volume fraction of abrasive (abrasive concentration) in water results in significant decrease in the skin friction coefficient and jet exit kinetic energy.
1. Introduction
Advances in research and development of new engineering materials are indispensable to parallel development of machining methods to process such materials. Machine components with complex shapes that need to be produced from brittle and heat-sensitive materials as well as composites can now be machined by an advanced manufacturing method called abrasive water jet (AWJ) machining. Through computer numerical control of jet movement on the work part, complex profiles with better surface quality and precision can be achieved. Abrasive water suspension jet (AWSJ) is one of the variants of AWJ machining in which suspended abrasive particles in a liquid medium called slurry are pressurized and expelled through the nozzle. Benefit of AWSJ over AWJ is the generation of stable jet with higher power density, which leads to efficient energy transfer to abrasive particles [1–4].
Nozzle wear is a complex phenomenon, which is not only influenced by the material properties of the nozzle but also by the nozzle geometry and operating parameters of AWSJ [5–8]. A host of articles is available for both experimental and numerical aspects of two-phase flow [9–38]. AWSJ machining operates at relatively high pressure (10–1000 MPa). Slurry is accelerated through a fine orifice (0.20–1 mm diameter) to produce a high-velocity stream, which is capable of machining a range of materials. The abrasive particles moving with the corresponding high velocity of flow cause severe wall shear in the nozzle. This causes erosion of the nozzle, due to which the effective diameter of the nozzle may change significantly resulting in reduced exit kinetic energy of the jet. Study of wear characteristics of the nozzle is critical for the growth of AWJ technology. In consideration of this aspect, the present work examines the effect of volume fraction and inlet pressure of suspension mixture on the skin friction effect and jet kinetic energy.
2. Theoretical Formulation
2.1. Numerical Model and Assumptions
Computational domain consists of flow field through abrasive suspension nozzle connected to the focus tube as described in Figure 1. The abrasive water suspension mixture is let into the nozzle at the inlet and is carried down through the converging cone to the focus tube and exits as coherent jet at the nozzle exit, in which the focus tube is used for stabilizing the flow. The numerical model adopted closely follows the work of Hu et al. [9] in which liquid-solid two-phase flow is considered, and the following assumptions are valid for the present work.
Flow is taken to be two-phase flow in which the primary liquid phase mixes homogeneously with the particles of equal diameter, constituting the solid phase.
The primary liquid phase is continuous and incompressible.
Two-phase flow assumed is steady and characterized by turbulent flow.
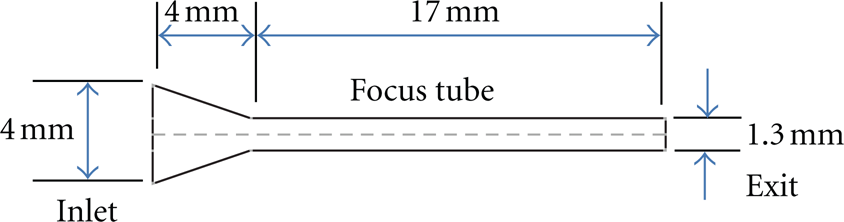
Computational model of AWSJ nozzle.
2.2. The Computation of Particulate Loading (β) and Stokes Number (S t )
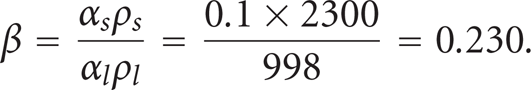
Particulate loading and the Stokes number are important parameters that help to identify the appropriate multiphase model. Particulate loading has a major impact on phase interactions and is defined as the mass density ratio of the dispersed phase (d) to that of the carrier phase (c). The particulate loading for garnet abrasive is
The degree of interaction between the phases is intermediate loading, and the coupling is two ways, that is, the fluid carrier influences the particulate phase via drag and turbulence, but the particles in turn influence the carrier fluid via reduction in mean momentum and turbulence. All multiphase models can handle this type of problem, but it is found that the Eulerian multiphase model seems to be the most accurate one [27]. The average distance between the individual particles of the particulate phase can be estimated by equation:


From (3),

The average distance between the individual particles of the particulate phase is calculated from (4) for an abrasive particle size of d p = 63 μm:

Estimating the value of the Stokes number helps to select the most appropriate multiphase model. The Stokes number is defined as the ratio of the particle response time (τ d ) to the system response time (t s ). These are obtained from

For S t less than unity, particles will closely follow the fluid flow, and any one of the three multiphase models, namely, Volume of fluid model, mixture model, or eulerian multiphase model, is applicable. Also from the calculation of the effect of particulate loading (β), it is clear that coupling between two phases is intermediate [27]. Hence, present numerical simulation is carried out using Eulerian multiphase model which though is most expensive in computation, it gives most accurate results. Eulerian Multiphase model is embedded in FLUENT software. FLUENT solves a multifluid granular model to describe the flow behavior of fluid solid mixture. The stresses induced in the solid phase are deduced through an analogy between the random particle motion arising from particle to particle collisions and the thermal gradient of molecules in the fluid stream taking into effect the inelasticity of the granular phase. Intensity of the particle velocity fluctuations determines the stresses, viscosity, and pressure of the solid phase [27].
The governing equations for mass and momentum conservation are solved for the steady incompressible flow. The finite-volume method [10] was used for the numerical solution of the system of equations. The algorithm used for the solution of the equations is the interphase slip algorithm (IPSA) [11, 12]. The linkage between pressure and velocity is handled via a more efficient version of the well-known semi-implicit method for pressure-linked equations (SIMPLEs) algorithm developed by Patankar and Spalding [10] which is called SIMPLE shortened (SIMPLEST) [13]. The turbulence is modeled using realizable k-ε turbulence model [27]. The power law scheme was used for obtaining the solution [28]. The governing partial differential equations, for mass and momentum conservations, are detailed below.
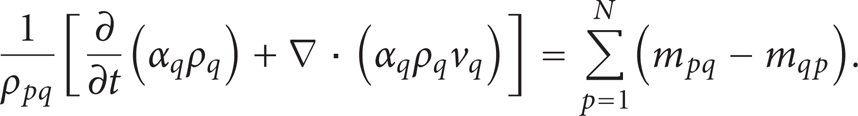
Continuity Equation
Consider the following:
Fluid-Solid Momentum Equation
The conservation of momentum equation for the solid phase is as follows:

The conservation of momentum equation for the fluid phase is as follows:

3. Method of Solution
3.1. Numerical Scheme
Conservation equations are solved for each control volume to obtain the velocity and pressure fields. Convergence is effected when all the dependent variable residuals fall below 0.00001 at all grid points. Computational domain is modeled using commercially available preprocessor routine called GAMBIT, and meshing is carried out using appropriate grid cells of suitable size available in the software routine. Wall region in the flow domain is closely meshed using the boundary layer mesh concepts for extracting high-velocity gradients near the boundary walls. According to the structure of nozzle and jet characteristics, computational domain is built as axisymmetric model. Figure 2 shows the computational domain. The grid independence test is performed to check the quality of mesh for solution convergence as shown in Figure 3. It is clear from the grid independence study that there is negligible variation of not more than 1%, in the axial velocity distribution for the three mesh geometries consisting of 21200, 25440, and 29690 control volumes. Hence, considering lower computational time desired, an optimum mesh geometry consisting of 25440 control volumes has been adopted in this work. The runs were performed on computer having Intel Xeon central processing unit with 4 GB RAM and clock speed of 3.10 GHz. A typical run requires 4 hours of CPU time on the above computer.
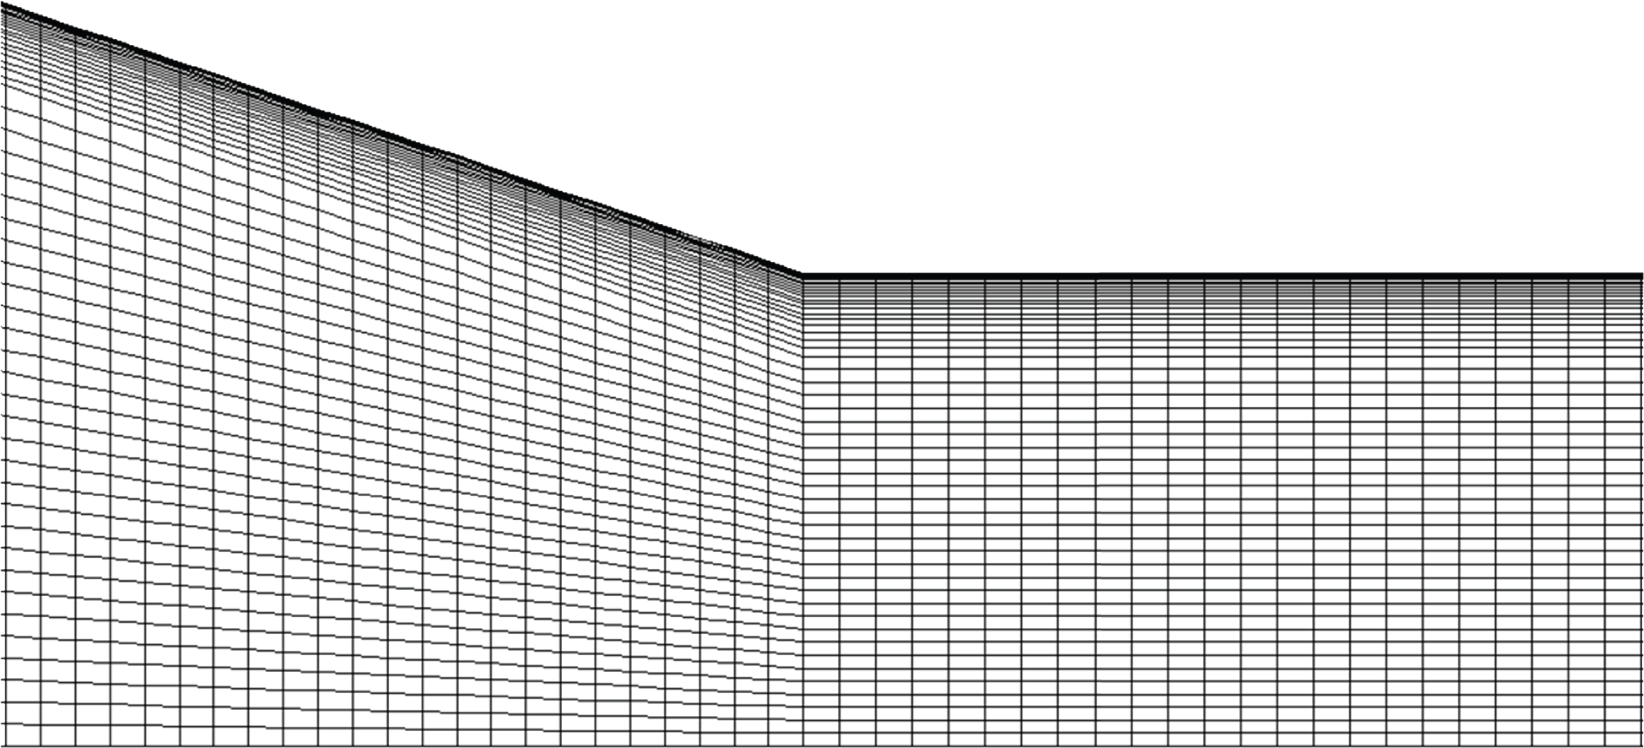
A portion of the meshed domain near the critical section of AWSJ nozzle.
Result of grid independence test for the AWSJ nozzle.
3.2. Boundary Conditions and Operating Parameters
Suitable boundary conditions are imposed on the computational domain, as per the physics of the problem. Inlet boundary condition is specified by the operating pressure entering the nozzle. It is assumed that velocity at inlet is uniform across the cross-section. At the exit, static pressure of effluxing flow is taken to be zero (gauge), so that the computation would proceed by the relative pressure differences across the grid volumes for the entire domain of the flow. Wall boundary conditions are impressed to bound fluid and solid regions. In viscous flow models, as in the present case, velocity components at the wall are set to zero in accordance with the no-slip and impermeability conditions that exist on the wall boundary. The axis of the nozzle is used to reduce computational domain to an axisymmetric problem for which suitable boundary conditions are imposed, that is, the gradients of fluid properties are set to zero across the axis line. In the present numerical simulation, a mixture of water and suspension liquid is treated as phase 1 (suspension liquid) and abrasive as phase II (garnet). The input parameters used in the analysis are as shown in Table 1 taken from [4, 9].
Input parameters for numerical simulation.

4. Results and Discussion
4.1. Validation of the Numerical Model
The present model is benchmarked against the numerical work cited in [9]. The graph of the velocity distribution of one of the phases (liquid phase) has been calibrated in the present work as shown in Figure 5 with that of the work cited in the literature as shown in Figure 4. It is clear that there is good agreement between the two models as regards to the velocity distribution.

The velocity distribution along the length of the nozzle as given in [9].

The velocity distribution along the length of the nozzle as per the present model.
4.2. Effect of Inlet Pressure on Average Exit Kinetic Energy of the Jet
Figure 6 shows the variation of average exit kinetic energy of the jet corresponding to various inlet operating pressures. The average exit kinetic energy is computed from area-weighted average over the control volume at the exit of the nozzle. It is observed from Figure 7 that the jet exit kinetic energy is linearly proportional to corresponding inlet operating pressures. This is due to the fact that the inlet operating pressure energy manifests itself as proportional amount of kinetic energy at the exit of the nozzle with viscous shear stress dissipation representing the loss of energy.
Variation of average exit kinetic energy of the jet with inlet operating pressure.
Plot of net energy dissipated due to skin friction effect with respect to inlet operating pressure.
Figure 7 shows net energy dissipated due to skin friction coefficient corresponding to various inlet operating pressure conditions. It is seen from the graph that the viscous shear force dissipation is also proportional to various inlet operating pressure conditions.
The net energy dissipated due to viscous shear is defined as

In addition, abrasive particles moving with flow cause severe wall shear that leads to erosion of the inside surface of the nozzle, resulting in decreased jet kinetic energy, and thereby affecting the performance of the nozzle for effective machining.
4.3. Effect of Inlet Operating Pressure on Skin Friction Coefficient
Figure 8 shows the variation of skin friction coefficient developed along the length of the nozzle corresponding to various inlet operating pressure conditions. It is seen that along the length of nozzle corresponding to various inlet operating pressure, the skin friction coefficient shows sharp increase with spike occurring followed by a short drop in its values exactly where there is a change in cross-section from conical to straight. It is well known that local skin friction coefficient is proportional to local Reynolds number of the flow or, in other words, the corresponding velocity of flow [21]. Thus, within conical portion of nozzle, velocity increases rapidly, and hence, skin friction coefficient spikes up as shown in the graph. As the fluid has not fully developed in the short conical tube when flow velocity changed rapidly at the critical section as explained above, it is found from the graph that skin friction coefficient shows sharp fall due to sudden contraction which corresponded to a loss of energy of flow. However, as the fluid moves further downstream into a well-developed turbulent flow profile all along the long focus tube, the skin friction coefficient does not show much variation and remains almost constant as shown in the graph.
Distribution of skin friction coefficient along the length of the nozzle corresponding to various inlet operating pressure.
But at higher inlet operating pressures and hence correspondingly at higher kinetic energy levels along the flow paths, the velocities are also high. As stated earlier, higher velocities contribute to higher skin friction coefficient at the wall. Hence, there is higher level of skin friction coefficient at higher pressure, and conversely at lower operating pressure, skin friction coefficient will be lower.
4.4. Effect of Volume Fraction of Abrasive Particle on Skin Friction Coefficient
Simulation has been carried out using garnet abrasive for volume fraction of 5%, 10%, and 15%. The effect of volume fraction on skin friction coefficient may be observed from Figures 9 and 10. It is clear from these figures that the skin friction coefficient increases with reduction in volume fraction of abrasive particles along the length of the AWSJ nozzle. Skin friction coefficient attains a peak value at critical section of nozzle where cross-section of the nozzle changes from conical to straight portion and thereafter remains almost constant along the straight focus section of the nozzle. This may be attributed to the fact that the velocity of the jet increases with corresponding decrease in volume fraction of abrasive particles, which results in an increase in the velocity gradient near to the wall of the nozzle. This leads to higher skin friction coefficient. Further, the skin friction coefficient shows a peak near the point corresponding to the critical region where flow changes from converging cone to cylindrical portion. This could be explained by the fact that a sudden velocity change caused due to a higher-velocity gradient in the near wall region at the critical section produces a peak in the skin friction coefficient at that region. However, the skin friction coefficient seems to attain near constant value along the focus tube as there is no significant velocity change in the constant diameter focus tube till the exit of the nozzle for any given volume fraction.

Effect of volume fraction on skin friction coefficient along the length of the nozzle.

Effect of volume fraction on skin friction coefficient at the critical section of the nozzle.
It is observed from Figure 10 that increase in the volume fraction of abrasive in suspension mixture results in decrease in skin friction coefficient. This is due to the fact that increase in volume fraction of abrasive particles results in increased concentration of abrasive in the suspension mixture. There is increased fluid energy loss in transporting these abrasive particles, leading to a decrease in kinetic energy resulting in decreased jet velocity. This leads to reduce skin friction coefficient along the wall of the nozzle.
4.5. Effect of Volume Fraction of Abrasive Particles on Exit Kinetic Energy of the Jet
Figure 11 shows the variation of average exit kinetic energy of the jet corresponding to various volume fractions of abrasive particles. The average exit kinetic energy is computed from area-weighted average over the control volume at the exit of the nozzle. It is observed from Figure 11 that there is a marginal decrease in jet exit kinetic energy with increase in volume fraction of abrasive particles. As explained previously, the higher the concentration of abrasive particles in the fluid, the higher the fluid inertial resistance while transporting these abrasive particles leading to reduction in exit velocity. Hence, there is a corresponding decrease in jet kinetic energy with increase in volume fraction of abrasive particles.

Effect of volume fraction on average exit kinetic energy of the jet.
5. Conclusion
The following conclusions are deduced from the above CFD simulation:
increase in inlet operating pressure results in significant increase in the skin friction coefficient;
the skin friction coefficient approach peak values correspond to the sudden change in the flow passage geometry at the critical section;
increase in the inlet operating pressure results in linear increase in the average exit kinetic energy of jet;
the net energy dissipated due to skin friction coefficient is linearly proportion to the inlet operating pressure;
for the same operating parameters, increase in the abrasive volume fraction results in significant decrease in the skin friction coefficient;
increase in volume fraction of abrasive particles results in decrease in exit kinetic energy of the jet.