
Abstract
Wireless sensor networks (WSNs) comprising of tiny, power-constrained nodes are gaining popularity due to their potential use in a wide range of applications, including monitoring of environmental attributes, intrusion detection, and various military and civilian environments. While the sensing objectives of these environments are unique and application dependent, a common performance criteria for wireless sensor networks is prolonging network lifetime while satisfying coverage and connectivity in the deployment region. In many real-world scenarios, reoccurring spatial patterns of occurrence could be identified in the sensed event information. This paper proposes a new routing algorithm schema based on event occurrence history to secure K-Coverage of event paths and maintain the maximum degree of coverage. In the proposed method the nodes located around event path try to save their battery power by not participating in data packet forwarding to neighbor nodes. The simulation results show that the proposed method improves network lifetime by shifting the routing responsibility from sensing nodes to communication nodes, while maximizing the degree of coverage in the main path of event occurrence. As a consequence, the lifetime of main path coverage is increased dramatically as compared to previous methods.
1. Introduction
Recent advances in low-cost and low-power circuit design, microelectronics, and wireless communications have made possible the realization of low-cost miniaturized sensors to collect information throughout a sensing field and to send out this information to a data sink for additional processing [1]. A wireless sensor network is composed of a large number of sensors that are deployed in a field of interest to monitor specific phenomena such as temperature, sound, vibration, light, and humidity. The sensors sense specific environment phenomenon and may perform some processing on the sensed data before sending their results to a central gathering node, called the sink [2]. Spanning health, home, environmental, and military areas are some potential applications of WSNs.
Solid monitoring of the surveillance area where significant events do not go undetected determines the wireless sensor network efficiency in many applications. In several critical applications, such as object tracking and intruder detection, sensor deployment is performed in a way that every point in the field could be sensed by at least one sensor. In particular, it is sometimes necessary to deploy a dense wireless sensor network to achieve redundant coverage of a deployment field, where the events are sensed and covered by at least k sensors. Such setup is called a K -Coverage WSN. High coverage degree helps achieve higher sensing accuracy and stronger robustness against sensor failures [3].
Energy is the most crucial resource as it determines the lifetime of the sensors and therefore the lifetime of the entire network. Especially in hostile environments, where it is difficult or even impossible to access the sensors and recharge or renew their batteries, such as battlefields, energy is a serious challenge for network designers. Furthermore, when the energy of the sensors reaches a certain threshold, they become unreliable (or faulty) and would not be able to function properly.
Once deployed, the first task of a sensor network is to identify a group of sensor nodes to properly cover the target area, in order to make sure that all important events occurred in that area can be accurately, and timely detected by one or several sensors. This is referred to as the “network coverage” problem, which characterizes the monitoring capability and quality of a sensor network. In K -Coverage application redundant sensing and coverage is the one of most important QoS parameters [4]. When the desired sensed data is collected, the challenging task is to design efficient routing schemes for comprehensively, accurately, and timely delivery of raw or partially processed data from the sensor nodes to the information sink, or base station, which is usually located far away from the sensing area. Data communication is the one of major power consumption sources in wireless sensor applications [1]. Because of the wireless sensor's properties, direct connection between sensor and sink to transfer information is not suitable and is often impossible. Consequently sensors communicate with each other (possibly) through a multihop wireless communication scheme and forward the sensed data on behalf of the source. The sink receives this information for further processing.
In some environments, object movement follows a predictable geographical pattern, in contrast to applications where the object movement is completely random. This geographical pattern determines an event path, across which the events in the network are fired more frequently. In such environments, events are sensed only by a subset of the networks' nodes, which are deployed close enough to the network's event path, called Covering Nodes. For example in road car tracking or in the environments containing natural obstacles (like valleys and rocks) object movement is restrained by the environmental features. Figure 1(a) depicts a road while Figure 1(b) represents a WSN deployment in which the cars passing the road (events) and the blue circles are Covering Nodes.

Event occurrence pattern sample.
In such situations the lifetime of the Covering Nodes, which collect the important data about desired objects, defines the networks' effective lifetime. Therefore reducing the energy consumption of these nodes, which leads to a longer coverage of the event path, is of a great importance. By shifting the data routing functionality from covering nodes to other nodes of the network, namely, Communication Nodes, increased event path coverage time with higher degrees could be achieved while keeping an effective communication of the sensor nodes to the sink.
To the knowledge of the authors, no studies have explored the WSN routing issues in K -Coverage networks considering spatial event occurrence patterns. In this paper, we propose a model for routing the event path sensed data by dividing the nodes into Covering and Communication nodes to increase the network's effective lifetime. As discussed earlier the sensed data by the Covering nodes is transferred to the sink using the communication nodes.
The rest of paper has been organized as follows. Section 2 provides an overview of related work on K -Coverage techniques and coverage-aware routing algorithms for wireless sensor network. In Section 3, we introduce several parameters that are used in our model. The proposed algorithm is discussed in Section 4. Section 5 provides details on the simulation setup and the simulation results, examining the different parameters for next node selection in multihop routing approach. Finally Section 6 concludes the paper.
2. Related Work
Researches in the domain of WSN routing are quite extensive, with energy efficiency and scalability being the main focus of many of the protocols proposed so far. Similarly, a lot of works have been done on sensor coverage protocols, which focus on selecting a subset of the active sensor nodes that are sufficient to satisfy the network's coverage requirements, while allowing the remainder of the sensors to conserve their energy by entering the sleep mode. In this section, we discuss the related studies that have been conducted in both areas. Contributions of this paper will be introduced as well.
2.1. K-Coverage Algorithms
The problem of K -Coverage networks can be classified into three categories: (1) scheduling algorithms that select minimum set of node to satisfy degree of K for every point in filed, (2) verifying network to determine network is K-covered or not, and (3) study of connectivity and coverage problem.
The problem of verifying K
-Coverage is studied in [5]. Each sensor is modeled as a disk and it is proved that the area is properly k-covered if the perimeter of all disks is k-covered. The running time of the algorithm is
Xing et al. [8] analyzed the correlation between the coverage and connectivity properties of a network using a geometrical approach and developed a coverage configuration protocol (CCP) to provide any degree of coverage specified by the user. CCP is based on a proof that “if the intersection points between all sensors are k-covered, the whole area is k-covered.” In [9], the authors formulate the K -Coverage problem of a set of n grid points as an integer linear programming. They assume two types of sensors with different sensing ranges and costs. The problem is to determine the minimum cost of sensors in order to cover all grid points. The authors show that the problem is NP-hard [10] since it is a generalized version of the minimum cost satisfiability problem. Small instances of the problem are solved using the branch and bound method, which takes exponential time in the worst case. For large instances, a divide and conquer scheme also has been provided.
In [4, 11], it was shown that in dense sensor networks, K -Coverage can be achieved by activating specified subsets of the deployed nodes. For example, Kim et al. [11] presented a randomly ordered activation and layering (ROAL) schema which solved the K -Coverage problem in a distributed manner without using GPS information by performing a dynamic reconfiguration of the sensor network. The underlying principle of ROAL is to select k-disjoint subsets from deployed sensors to construct k layers, with each layer providing 1-Coverage. Hefeeda and Bagheri [4] showed that the problem of selecting the minimum number of sensors required to achieve K -Coverage is NP-hard and developed a randomized coverage scheme based on local information and low complexity messages to achieve a near optimal solution. The authors modeled the problem as a set system [12] for which an optimal hitting set [12] corresponds to an optimal solution for coverage and used an approximation algorithm to find the optimal hitting set.
The schemes presented so far introduced methods which use static sensor nodes to achieve network coverage. Li and Kao [13] present a distributed self-location estimation (DSLE) scheme based on a Voronoi diagram to achieve K
-Coverage in a wireless sensor network with mobile nodes. The proposed scheme performs K
-Coverage within the sensing field and fast convergence to fulfill more than 88%
2.2. Coverage Preserving Routing Algorithms
Many routing algorithms have been proposed to satisfy the requirement of sensor networks. All routing protocols can be classified based on different standards: according to the network structure, there are three groups named: (1) flit-based, (2) hierarchical-based, and (3) position-based. Considering protocol operation, these routing algorithms can be classified into three categories entitled: (1) query-based, (2) negotiation-based, and (3) quality-of-service (QoS-) based [14]. Lots of previous studies tried to solve the energy saving issue for the data routing protocols in wireless sensor networks [15–18], However, coverage issues are not discussed in these papers.
A clustering algorithm, called Low Energy Adaptive Clustering Hierarchy (LEACH) [17], utilizes a randomized rotation of a local cluster-head (CH) to evenly distribute the energy load among nodes in the network. It also uses localized coordination to enable scalability and robustness for dynamic networks and in corporate data fusion into the routing protocols to achieve energy conservation. In [19], the authors proposed a hybrid, energy-efficient, distributed clustering algorithm (HEED) which periodically selects cluster head according to a hybrid of the node residual energy and a secondary parameter such as node proximity to its neighbors or node degree. Heed terminates in 0 iterations and incurs low message overhead. It achieves fairly uniform cluster head distribution across the network.
Several papers deal with the design of routing methods for the case of wireless sensor networks' coverage preserving protocols. The distributed activation with predetermined routes (DAPR) protocol proposed in [20] is the first routing protocol designed to avoid routing of data through areas sparsely covered by the sensor nodes. The idea behind this approach is that nodes in sparsely deployed areas, as well as nodes with small remaining energies are used less often as data routers, so that these nodes can collect data for longer periods of time. To accomplish this goal, the importance of every sensor node for the coverage-preserving task is quantified by a coverage-aware cost metric, which combines the information about the node's remaining energy with information about how redundantly this node's sensing area is covered by its neighboring nodes' sensing areas. The method presented works fine for sparse networks not dense ones. In this method coverage degree is being excluded from quality parameters of the network. In order to maintain the coverage just the remainder energy of each node is being considered but detected event's pattern in network was ignored. Salzmann et al. [21] propose a routing algorithm which takes into account information concerning coverage and energy, using the advantages of scale free networks [22]. The method detects and exploits transmission and sensing redundancy in sensor networks with Geography Adaptive Fidelity algorithm (GAF) [23]. The redundant nodes will be shut down for energy saving purpose. Nodes in dense areas are turned off in this method as a reason coverage degree cannot be saved and like previous methods detected event's pattern has not been considered. In [24], the authors proposed the notion of connection and cover of a routing protocol. Authors first derive the network coverage provided by n sensor nodes by the mathematical formula. The lower bound of the network connectivity probability is also derived and proposes a location-independent, energy-efficient routing algorithm (ECCRA) which achieves the required network coverage and sensor connectivity simultaneously. The method in uses a mathematical model to get minimum number of nodes to keep the connectivity and coverage, and then based on the presented model the algorithm tries to maintain quality of service parameters. Coverage degree in network modeling is not been considered in this method. Liu et al. [25] proposed an energy-aware routing protocol (EAP) for a long-lived sensor network. EAP introduces a new clustering parameter for cluster head election, which can handle the heterogeneous energy capacities better. EAP uses the average residual energy of the clustering range and the residual energy of nodes for cluster head election. Also it introduces intracluster coverage to cope with the area coverage problem. Each cluster head selects some active nodes within clusters while maintaining coverage expectation of the cluster. In the EAP algorithm choosing nodes to maintain network coverage is based on the energy of each node in each cluster. This method only sustains the 1-coverage in each cluster but not the coverage of higher degrees. In [26] Tsai has proposed CPCHSA which is a modification on LEACH (Low Energy Adaptive Clustering Hierarchy) and virtual grid routing protocols. In the LEACH, nodes are organized into clusters with a distributing manner to reduce direct communication with base station. In each cluster, one node is elected to be cluster-head node randomly to forward data from non-cluster-head nodes to base station. Tsai showed that the sensing coverage, a representation of node density, should also be considered to ensure that the probability for a node to be chosen as a cluster head should be related to its effective sensing area impact on the sensing coverage of a network. Similar to CPCHSA Yunquan et al. proposed PBEACP [27] based on LEACH that considers the remaining energy of nodes and geographic distribution in the selection of cluster-head nodes, leading to a more even distribution of the energy consumption among nodes. They change the cluster selection function in LEACH and define a priority comprised of sensing intensity and remaining energy is used to determine whether a node is cluster-head node or not. CPCHSA and PBEACP use signal estimation to find node potions. Both PBEACP and CPCHSA estimate coverage intersection in each cluster based on signal power. Nodes' coverage overlap is effective in selecting cluster head and is trying to maintain the coverage. These methods use only 1-Coverage in calculations; also, as the amount of energy is more important in choosing the cluster head, this approach is only practical in network with uniform event detection in whole area.
The deficiencies of previous approaches were discussed in this section. In general in preserving coverage degree methods, no routing algorithm is provided. On the other hand in routing algorithms that preserve network coverage, degree of coverage is not considered as a QOS parameter. Moreover, to the best knowledge of the authors, no research has been conducted on the effect of spatial event detection pattern on network routing and coverage at the same time.
Identifying patterns of event occurrence could improve network performance significantly. In the proposed method we will try to predict event detection behavior of the network based on sensed events information in the past, in order to increase data gathering from environment.
3. Definitions and Parameters
In our proposed method the nodes are divided into two categories: coverage and communication nodes, each having a different functionality. Each node in the network is assigned to either of the two categories based on a coverage efficiency function. This function takes various parameters into account to assess the importance of the node in terms of event path coverage. In this section, these parameters and some basic definitions are provided.
Definition 1 (sensing neighbor set).
In the proposed model each sensor performs reliable sensing within its sensing area, which is approximated by a circular area around the node with radius

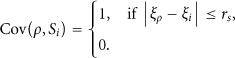
Definition 2 (coverage).
An event occurring at point ρ covered by a sensor
Definition 3 (K-coverage).
A point is called k-covered if it is simultaneously covered by at least k nodes. The degree of coverage for a point

Definition 4 (communication neighbor set).
The communication neighbor set of a sensor

Definition 5 (event path).
A geographical path along which objects usually travel, making event occurrence more probable in the surrounding area.
3.1. Event History of Node
Event history of a node is used to determine the importance of the node in a coverage area. Event history of a node represents the number of events that has been sensed by that node recently. Nodes with more detected events has a greater significance in the covering area.

With constant event occurrence pattern alongside an event path,

3.2. Node Effective Covering Area
The number of the detected events by each node is not adequate to find the importance of a node in terms of network coverage, since there might be some nodes that detect small number of events but cover a large area of the event path. These nodes have a significant potential to cover the event path. As shown in Figure 2, the detected events by a node form a sector inside the node's sensing area circle. This sector is called minimal covering sector
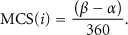

Minimal covering sector (MCS).

Event history versus minimal covering sector of node.
3.3. Redundant Coverage Impact
In redundant sensor deployment, a point is covered by more than one sensor. If each point in field is covered by at least K sensor, the network is considered to be K-covered. Common Covering Set

Since in the proposed algorithm, nodes with less importance in terms of coverage are used for routing, this parameter helps identifying them. For the points having greater degree of coverage than K, members of common covering set has a greater probability of being selected as a communication node.


3.4. Remaining Energy and Communication Cost
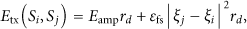
Energy consumed by a node depends on the size of the data packet that has been sent, the distance between the transmitter and receiver, and another constant, called transmitter amplifier.
When sensor node i transmits data to sensor node j, the power consumed by transmission portion is [28]
In communication node selection process, the distance between current node and router (next hop) node is the only variable and other components are considered constant; thus we employ distance in next hop evaluation function.
4. Proposed Algorithm
In previous section we introduced the factors that are used in the proposed routing algorithm. Our schema works as an overlay on a distributed K-covered sensor network. We assume that all nodes have same sensing and communication range, also are aware of their own location information through Global Positioning System (GPS) or some localization techniques [13]. Moreover the sensor nodes are not mobile.
In the proposed algorithm nodes divided into two group of sensing and communication. Communication nodes try to find next hop nodes and setup connectivity paths to sink by broadcasting their information to the neighbors. This process is performed periodically in specific time windows to maintain connectivity and to provide network dynamic as mentioned in Section 3.1.
Nodes broad cast their information to neighbors to construct routing path; coverage nodes do not participate in packet routing so they do not need to broadcast any information other than sensory data, saving their power in order to increase their coverage lifetime. Sensing nodes could change their role to communication nodes in order to maintain connectivity to sink. Our schema consists of three phases: information update, next hope selection, and data communication, as described below.
For ease of future reference, we briefly present the notations used in the next sections in Table 1.
Parameter description.

4.1. Phase I: Information Update
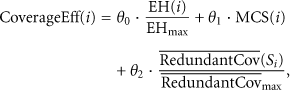
In order to classify nodes into communication and coverage nodes (12) has been used; this equation defines coverage efficiency function that evaluates the coverage importance for a node as the basis of node role selection. If coverage efficiency function is less than a predetermined coverage efficiency threshold, the node starts to broadcast information to neighborhood as a communication node. Otherwise it works as a coverage node. The median of neighbor's coverage efficiency function is used for threshold value in this paper. Two criteria are determined to select coverage efficiency threshold which are average and median of neighbor's coverage efficiency. As the median ended up in better results than the average in empirical simulations, it is selected as the threshold.
Based on (12) each node uses three parameters that have been described in previous section, to calculate its role as sensing or communication node. Communication nodes broadcast their power, location,
Unlike similar methods, in the proposed algorithm not all nodes are required to broadcast their routing information. The nodes evaluate their importance in coverage on the basis of their history of the parameters introduced in previous section. Nodes with high importance in coverage prefer to perform as sensor nodes and therefore do not need to broadcast their routing information, which leads to decreased overall energy consumption.
A sudden drop in the data delivery rate to the sink could be a sign of communication holes in the network. In this case an adaptation message, denoted by RecPacketsink could be broadcasted by the sink. This message indicates a temporary network disconnection state in which the nodes should try to reestablish their connection to the sink. Nodes in this state do not follow the described conditions base on (12) and every node broadcasts its routing information and acts as a communication node. This continues until the data delivery rate to sink is back to normal. This process is done only in the begging of each round, meaning that if the adaption message is received in the middle of the round, the connection reestablishment process starts in next round.
4.2. Phase II: Next Hop Selection
Upon receiving the update information from all neighbors, each node calculates its neighbor's connectivity efficiency to select the next hop in its routing table, as described in (13). 
Similar to most routing algorithms, our method constructs the routing path after a configuration phase. If router dies before the next round starts, routing path will be lost. This issue is critical in K-covered networks where the router's battery drains more rapidly than 1-Covered networks, since the delivered packets to the router is k times bigger.
The formal model of relation between round interval and event occurrence period and degree of coverage has been shown in (13) without considering any data aggregation
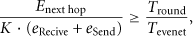

Diagram of proposed method.
4.3. Phase III: Data Communication
After constructing neighborhood tables, each node when it detects an event sends it to next hop in its neighbor table. The selected nodes as next hop send their data over multihop paths to the sink or base station.
5. Experimental Results
This section demonstrates the experimental results of the proposed algorithm. To evaluate the performance of the proposed scheme, some experiments were conducted on various methods. In all the simulations we measure the percentage of the area covered by the sensor nodes over time. We compare our K -Coverage Routing Protocol, named KCRP, with the CPCHSA [26] and EAP [25] protocols as a representative of the energy-aware and coverage persevering protocols. Both algorithms have been compared with classic clustering algorithms LEACH [17] and HEED [19] and make a good balance between network parameters such as connectivity, coverage, and power consuming.
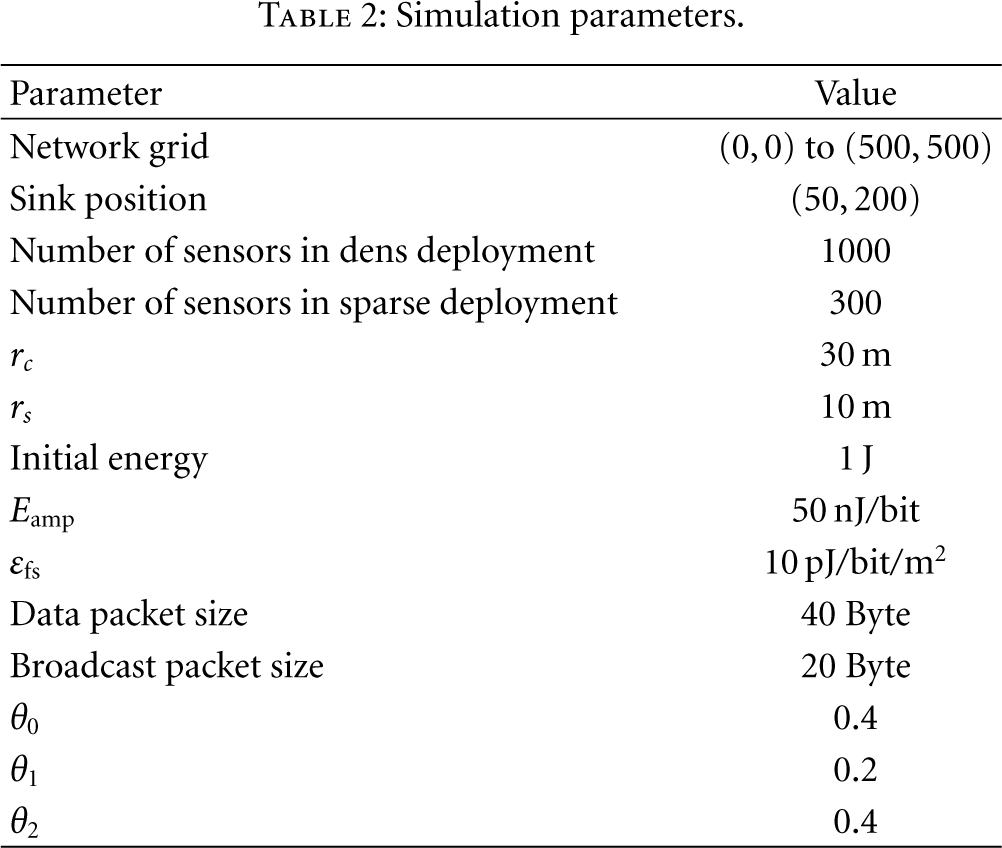
We conduct simulations for a network with 1000 nodes deployed over an area of size
The result is average of twenty different runs based on parameters that have been shown in Table 2.
Simulation parameters.
5.1. Network Coverage
To show network behavior for coverage we calculate average degree of coverage, number of sensors that sensed per mobile object and number of live sensors that are located in event path and have sensed event in event history.
Figure 5 shows the average degree of coverage for 1000 of sensor nodes that deployed randomly in

Degree of coverage for 1000 sensor node.
Figure 6 shows the number of live sensor that detected events, that is, nodes that are located in event path. If this types of nodes have more power they will sense more events in network lifetime. In KCRP the network energy remains in monitoring region more than EAP and the number of sensing nodes still greater than EAP. Figure 6 depicts that number of nodes that are located in event path; as shown in this figure, in KCRP nodes live 50% more than EAP and node lifetimes are two times greater than CPHSA. In CPCHSA because of locating the cluster heads in event path, node's power rapidly depleted from initial time.
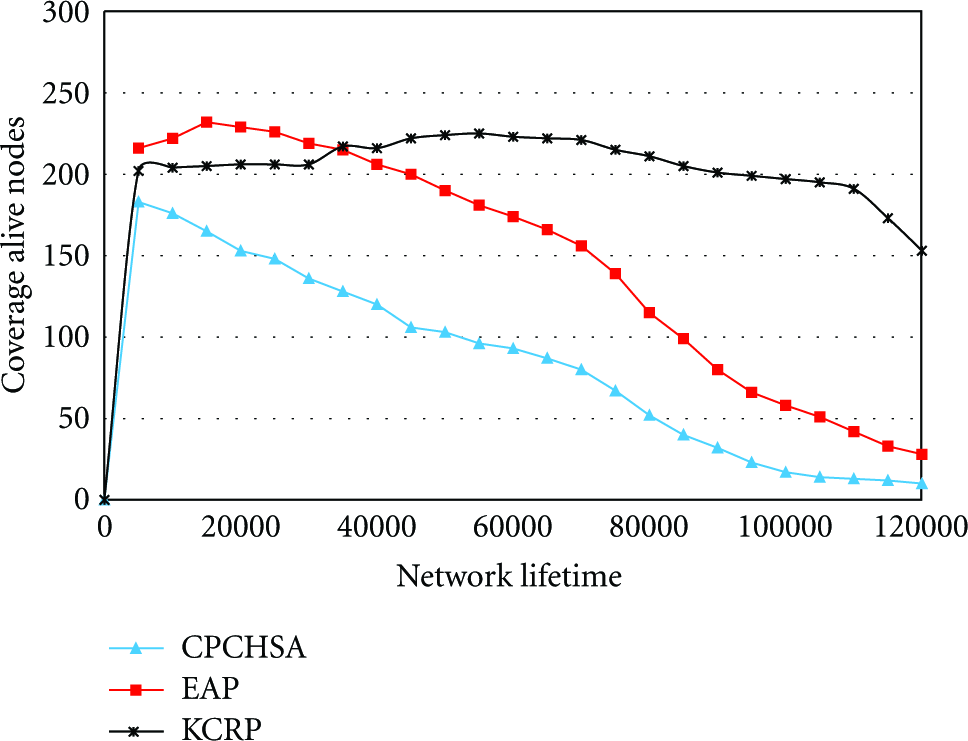
Number of live nodes in event path.
Another parameter that we used to show network coverage behavior is the number of sense counts per mobile object. In our simulation, objects cross the network field during the simulation time. Each object has an ID related by arrival time. When a mobile object passes from the field, some of the sensor nodes detect the object. Number of detections by different sensors has been shown in Figure 7. In Figure 7 there are 600 mobile objects in 1000-node deployed network.
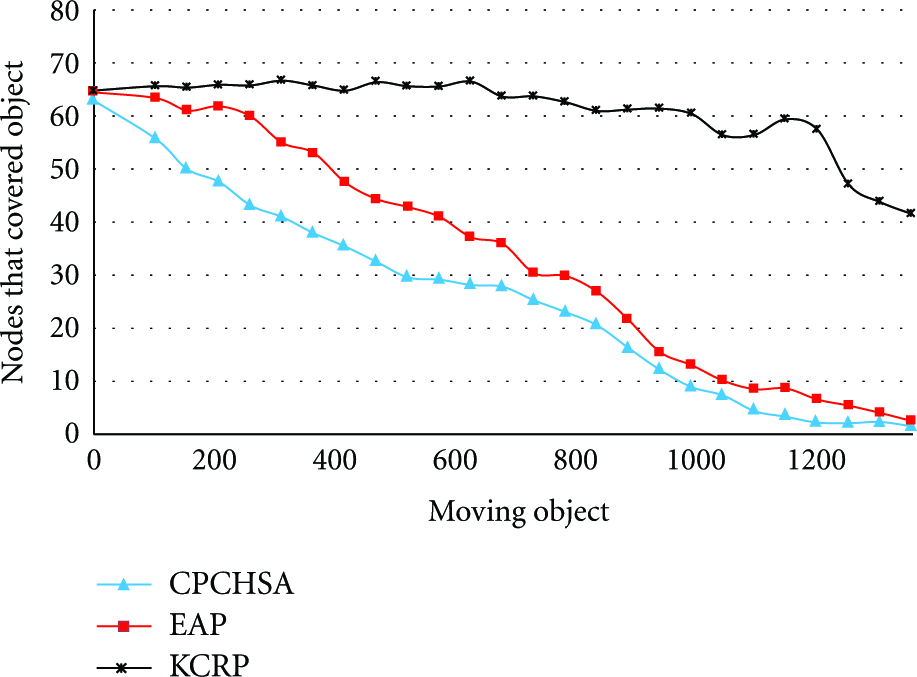
Sense count by different sensor for mobile object in 1000 node deployment.
As like as degree of coverage, in KCRP the objects sensed with more sensor node in network lifetime. As shown in Figure 7, in KCRP, mobile objects have been detected about 5 times more than EAP in last 30% of network lifetime.
In Figure 8 network coverage over time in each method and event path is shown. Mobile objects move alongside the event path. In KCRP, density of nodes around event path is still high, while in EAP and CPCHSA coverage holes have emerged which leads to decreased coverage degree of event path.

Network coverage schema over time, (a) intial state and event path, (b) EAP, (c) CPCHSA, and (d) KCRP.
In early network lifetime EAP is stronger than KCRP in terms of coverage since clusters are uniform in EAP and all events are detected by nodes. In KCRP enough configuration information is not available at these early stages which cause packet delivery failure specially in surrounding areas of the event path.
Similar tests in sparse node distribution lead to similar behavioral results as dense node distribution. Figure 9 depicts the graph of average coverage degree in deployment of 300 nodes. Like dense distribution, KCRP method has an improved coverage degree than EAP and CPCHSA; however because of the small number of nodes in sparse distribution, this improvement is not as noticeable as the dense distribution.

Degree of coverage in 300 nodes deployment.
In Figure 10 number of live covering nodes is displayed for sparse deployment. CPCHSA rapidly loses covering nodes because of inefficient use of energy in event detection. EAP and KCRP show similar behavior in keeping the coverage alongside the event path. CPHSA uses event path nodes as routing nodes that deplete their power.

Number of live covering nodes.
The number of mobile objects detected in sparse mode is depicted in Figure 11. As in the previous experiment, KCRP and EAP method perform better than CPCHSA.

Number of mobile object detection.
In order to evaluate the effect of employing event history, in network coverage, another scenario has been simulated. In this simulation, several event paths are considered, instead of one single path in previous scenarios. Mobile objects randomly travel through these paths at different speeds. The experiment is conducted in two different modes: in the first mode the nodes consider events that are detected in the last round only, while in the second mode, nodes' lifetime is the basis of event history. The network model for this configuration is shown in Figure 12.
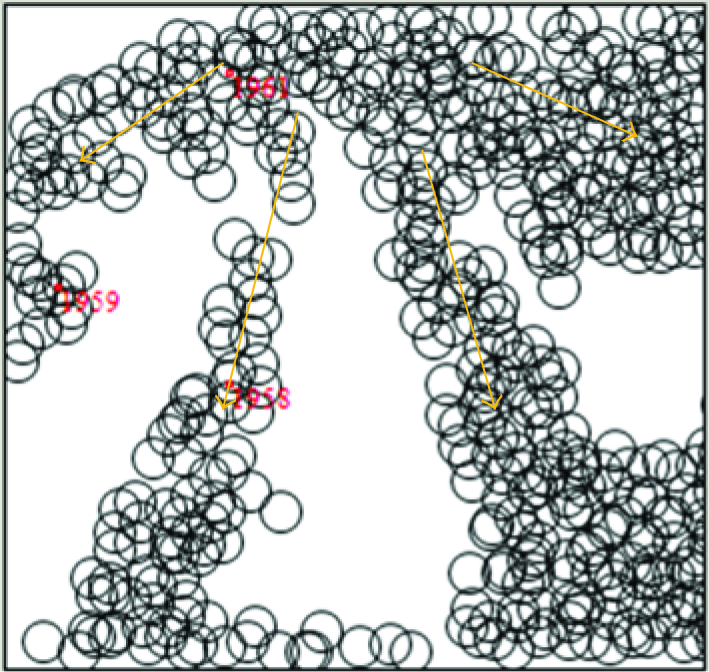
Network with different event path.
Coverage degree for detected events in mentioned modes is displayed in Figure 13. In the lifetime history mode, the degree of coverage is reduced as time passes, in contrast to the first mode in which only the last round is considered for the event history. In Figure 14, mobile object detection is also shown. Similar to the coverage degree graph, here number of detected events in second mode is greater than the first mode. Hence, in the condition where traffic pattern of mobile objects is more varying, selecting shorter history time results in better event coverage performance.

Coverage degree for detected events.

Mobile object detection.
5.2. Network Connectivity
In the previous part, we compared coverage parameters of KCRP method with EAP and CPCHSA. In this part, simulation result for node connectivity is discussed.
Figure 15 shows the packet delivery ratio. In CPCHSA method, the data is directly transferred to base station after being received in cluster head, but in EAP, packets are delivered to base stations in a multihop manner through cluster heads. Since in KCRP method, packets are transferred hop by hop by regular nodes (and not only cluster heads), it has a higher packet loss probability and packet delivery delay in case there are not enough nodes to form a router from covering node to base station.

Packet delivery ratio (1000 nodes deployment).
Packet delivery ratio is relatively high in comparison with other two methods, but as time passes and some nodes die, connectivity holes start to appear in the network which leads to reduction in delivery rate. Considering CPCHSA approach in packet delivery, its delivery ratio is even better than that of EAP.
Although the packet delivery ratio in KCRP is lower than the delivery ratio of the other two approaches, its total number of delivered packets is much higher than EAP and CPCHSA. This is due to the high levels of coverage in KCRP which results in more packet generation. At first glance, it seems that KCRP generated more message that results in more power dissipation and less network lifetime, but in KCRP, nodes in the outside of events path are used for data delivery then the lifetime of nodes in event path is more prolonged comparing other two method. This fact could be observed in Figures 16 and 17. Likewise, EAP delivers more packets than CPCHSA since its total number of generated packets is higher.

Number of generated packets (1000 nodes deployment).

Number of received packets in base station (1000 nodes deployment).
To evaluate the network connectivity status in spars mode, similar experiments are conducted. KCRP success in packet delivery to base stations requires the existence of enough connectivity nodes in order to form a route to base station in every stage of network lifetime. Figure 18 shows the percentage of successful packet delivery ratio. Since in spars mode there are fewer nodes, KCRP delivered 95% of the packets in best case and therefore has performed poorly in comparison with other methods. Due to low event detection occurrence in sparse mode, EAP and CPCHSA have delivered almost 100% of packets during network lifetime.

Packet delivery ratio (300 nodes deployment).
Number of generated packets and delivered packets is shown in Figures 19 and 20, respectively. Like dense deployment, generated packets in KCRP method are still more than other methods but because of lack of enough connectivity nodes, number of delivered packets is lower than EAP in spars mode. However KCRP performs better than CPCHSA.

Number of generated packets (300 nodes deployment).

Number of received packets in base station (300 nodes deployment).
As mentioned previously, KCRP initially tries to route detected events through communication nodes that are located away from event path, and then after these nodes start to run out of power, tries to reform new routing paths using all remaining nodes and not just communication nodes.
Base station monitors packet delivery rate, and in condition when there is a sudden drop, notifies nodes of this event by broadcasting
Figure 21 shows packet delivery rate in base station for KCRP. In this figure, in time 130 a sudden drop occurs and after broadcasting

Packet delivery rate in base station.
Another parameter that should be considered in network connectivity is end-to-end delay. In order to measure this parameter, we used hop count as delay time. KCRP uses a multihop approach for routing and therefore performs weaker than EAP and CPCHSA. EAP transfers packets to base station with an average hop count of five but the hop count in KCRP is higher, as shown in Figure 22. Since CPCHSA transfers packets directly, its hop count is always one. Considering end-to-end delay of these methods, it is clear that CPCHSA is fitter for real-time applications.

Hop count for delivered packets.
Connectivity map for these three methods are displayed in Figures 23, 24, and 25.

Connectivity map for EAP.

Connectivity map for CPCHSA.

Connectivity map for KCRP.
5.3. Power Consumption
The most important challenge in designing WSN protocols is efficient use of energy by sensor nodes. So another parameter is discussed in this paper is the quality of power consumption in KCRP, EAP, and CPCHSA.
In Figure 26 energy consumption chart for various types of nodes in network is depicted. We have identified four types of nodes: covering-only nodes, communication-only nodes, coverage and communication nodes with no data transfer and finally coverage and communication nodes with data transfer.

Power consumption in different types of nodes.
As could be seen in above figure, energy consumption in coverage-only nodes is less than other nodes since they do not participate in data transfer and also they do not broadcast routing information their neighbors. Also, communication-only nodes have the most energy consumption. During network lifetime, connectivity holes start to appear gradually and so in order to reconstruct routing paths, some covering nodes become ready to take part in data transfer by broadcasting routing information to their neighbors; however they might never actually transfer any packets during their lifetime.
Each node has 1 J initial energy, the data packet size is 40 Byte and the energy consumption of transferring data of 1 bit size is 50 nJ. Based on those, we can get the maximum lifetime is
Figure 27 shows total residual energy during network lifetime. Nodes in CPCHSA method, with direct transfer from cluster heads to base station, die more rapidly. EAP method increases communication range of cluster heads to construct its routing paths to base station, which leads to more power consumption. But in KCRP method, covering does not need to participate in routing during most of their lifetime, saving energy for more event occurrence detection. Therefore, KCRP is the strongest method in terms of extending network lifetime while detecting more events than EAP and CPCHSA.

Total residual energy in network.
6. Conclusion
In this paper a novel solution for satisfying K -Coverage of event paths in WSNs was proposed. This method improves the network lifetime by shifting the routing responsibility from covering nodes to communication nodes, while maximizing the degree of coverage in the main path of events. Thus the lifetime of main path coverage is increased as compared to previous methods, EAP and CPCHSA.
The proposed methods compared with EAP and CPCHSA in different issue including network coverage, connectivity, and power consumption. Also various situations such as dens and spars deployment are simulated. Experimental results show the effectiveness of this approach in terms of increasing WSN lifetime and improving coverage along the main path of events.
The proposed routing approach for WSN routings seems to be a promising solution for environment that events occurred in especial patterns. As future work, it is planned to improve our routing approach to be effective in proper WSN settings, including nodes having high mobility. The improved approach will also be studied in network types that include multiple sink nodes.