
Abstract
Natural flow rate and sweet peppers productivity in tropical greenhouse are improved by CFD simulation is the main objective of this research work. Most of the greenhouse types today are in the arch shape. To develop an improved greenhouse structure for the region, the arch type was built and used as the control model. Mae Sar Mai agriculture research station under the royal project foundation was selected as the field test site. Temperature sensors with data logger were installed to monitor variation of temperature inside the greenhouse. The measured temperature data were used as the boundary conditions for the CFD analysis. A new greenhouse model with two-step roof shape was designed and the air flow behavior was simulated by using CFD. Regarding CFD results the air flow rate of the new model is about 39% higher than that of old model. The maximum temperature of the new model is lower than that of the old one. The sweet paper growths in both greenhouse models were measured and compared. Results show that the new model obtains 4°C lower maximum temperature in day time, 97% in number and 90% in weight higher the first grade pepper productivity than the old one.
1. Introduction
During the past decades, several types of greenhouses with different shapes have been used for crop growing in Thailand. These are the Ridge and Furrow, Saw-tooth, Venlo, Quonset, Gothic arch, and Tunnel shapes. Most of them were originally designed and used in the European countries. These models are introduced and constructed in the northern region of Thailand. In the past, most greenhouses can not yield good production as they do in the cool climate countries. Structure configurations have been modified so that they are suitable for the high-land area. Plant production and growth in tropical countries strongly depend on the greenhouse shapes and their dimensions. They also depend on the temperature, humidity, ventilation, solar heat transmission, covering materials, CO2, and so forth [1, 2]. Many research works have been performed to improve their performance by studying natural ventilation inside [3–11]. Few of them studied the temperature, pressure and flow patterns by using the CFD analysis [12–14] and effect from the insect-proof screen installation [7, 15].
Plastic greenhouse is mostly used in the northern region of Thailand because of its low cost, ease of installation, and maintenance. There are some research works that study the plant production in plastic greenhouses [2, 16, 17]. Recently, some works have investigated the micro-climate effect for increasing plant productivity in the greenhouses [18, 19].
The main objective of this study is to redesign the roof shape of a greenhouse for reducing overall inside temperature level. The study employs the CFD analysis simulation to help increasing natural flow rate and sweet pepper productivity. Greenhouse structure is made of steel, covered with plastic sheet, and built at Mae Sa Mai village (900 meters above the sea level) of the royal project, Chiang Mai province in Thailand. Sweet pepper crop is a prospect plant, which grows from April to August. In this paper, the arch-type greenhouse is selected as a controlled model. Ten temperature and relative humidity (T&H) sensors are installed to measure the climate change inside the greenhouse. These measured data are used as the boundary conditions for predicting the internal air flow behavior. To arrive at a design shape of the greenhouse that can provide lower interior temperature, the CFD analysis simulation is used. The new model is designed with two-step roof configuration. Prototypes of the old and new models are constructed and with temperature and humidity sensors installed inside. Sweet pepper nurseries are then moved into these two models. Interior temperature and sweet pepper production of two models are examined and recorded.
2. Materials and Methods
2.1. Greenhouse Configuration and Measurements
Survey of existing greenhouses at Mae Sa Mai village in Chiang Mai province shows that there are four types of greenhouses used. About 80% of them are the arch type, 16% are the Saw-tooth type, 2% are the Quonset type, and 2% are the Ridge and Furrow type. Thus, the arc type greenhouse was selected in this research work. Figure 1 shows the arch-type configuration, which was built at the latitude 18° 52′ North, longitude 98° 51′ East, and 900 meters above the sea level. Its dimensions are 6, 5 and 12 m in length, height and width, respectively. The roof is covered by a plastic with UV filter. An insect screen was installed for all sides and the greenhouse door. Air temperature and relative humidity were measured every 5 minutes using the thermistor sensors and data logger DLT-1 10000 M at the roof, the middle, and on the ground. The data collection system sent all data directly to a data server in Bangkok using GSM/General Packet Radio Service (GPRS) gateway connection. Figure 2 shows locations of the nine sensors inside the greenhouse, with one weather station above roof and one sensor outside the greenhouse. The measurement data were collected during January through August.

Arch-type greenhouse configuration.
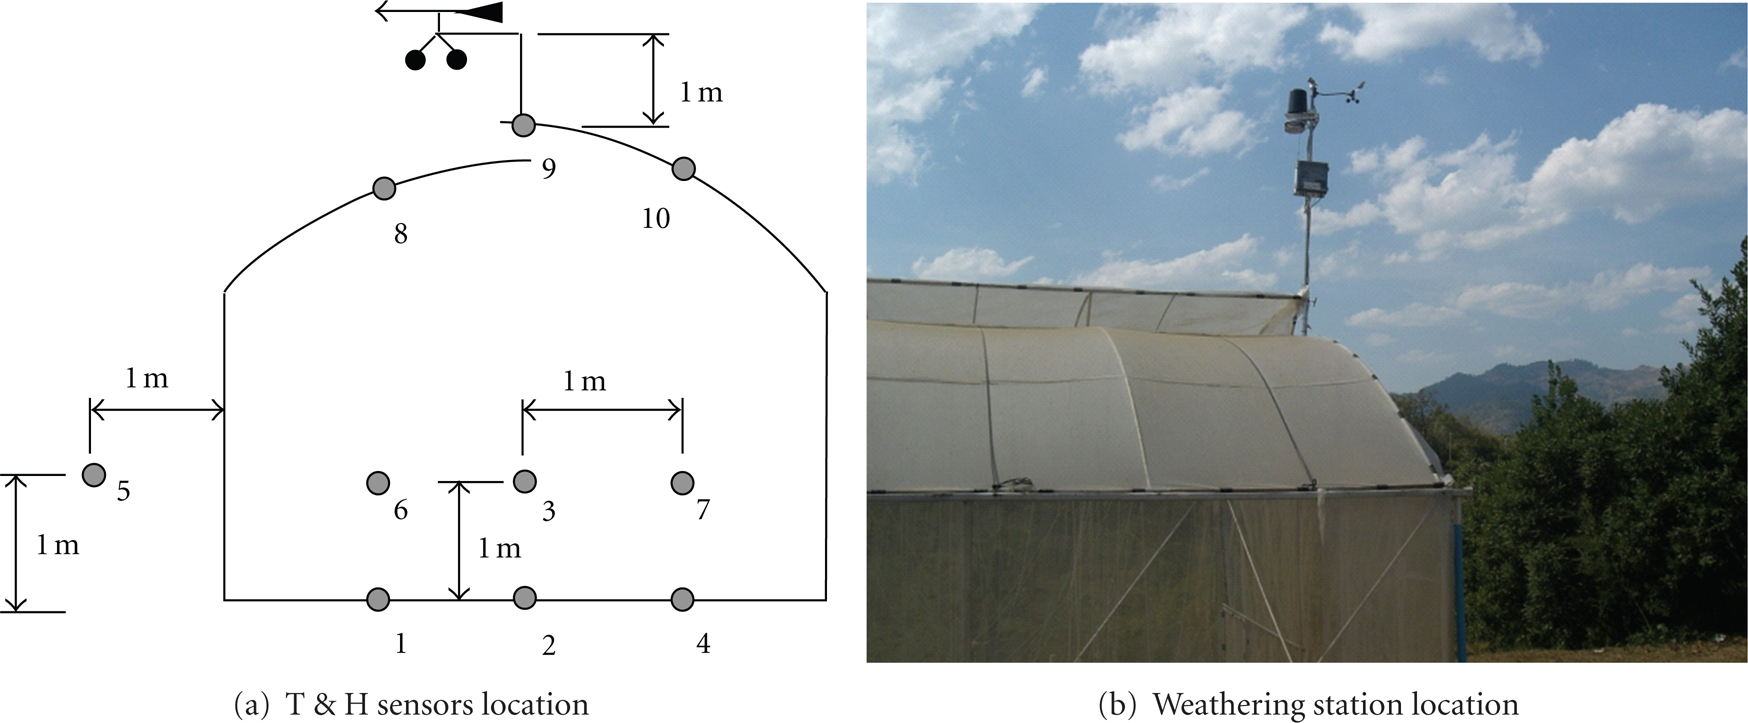
T & H sensors and weathering station location.
2.2. CFD Numerical Model
The commercial CFD software, ANSYS/CFX, was used to generate a mesh model for predicting air flow behavior inside. The air flow behavior is governed by the Reynolds-Averaged Navier-Stokes differential equations in the form

continuity:
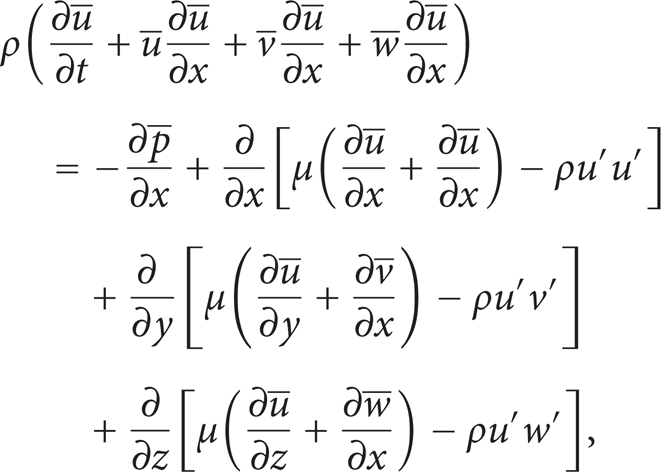


where
Equation (1) represents the conservation of mass, while (2)–(4) are the conservation of momentums in x, y, and z directions, respectively. The last equation, (5), is the conservation of energy. These equations were solved by the finite volume method. The standard k-ε turbulence model was employed to represent the ventilation phenomena [20, 21]. The instantaneous fluid velocity is sum of the mean and fluctuating components of the turbulent velocity. In the standard κ-ε turbulence model, the turbulent viscosity is computed as a function of the turbulent energy (κ) and dissipation rate of the turbulent kinetic energy (ε).
2.3. Computational Procedure
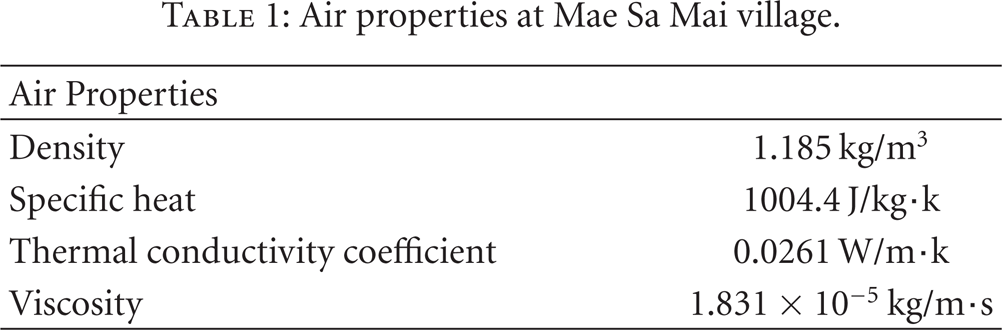
The air properties, as shown in Table 1, are the density at 900 m above the sea level, the specific heat, thermal conductivity coefficient, and viscosity at outside temperature. Boundary conditions were selected from the measure data of temperature sensors. Table 2 shows the average measure data at 2:00 pm on 11 February at the three heights and outside the model. Roof and ground temperatures were used as Dirichlet boundary conditions, while initial temperature was the outside temperature. The external wind speed and direction were measured from the weather station. It is noted that the wind speed is close to zero about 66% during the day time. Natural ventilation condition was selected in the analysis because the airflow outside the greenhouse is near a stagnation condition.
Air properties at Mae Sa Mai village.
Average measured data at different heights on 11 February.

3. Results and Discussion
3.1. Measurement System and Data
The temperature, relative humidity, and wind speed data were collected at every 5 minutes and sent through the GSM/GPRS system as well as recorded on a computer server in Bangkok. The data bank can be accessed online by the internet system. Figure 3 shows the average greenhouse temperature that varies with time during 24 hours on 11 February. The greenhouse started receiving the solar heating at 7 AM, and the heat was accumulated during the day time. Temperature was above 24°C between 9 AM 5 PM. The maximum temperature of about 31°C occurred between 1 and 4 pm. It is noted that the sweet pepper crop is originated from cold regions where suitable temperature is about 24°C during the day time and 17°C during the night time. This data implies that the greenhouse needs better ventilation to release accumulated heat during the day time. In this paper, the greenhouse configuration was redesigned to provide lower temperature. Figure 4 shows the wind chart that represents wind speed and its direction. Maximum wind speed is at 3 km/hr and its direction is 347 NW. The wind speed is near zero about 66% during the day time.
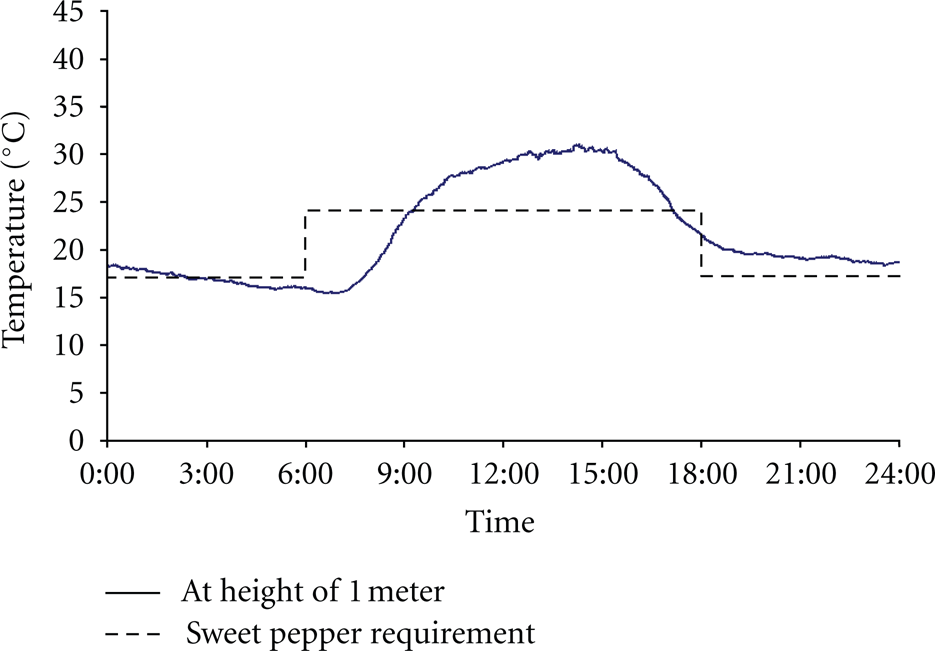
Average temperature of arch-type greenhouse on 11 February.

Wind speeds and directions on 11 February.
3.2. Simulation Results
With the arc-type greenhouse configuration, the CFD analysis for the air flow behavior was performed. CFD mesh is constructed and consists of 11,000 nodes. Figure 5 shows the air flow velocity vectors inside the greenhouse and near the roof opening. Hot air moves upward and flows out from the greenhouse through the roof opening. Because of small opening at roof, there are large circulation under right roof, medium, and small circulation above floor from left to right. Heat is then accumulated all day and increases the temperature level inside the greenhouse. From the CFD result, it is implied that large circulation under right roof is the major factor in heat accumulation inside greenhouse.
Air flow velocity vectors in the arch-type greenhouse.
Figure 6(a) shows the temperature distribution at 1 meter height above the ground as compared to the measured data. The temperatures at different heights were plotted as shown in Figure 6(b). The temperature results are agreed with the measured data. Regarding high temperature problem in greenhouse, the new design does focus on reduction of accumulated heat using CFD.

Comparative temperatures between the simulated and measured data.
Based on this concept the roof opening distance is considered. For the redesign and optimized greenhouse configuration, the two-step roof greenhouse shape was selected as shown in Figure 7. Additional roof or second roof is added above the original roof with higher opening distance. Then redesign model is constructed and generated CFD mesh. CFD analysis is then used to solve flow behavior of redesign GH model. Several redesign models were simulated by using CFD analysis to optimize opening distance. The optimized CFD mesh consists of 14,000 nodes. Grid independence is also considered in all CFD model.

Two-step roof greenhouse configuration.
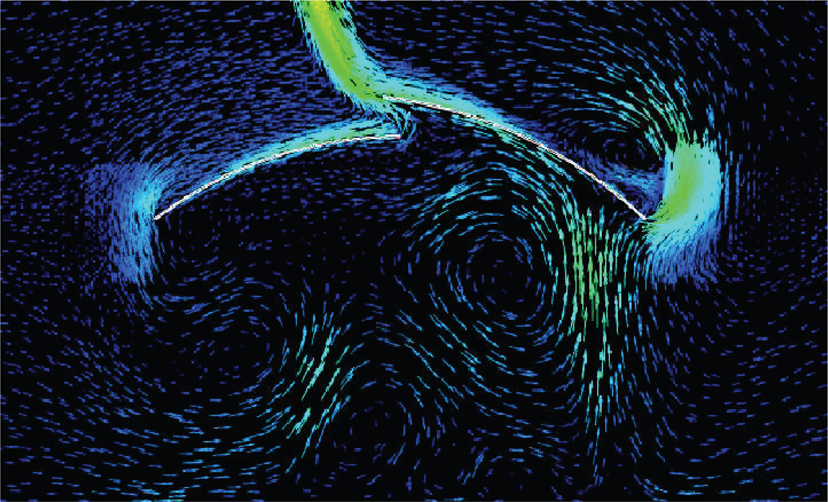
Figure 8 shows the air flow velocity vectors inside and near the roof openings of the new greenhouse shape. Large circulation under right roof in original model is disappeared in redesign model result. At the roof openings, the air flow rate of the redesign model is about 39% higher than that of old model. Temperature at 1 meter height and along the height of the greenhouse were plotted and compared as shown in Figures 6(a) and 6(b), respectively. At 1 meter height, the temperature in the redesign model is lower than that of the old model. The two-step roof model was then constructed and the measurement sensors were installed in the same locations as used in the old model.

Air flow velocity vectors in the two-step roof greenhouse.
Figure 9 shows the comparison of measured temperatures between two models. The redesign model yields a lower temperature than the old model about 4°C during the day time and higher about 1°C during the night time.

Comparative measured temperatures of the two greenhouse models.
3.3. Productivity Results
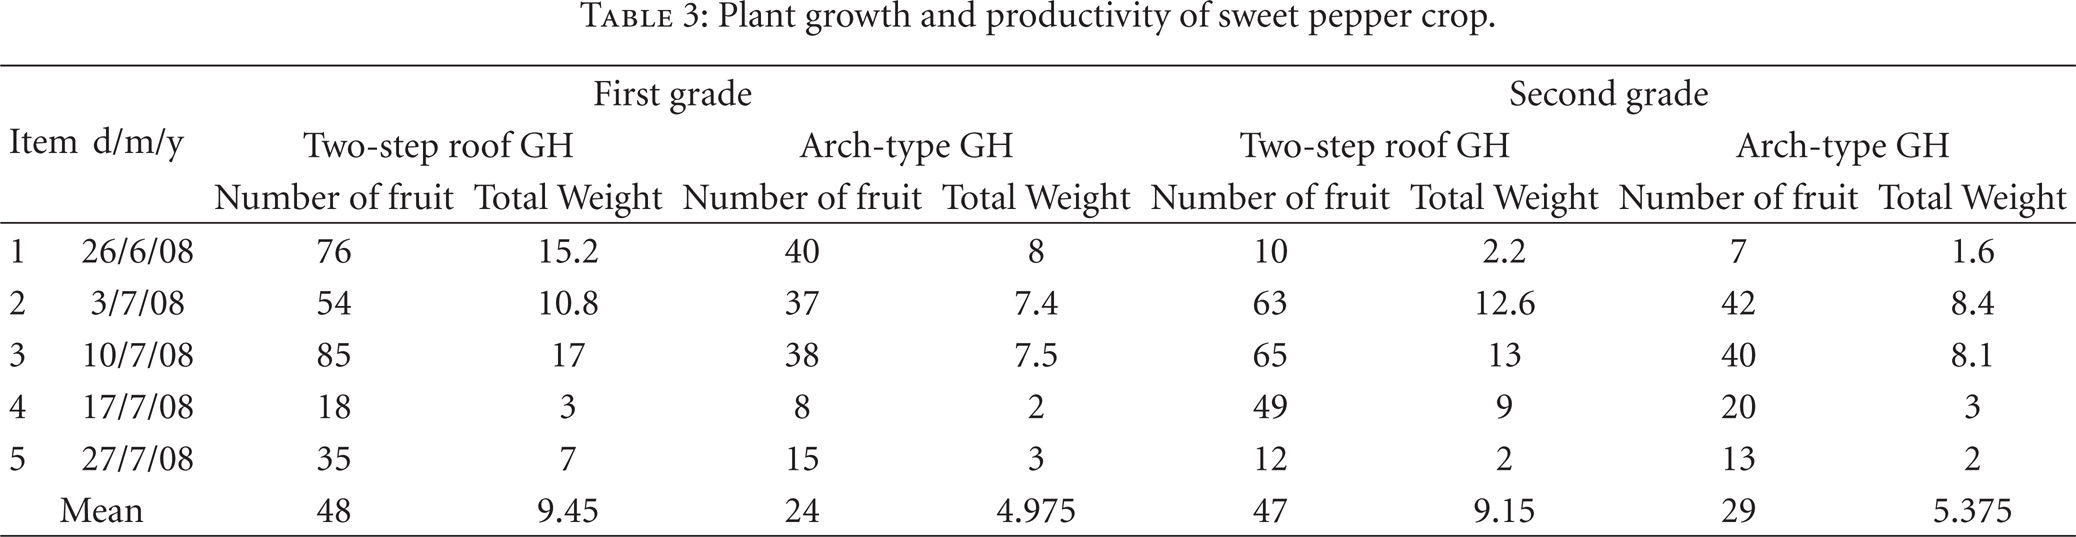
Sweet pepper crop was plant between May and August. In such period, the plant growth and its productivity were collected 5 times as shown in Table 3. Sweet pepper crop is classified in 2 grades. The first-grade is for those with high quality, while the second grade is with fair quality. The first grade productivities obtained from the new two-step roof, and the old models are 97% and 90%, respectively. The second-grade productivities obtained from the two models are 64% and 70%, respectively.
Plant growth and productivity of sweet pepper crop.
4. Concluding Remarks
The CFD simulation is used to enhance natural flow rate and sweet pepper productivity in tropical greenhouses. The CFD technique helped redesigning greenhouse configuration to achieve better ventilation reduce heat storage and temperature inside. The existing and popular greenhouse type, that is, the arch type, at Mae Sa Mai village was selected as the control greenhouse model. The measurement system was installed and the data were transmitted and recorded in a remote server by GSM/GPRS system. A new design configuration with two-step roof was selected. The maximum temperature in new design model is less than that of the old model. At the roof opening section, the air flow rate of new model is 39% higher than that of old model. The two-step roof greenhouse was constructed and a measurement system was installed. Sweet pepper crop was planted inside the old and new models. The maximum temperature measured in the new model is about 4°C less than that of the old model during the day time. The simulated CFD and the measured temperatures are in good agreement. The new design model produced the first-grade sweet pepper productivity about 97% in number and 90% in weight higher than those from the old model. The results have demonstrated the applicability and advantages of the CFD simulation for redesigning the greenhouse configuration to enhance natural flow rate and sweet pepper productivity.
Footnotes
Acknowledgments
The authors are pleased to acknowledge the Thailand Commission on Higher Education of Thailand (the National Research University Project), the National Science and Technology (NRCT), the Thailand Research Fund (TRF), Royal Project Foundation, Thammasat University, and the National Metal and Materials Technology Center (MTEC) for supporting this paper.