We explore the use of a pseudorandom graph family, Borel Cayley graph family, as the network topology with thousands of nodes operating in a packet switching environment. BCGs are known to be an efficient topology in interconnection networks because of their small diameters, short average path lengths, and low-degree connections. However, the application of BCGs is hindered by a lack of size flexibility and fault-tolerant routing. We propose a fault-tolerant routing algorithm for BCGs. Our algorithm exploits the vertex-transitivity property of Borel Cayley graphs and relies on extra information to reflect topology change. Our results show that the proposed method supports good reachability and a small End-to-End delay under various link failures scenarios.
1. Introduction
Various graph-based interconnection networks have been applied to wavelength division multiplexed optical networks [1, 2], distributed parallel computation [3], distributed control [4], satellite constellations [5], chip design [6–9], and wireless sensor networks [10, 11]. In peer-to-peer overlay network schemes, various structure graphs are investigated compared to unstructured P2P overlay network [12]. For the example of structured P2P, k ring lattice is used in Chord [13] and de Bruijn graph is used in Koorde and Distance Halving [14, 15]. Also there are theoretic analyses to apply de Bruin and Cayley graphs to P2P [16, 17].
Deterministic characteristics for connections between nodes in structured graphs allow theoretical analysis and guarantee global properties such as a diameter and average path length [18]. Also graph-based networks can have symmetry, hierarchy, connectivity, and hamiltonicity, which are desired properties comparing random graph-based networks [17, 19].
Borel Cayley graphs (BCGs) have been shown to be efficient candidates for interconnection networks [20]. BCGs are known to have small diameters, average path lengths, and low-degree constant connections. The degree-diameter problem has been investigated in the contexts of interconnection networks [21, 22], wavelength division multiplexed optical networks [23], and VLSI layout design [24]. Also, BCGs are symmetric graphs, a property that enables distributed routing [25]. With consensus protocol [26], distributed node to node message exchange rule to drive nodes to an agreement for a quantity of interest, BCG showed better performance than mesh, torus, and small world networks [27]. Even though BCGs have such favorable properties, there are practical limitations in applying BCGs to networks. One of them is the lack of fault-tolerant routing algorithms: existing BCG routing algorithms do not account for node or communication link failures. Researchers have studied fault-tolerant routing on mesh, toroidal mesh, and de Bruijn graphs [28–30].
In this paper, we present a fault-tolerant routing algorithm for BCG, which accounts for communication link failures. For fault-tolerant routing, the routing tables of nodes are updated distributively in response to link failures. We quantify the performance of the routing algorithm by considering packet reachability and average hop count for different levels of communication link failures. Our simulation results show our proposed method to improve delivery performance by to . We also show packet congestion by proposed algorithms according to packet generation rate. We assume that contention is solved by the MAC layer. Thus, we abstract this case as a graph with point-to-point links and transform the problem into a graph.
This paper is organized as follows. Section 2 reviews basic concepts and definitions for BCGs and related terminology. Section 3 presents our network model and compares BCGs with other known graph topologies. Section 4 presents the data structures used by our proposed routing algorithm for BCGs. Section 5 describes behaviors of the proposed routing algorithm. Section 6 presents simulation results to estimate reachability and the average hop count of our proposed routing algorithm. Conclusions are presented in Section 7.
2. Preliminaries
In the following, we provide a definition of Cayley graphs, Borel subgroup, and Borel Cayley graphs.
A graph is a Cayley graph with vertex set V such that if two nodes are adjacent then for some , where is a finite group and . G is called the generator set of the graph and I is the identity element of the finite group .
The definition of a Cayley Graph requires vertices to be elements of a group but does not specify a particular group.
Definition 2 (Borel subgroup).
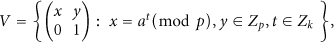
If V is a Borel subgroup of general linear matrices set, then
where a is a fixed parameter , p is prime, and k is the order of a. That is, k is the smallest positive integer such that (mod p).
Let V be a Borel subgroup and let G be a generator set such that , then is a Borel Cayley graph with vertices matrix elements of V. There exists a directed edge from v to u if only only if , where , and * is the modulo-p multiplication chosen as a group operation.
A graph R is a generalized chordal ring (GCR) if nodes of R can be labeled with integers modulo number of nodes N, and there exists a divisor q of N such that node i is connected to node j if and only if node (mod N) is connected to node (mod N).
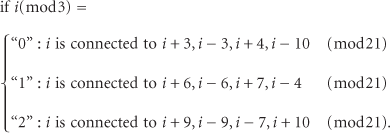
The connection rules of elements are defined by connection constants. Based on Definition 4, connection constants for i and are identical. When the graph is four regular, there are four connection constants. For example, Figure 1 shows a degree 4 GCR with 21 nodes and classes. For and any , the connection rules can be define as
A Borel Cayley graph in the GCR representation with , , , , , , and .
Proposition 5.
For any finite Cayley graph with vertex set V and any such that , there exists a GCR representation of C with divisor , where I is the identity element.
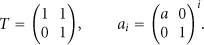
The proof of these propositions is given in [20] and not repeated here. T is referred to as the transform element. are class representing elements.
For simplicity of the GCR representation, we chose T and as follows [20]:
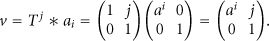
Any vertex is represented with T and as follows [20]:
BCGs are defined over a group of matrices. The systematic representation of BCGs from the group domain to the integer domain is useful for routing because nodes are defined in the integer domain and the integer domain provides a systematic description of connections. The node ID representation in GCR () is denoted as follows [20]:
Symmetry or vertex transitivity is a preferable attribute for an efficient interconnection network topology. Informally, a symmetric or vertex-transitive graph looks the same from any node. This property allows to use an identical routing table at every node. Mathematically, this implies that for any two nodes a and b in the graph there exists an automorphism of the graph that maps a to b. This property is very useful for practical implementation of interconnection networks. Most of the well-known interconnection graphs, such as the toroidal mesh, hypercube, and cube-connected cycle, exhibit this property.
Every Cayley graphs can be represented with integer node labels through a transformation into a generalized chordal ring topology. However, generally speaking, GCR graphs are not fully symmetric. In [20], the authors provide a framework for the formulation of the complete symmetry (or vertex transitivity) of Cayley graphs in the integer domain of GCR representations.
Proposition 7.
Assume a Borel Cayley graph in the GCR representation with transform element and representing elements of each class i as . Let , and . If i is connected to j with a sequence of generators, then is connected to with the same sequence of generators, where [25].
Algorithm 1 shows Vertex-transitive routing (VT routing) algorithm that exploits the inherent symmetry of Cayley graphs and uses the identical routing table at any node [25].
Algorithm 1: Vertex-transitive routing algorithm for Borel Cayley graphs.
For a degree-4 Borel Cayley graph in the GCR representation with and ,
we have classes, where (mod p). Assume the generators to be , , and , where
.
Given the source and the destination .
While ()
Step 1: Identify new destination,
,
where signifies the operation within the bracket is modulo p.
Step 2: From row of a precalculated routing table, determine which link to take.
Step 3: Identify new source, and
, , if link was chosen
, , if link was chosen
, , if link was chosen
, , if link was chosen
Step 4: and
3. Topology Comparison
3.1. Network Model
A network that consists of a set of nodes is connected by full duplex point-to-point links. The node model is depicted in Figure 2. Each node consists of an input queue for transit messages (), a packet generator, a switching fabric, and an output queue. Modules inside a node are connected by zero delay links. It takes a single time unit for a packet to move from an output queue to an input queue. Time is slotted and synchronized so that all nodes receive and transmit packets simultaneously.
Node model.
An input queue is FIFO served. In each time slot, the input queue accepts up to the number of packets, the degree of a node in the same time slot. Depending on the model, the input buffer size ranges from one to infinity. The output buffer size is one. The packet arrival module removes packets from the input queue if the current node is the destination node. The switching fabric determines the next node of the packet taken from the input queue by a routing algorithm. Every node in the network can be a source, a destination, or a relay. We assume that nodes generate information at a constant average rate of R packets per time slot (Packet generator).
Three traffic patterns are considered in this paper: All-to-All traffic pattern (Pattern ), All-to-one traffic pattern (Pattern ), and All-to-M traffic pattern (Pattern ). In Pattern , all nodes are the source and destination nodes, which generate packets to uniformly randomly selected destination node. The probability of any source node communicating to any destination node in the network is constant and equal to where n is the number of destination nodes. In Pattern , nodes send packets to node , the only destination node. That is, the one node (sink) gathers the information generated by all other nodes in the network [31]. In Pattern , nodes send packets to a group of nodes, of the total nodes in this case. This network model depicts a situation arising in integrated devices. Nodes located on the borders can be connected to high-capacity transmission lines.
3.2. Topologies
Toroidal mesh networks and de Bruijn graphs are popular topologies for interconnection networks [1, 5, 16]. In the following, we provide a definition for toroidal mesh networks and de Bruijn graphs. Then we show simulation results comparing Borel Cayley graphs with the aforementioned traffic patterns.
3.2.1. Toroidal Mesh Network
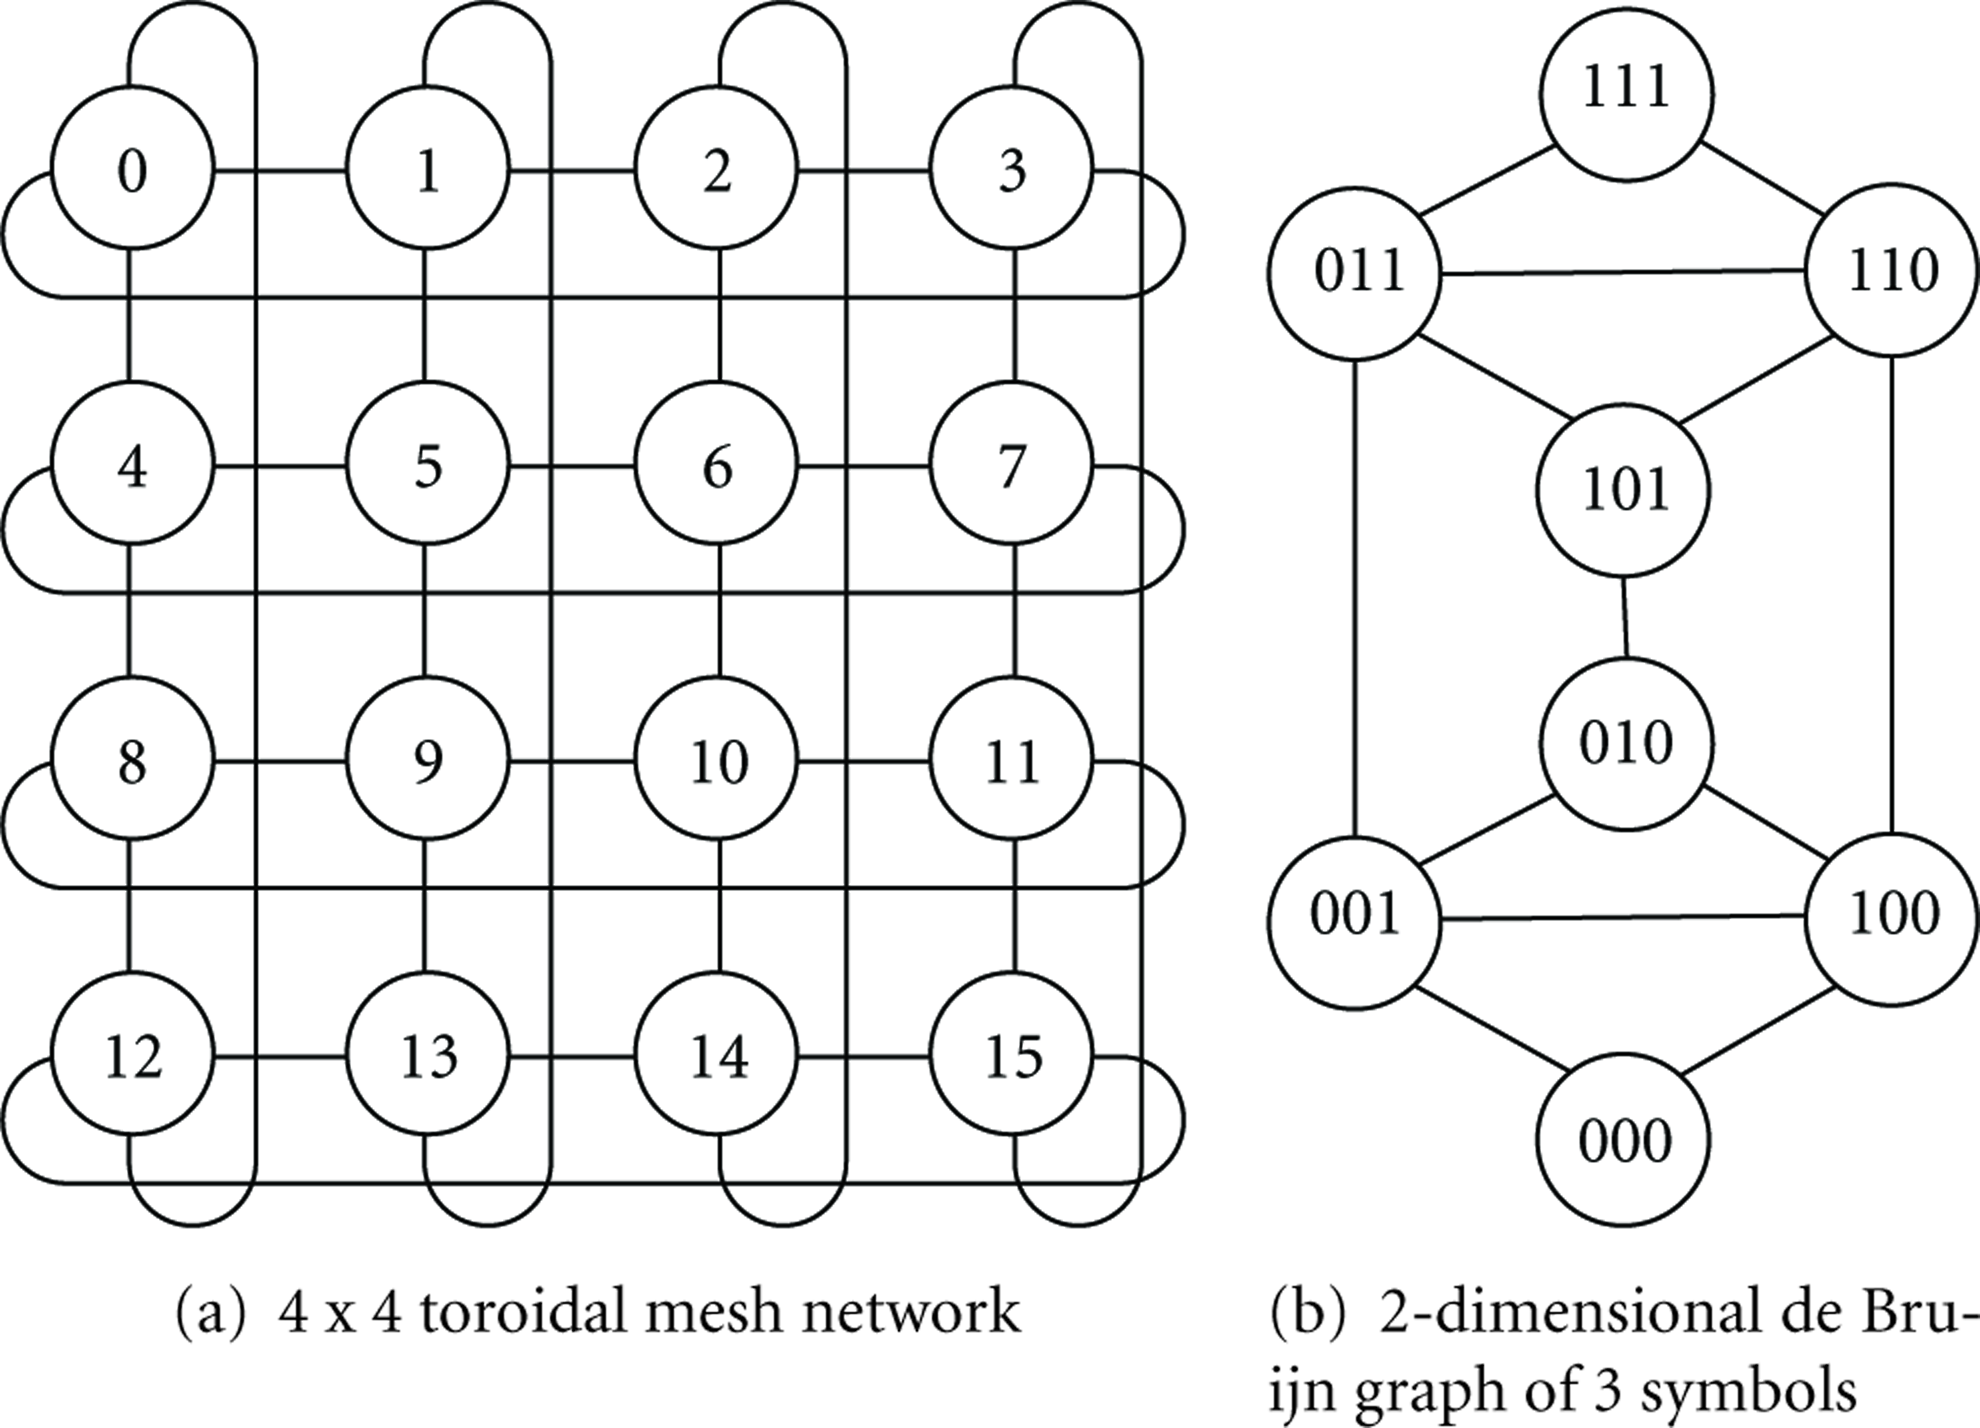
Figure 3(a) shows a toroidal mesh network (torus) which consists of R rows by C columns. When a node is represented by , neighboring nodes are defined as follows: , , , and . We use a Greedy row-first routing algorithm on the torus mesh network. If a packet is not in the destination column, then the packet is routed along the row towards the destination column. Otherwise the packet is routed along the column toward the destination node [32].
Toroidal mesh network and de Bruijn graph.
3.2.2. De Bruijn
The undirected de Bruijn graph (UDB) has nodes of degree [1]. We use binary de Bruijn graphs of nodes. A node of the network with binary address has neighbors: , , , and . Figure 3(b) shows an undirected de Bruijn graph for and where self-loops are removed.
Algorithm 2 corresponds to the routing algorithm for UDB. The routing algorithm consists of transmitting a packet to either its left or right neighbors [33]. Algorithm 2 defines the Forward Path (FP) as the path taken by a packet when a left neighbor is chosen as the next node and the Backward Path (BP) when a right neighbor is chosen. From de Bruijn graph's properties, it is easy to calculate the number of hops that it needs to reach the destination using FP or BP. This is done by matching the postfix portion of the source address with the prefix portion of the destination address. The more digits are matched; the shorter is the path between source and destination. For example, in Figure 3(b), assume node needs to transmit a packet to node . Since is the postfix of the source and the prefix of the destination, node will reach node in one hop. In [33], it defined to be an operation which returns the number of hops required to reach the destination along a FP. Similarly, returns the number of hops along a BP.
Algorithm 2: Undirected de Bruijn graph routing algorithm.
(1) procedure Routing Algorithm For UDB (cur, dst) cur: the current node, dst: the destination node
(2)
(3)
(4) ifthen
(5) using FP sent to the particular left neighbor
(6) else ifthen
(7) randomly using FP or BP
(8) else
(9) using BP sent to the particular right neighbor
(10) end if
(11) end procedure
3.2.3. Performance Comparison
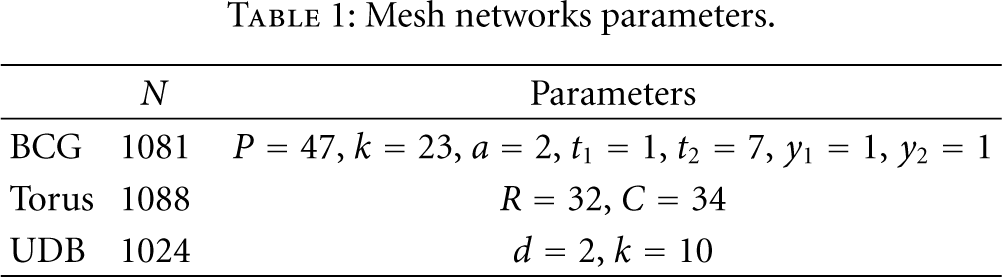
The parameters for the mesh networks we used for performance comparison are described in Table 1. BCG and Torus are degree graphs. Most nodes of have degree except the few nodes, with self-loops. Table 2 shows our benchmark mesh networks topological properties such as the diameter and the average path length. The diameter is the greatest distance between any two nodes. The average path length is the average number of edges between all possible node pairs. Constrained by degree , BCG has the smallest diameter and the shortest average path length.
Mesh networks parameters.
N
Parameters
BCG
1081
, , , , , ,
Torus
1088
,
UDB
1024
,
Static Property.
AVG. path length
Diameter
BCG
5.54
7
Torus
16.52
33
UDB
6.77
10
We also considered the performance of our network models. We used two metrics for comparison: (a) End-to-End delay and (b) reachability. We define End-to-End delay as the time required by packets to travel from a source to a destination and the reachability as the number of packets reaching destination over the number of generated packets. When running our simulations, we used the three types of traffic patterns presented in 3.1. We set the input buffer length to infinite, , and . Our simulation running time is ticks.
Figure 4 shows End-to-End delay (ETE delay) as a function of packet generation rate for our three traffic patterns. BCG exhibits the smallest End-to-End delay across all traffic patterns. Each network shows that End-to-End delay increases rapidly above a certain traffic generation rate called traffic congestion point. An efficient network topology should consider both End-to-End delay and network saturation. BCG shows a small End-to-End delay and a more robust traffic congestion point than UDB and Torus.
End-to-End delay with infinite buffer.
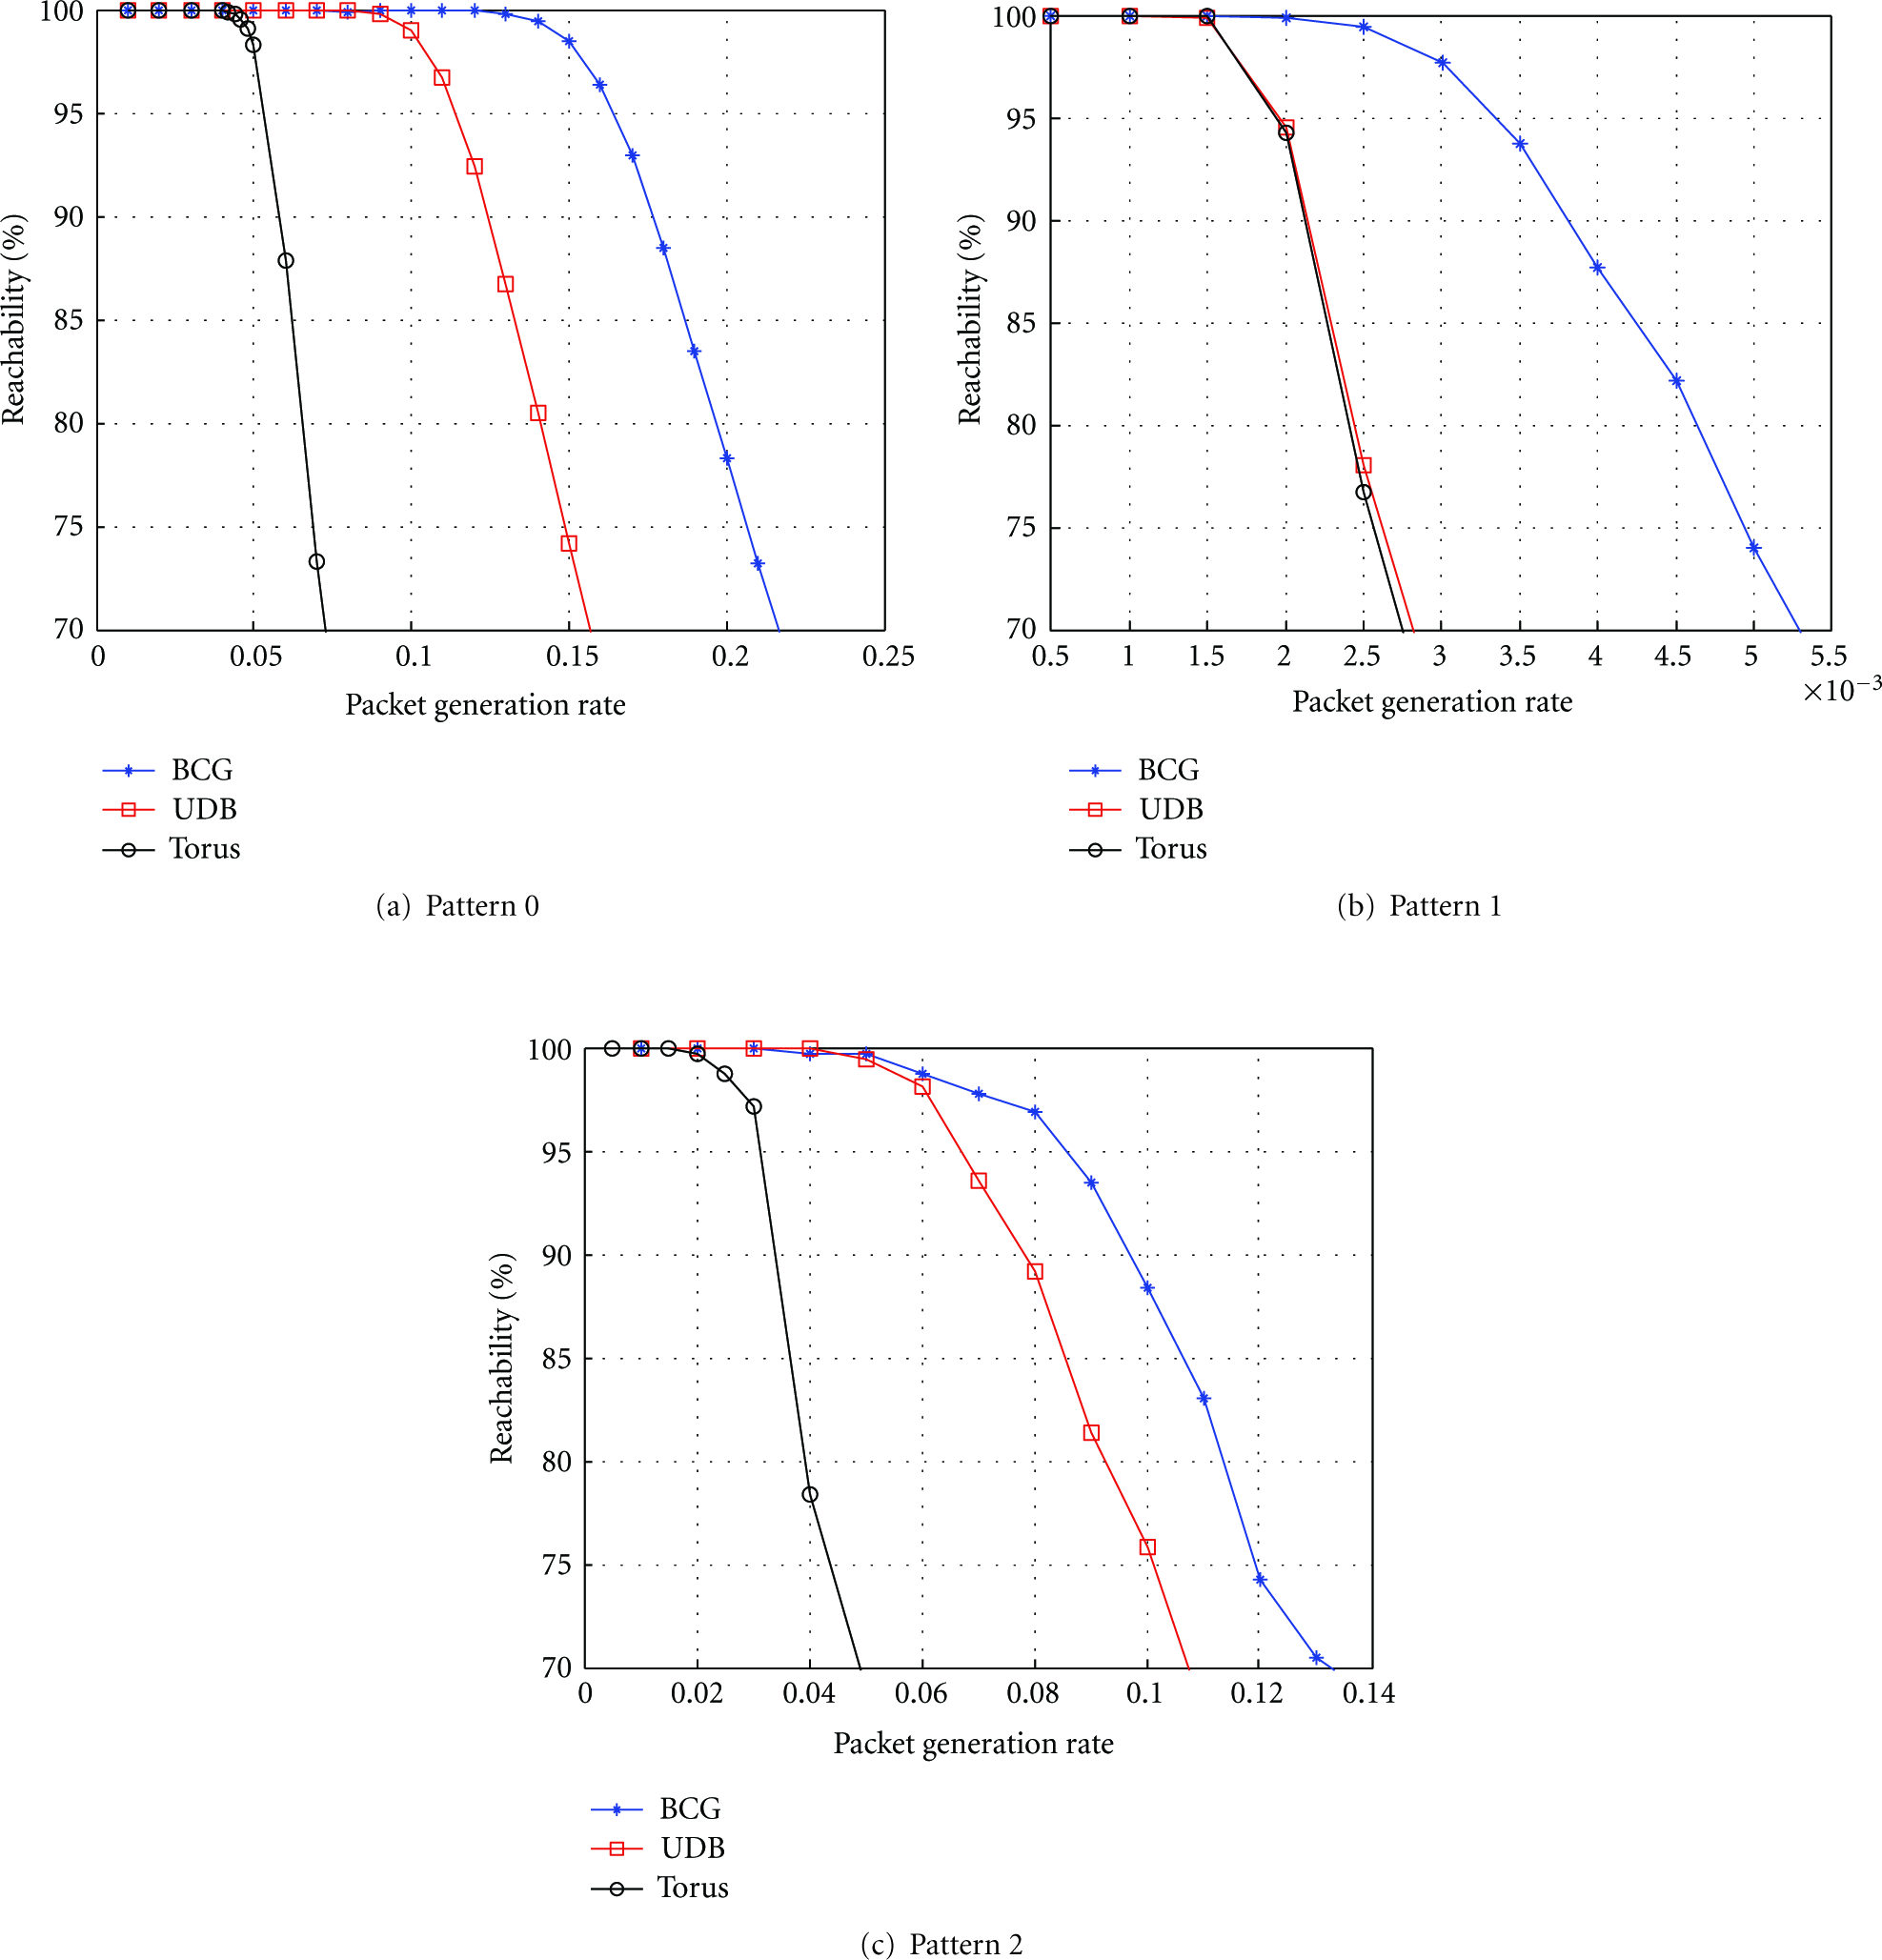
When a buffer at each node is finite, packets can be overflowed for large packet generation rates and thus reachability is not achieved as . Figures 5 and 6 show reachabilities with buffer length and , respectively. Reachability with finite buffer decreases above certain packet generation rate. Decreasing reachability packet generation rate of BCG is larger than others even though they have almost the same number of nodes and edges. UDB and Torus show similar reachabilities with traffic pattern because End-to-End delays of traffic pattern increase rapidly together at the similar packet generation rate.
Reachability with buffer length .
Reachability with buffer length .
4. Data Structure of Exhaustive Routing
A conventional routing algorithm for Borel Cayley graphs, Vertex-transitive routing, exploits the graphs vertex-transitive property. That property allows to use an identical routing table in every node. The routing table is created for node only; and for other nodes to use that table, a simple node ID translation is applied to the destination node ID. The Vertex-transitive routing algorithm guarantees the shortest path between any source-destination pair. However, Vertex-transitive routing only applies to a static network and cannot account for node/link failures. The goal of our proposed routing algorithm (Exhaustive routing) is to route messages in the presence of link failures.
Exhaustive routing has two phases. In Phase , packets are routed through the shortest path according to the Static Routing Table. If there is a link failure making the shortest path unavailable, a Dynamic Routing Table for Type packets is updated and other shortest paths (following the Static Routing Table) will be used. However, when all shortest paths from the BCG are disconnected, there can still be a path between the source and destination. In that case, Phase of Exhaustive routing is used.
Phase exploits the path length information in the Static Routing Table to search for possible routes besides the shortest paths from BCG. A Dynamic Routing Table for Type packets is created to indicate “next best” paths as well as any unusable link due to failures. Basically, in Phase , packets are routed according to the path length information and update unusable links in the Dynamic Routing Table.
We define two types of routing tables according to whether or not the table changes in response to link failures: (a) a Static Routing Table and (b) a Dynamic Routing Table. The following provides a more detailed description of the two types of routing tables.
4.1. Static Routing Table
The Static Routing Table is pre-calculated and identical across all nodes. The Static Routing Table is defined for a reference source node, node . Each time a message needs to be routed from a node different than node . So the destination ID is mapped from absolute ID (Global ID of the destination in a network) to relative ID (ID of the destination in the view of the current node regarded as a reference node) as follows, referring to Algorithm 1:
where the current node's absolute ID is , the destination node's absolute ID is , and is the relative destination ID. We denote the absolute ID of node u by and the relative ID of node u at node v by . Row indexes of Static Routing Table are relative IDs.
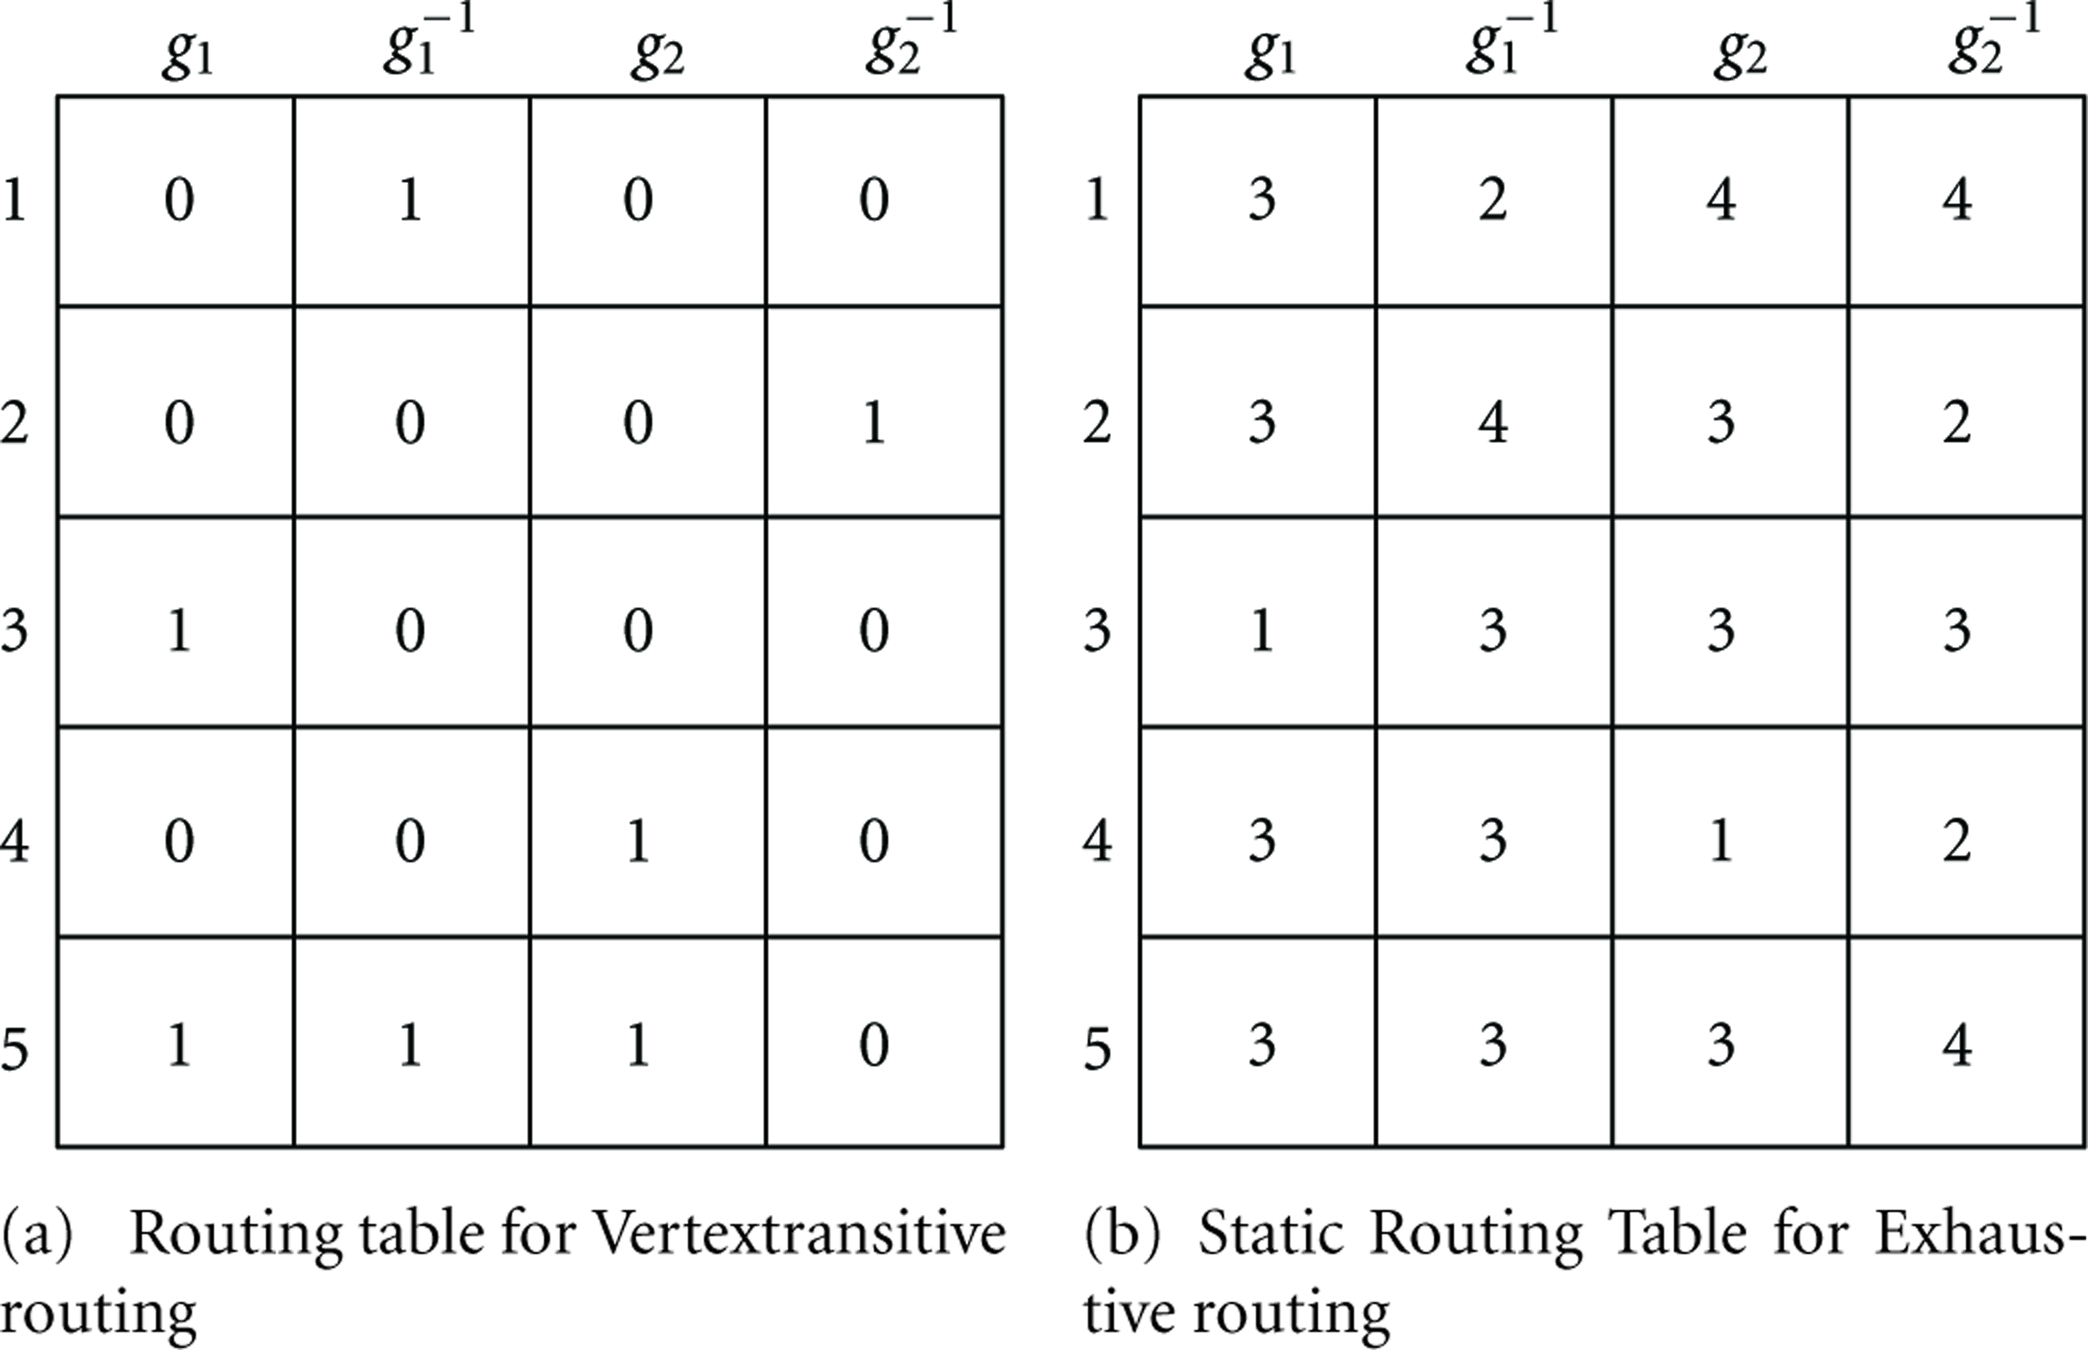
The number of rows in the Static Routing Table is the number of nodes minus one and the number of columns is the number of generators (nodal degree). In Figure 7(a), a number in the routing table for Vertex-transitive routing indicates the shortest path through that generator link. For instance, for the relative destination ID , the shortest path at node u is through generator .
Original vertex-transitive routing table and Static Routing Table of BCG in Figure 1. Note that some parts of routing tables are omitted for brevity.
The Static Routing Table for Exhaustive routing (SRTBL) includes the shortest path lengths to destination through an indicated generator. The shortest path lengths are calculated from Dijkstra's algorithm [34]. The first row of the Vertex-transitive routing table in Figure 7(a) shows an entry of in the generator cell. On the other hand, in the first row of SRTBL in Figure 7(b), the shortest path is though generator and is two hops away from destination. If we choose the generator not , it would take four hops to reach destination. We denote the routing data to node v from node u by SRTBL and the hop count through generator g from node u to node v by . For example, SRTBL and SRTBL.
4.2. Dynamic Routing Table
The Dynamic Routing Table (DRTBL) is generated or updated based on route availability. From the contents of a received packet, a node can determine whether or not certain shortest path links are no longer available. We will explain how to determine when links are no longer available in Section 5. DRTBL is generated for each destination node, hence the size of DRTBL will vary. For example, node u detects that the link for node v is no longer available. If there is no DRTBL for node v, node u generates a new DRTBL for node v. Otherwise, it sets the link to zero in existing DRTBL for node v. DRTBLs are unique at each node. So the relative ID is no longer needed. The index of DRTBL is the absolute ID. We denote routing data for node v at node u by and data indicated by generator g for node v at node u by .
The Exhaustive routing algorithm has two phases during which Type and Type packets are forwarded in the first phase and the second phase, respectively. We denote DRTBL for Type packets by D1RTBL and DRTBL for Type packets by D2RTBL. Table 3 summarizes routing tables for Exhaustive routing.
Summary of routing tables for Exhaustive routing.
SRTBL
Precalculated
Data are not changed
Data are path lengths via generator
For Phase 1 and Phase 2
D1RTBL
Generated dynamically
D2RTBL
Data are bits indicating the available links
Data are updated when node/link failures occur
D1RTBL
For Phase 1
Initialized with data indicating shortest path links
D2RTBL
For Phase 2
Initialized with data indicating all links are to be explored
5. Phases of Exhaustive Routing
5.1. Phase 1
Phase of Exhaustive routing exploits all the shortest paths extracted from BCG with SRTLB and D1RTBL.
5.1.1. Forwarding Rule of Phase 1
In Phase of Exhaustive routing, the goal of forwarding a packet is to identify links corresponding to the shortest paths for the destination in SRTBL. Then packets are forwarded to a randomly selected link among the identified shortest path links. When a node can no longer forward a packet using the SRTBL, the shortest path links are disconnected, and the node forwards the packet to the previous node using the packet's Path history. Path history is an ordered list of nodes traversed by the packet being routed. The Path history is included in the Packet frame as follows:
5.1.2. Generating Dynamic Routing Table of Phase 1
Once a node receives a packet, it uses the Path history of the packet to determine whether or not the packet is a returned packet. If the node ID is found at the position before the last in the Path history, the received packet is a returned packet. When a node receives a returned packet, its D1RTBL is generated or updated. The SRTBL consists of path lengths via each generator. The links in SRTBL with smallest cell for a given are used. For example, in Figure 7(b), when node a determines the packet whose destination is node b () is a returned packet via generator ; it generates the D1RTBL for node b. we get D1RTBL since the smallest number is in the SRTBL. It sets the entry indicated by generator to zero. Finally, node a has D1RTBL.
The generator link used by a returned packet is set to zero in the D1RTBL. Upon receiving a returned packet, if another shortest path exits (D1RTBL entry for the destination is ), the node forwards the packet to a node indicated by the generator link. Otherwise the node removes the last node ID from the Path history and forwards the packet to the previous node. If the packet goes back all the way to the source node and the source node does not have any shortest path to the destination from D1RTBL, the node changes the packet type from Type to Type . Phase of Exhaustive routing supports routing delivery as long as there is at least one shortest path extracted from BCG. Algorithm 3 shows Phase of our Exhaustive routing algorithm.
Algorithm 3: Phase 1 of Exhaustive routing.
(1) procedure Packet forwarding ()
(2) ifthen: destination of packet
(3) Packet delivery is successful : node ID of current node
(4) Return
(5) end if
(6) if is a returned packet Table then
(7) Update Dynamic Routing Table Case: node in path history
(8) end if
(9) if Dynamic Routing Table then
(10) if There is an available link in row of destination in Dynamic Routing Table then
(11) Forward the packet to randomly selected available generator link in Dynamic Routing Table
(12) Return
(13) else ifthen
(14) Change a type of from Type to Type There is no available shortest path from BCG
(15) Go to Phase of Exhaustive routing
(16) else
(17) Update Path history and forward the packet to the previous node
(18) end if
(19) else if Row of destination in Static Routing Table then
(20) Forward the packet to randomly selected available generator link, which has the smallest path length within the
same row, in Static Routing Table
(21) Return
(22) end if
(23) end procedure
5.2. Phase 2
Table generation rules and packet forwarding rules for Type and Type packets are different. A Type packet returns to source when there is no shortest path within D1RTBL. Then the source node changes the packet type from Type to Type . The Type packet is forwarded via a communication link having the smallest value in the SRTBL when a node does not have a D2RTBL of the destination.
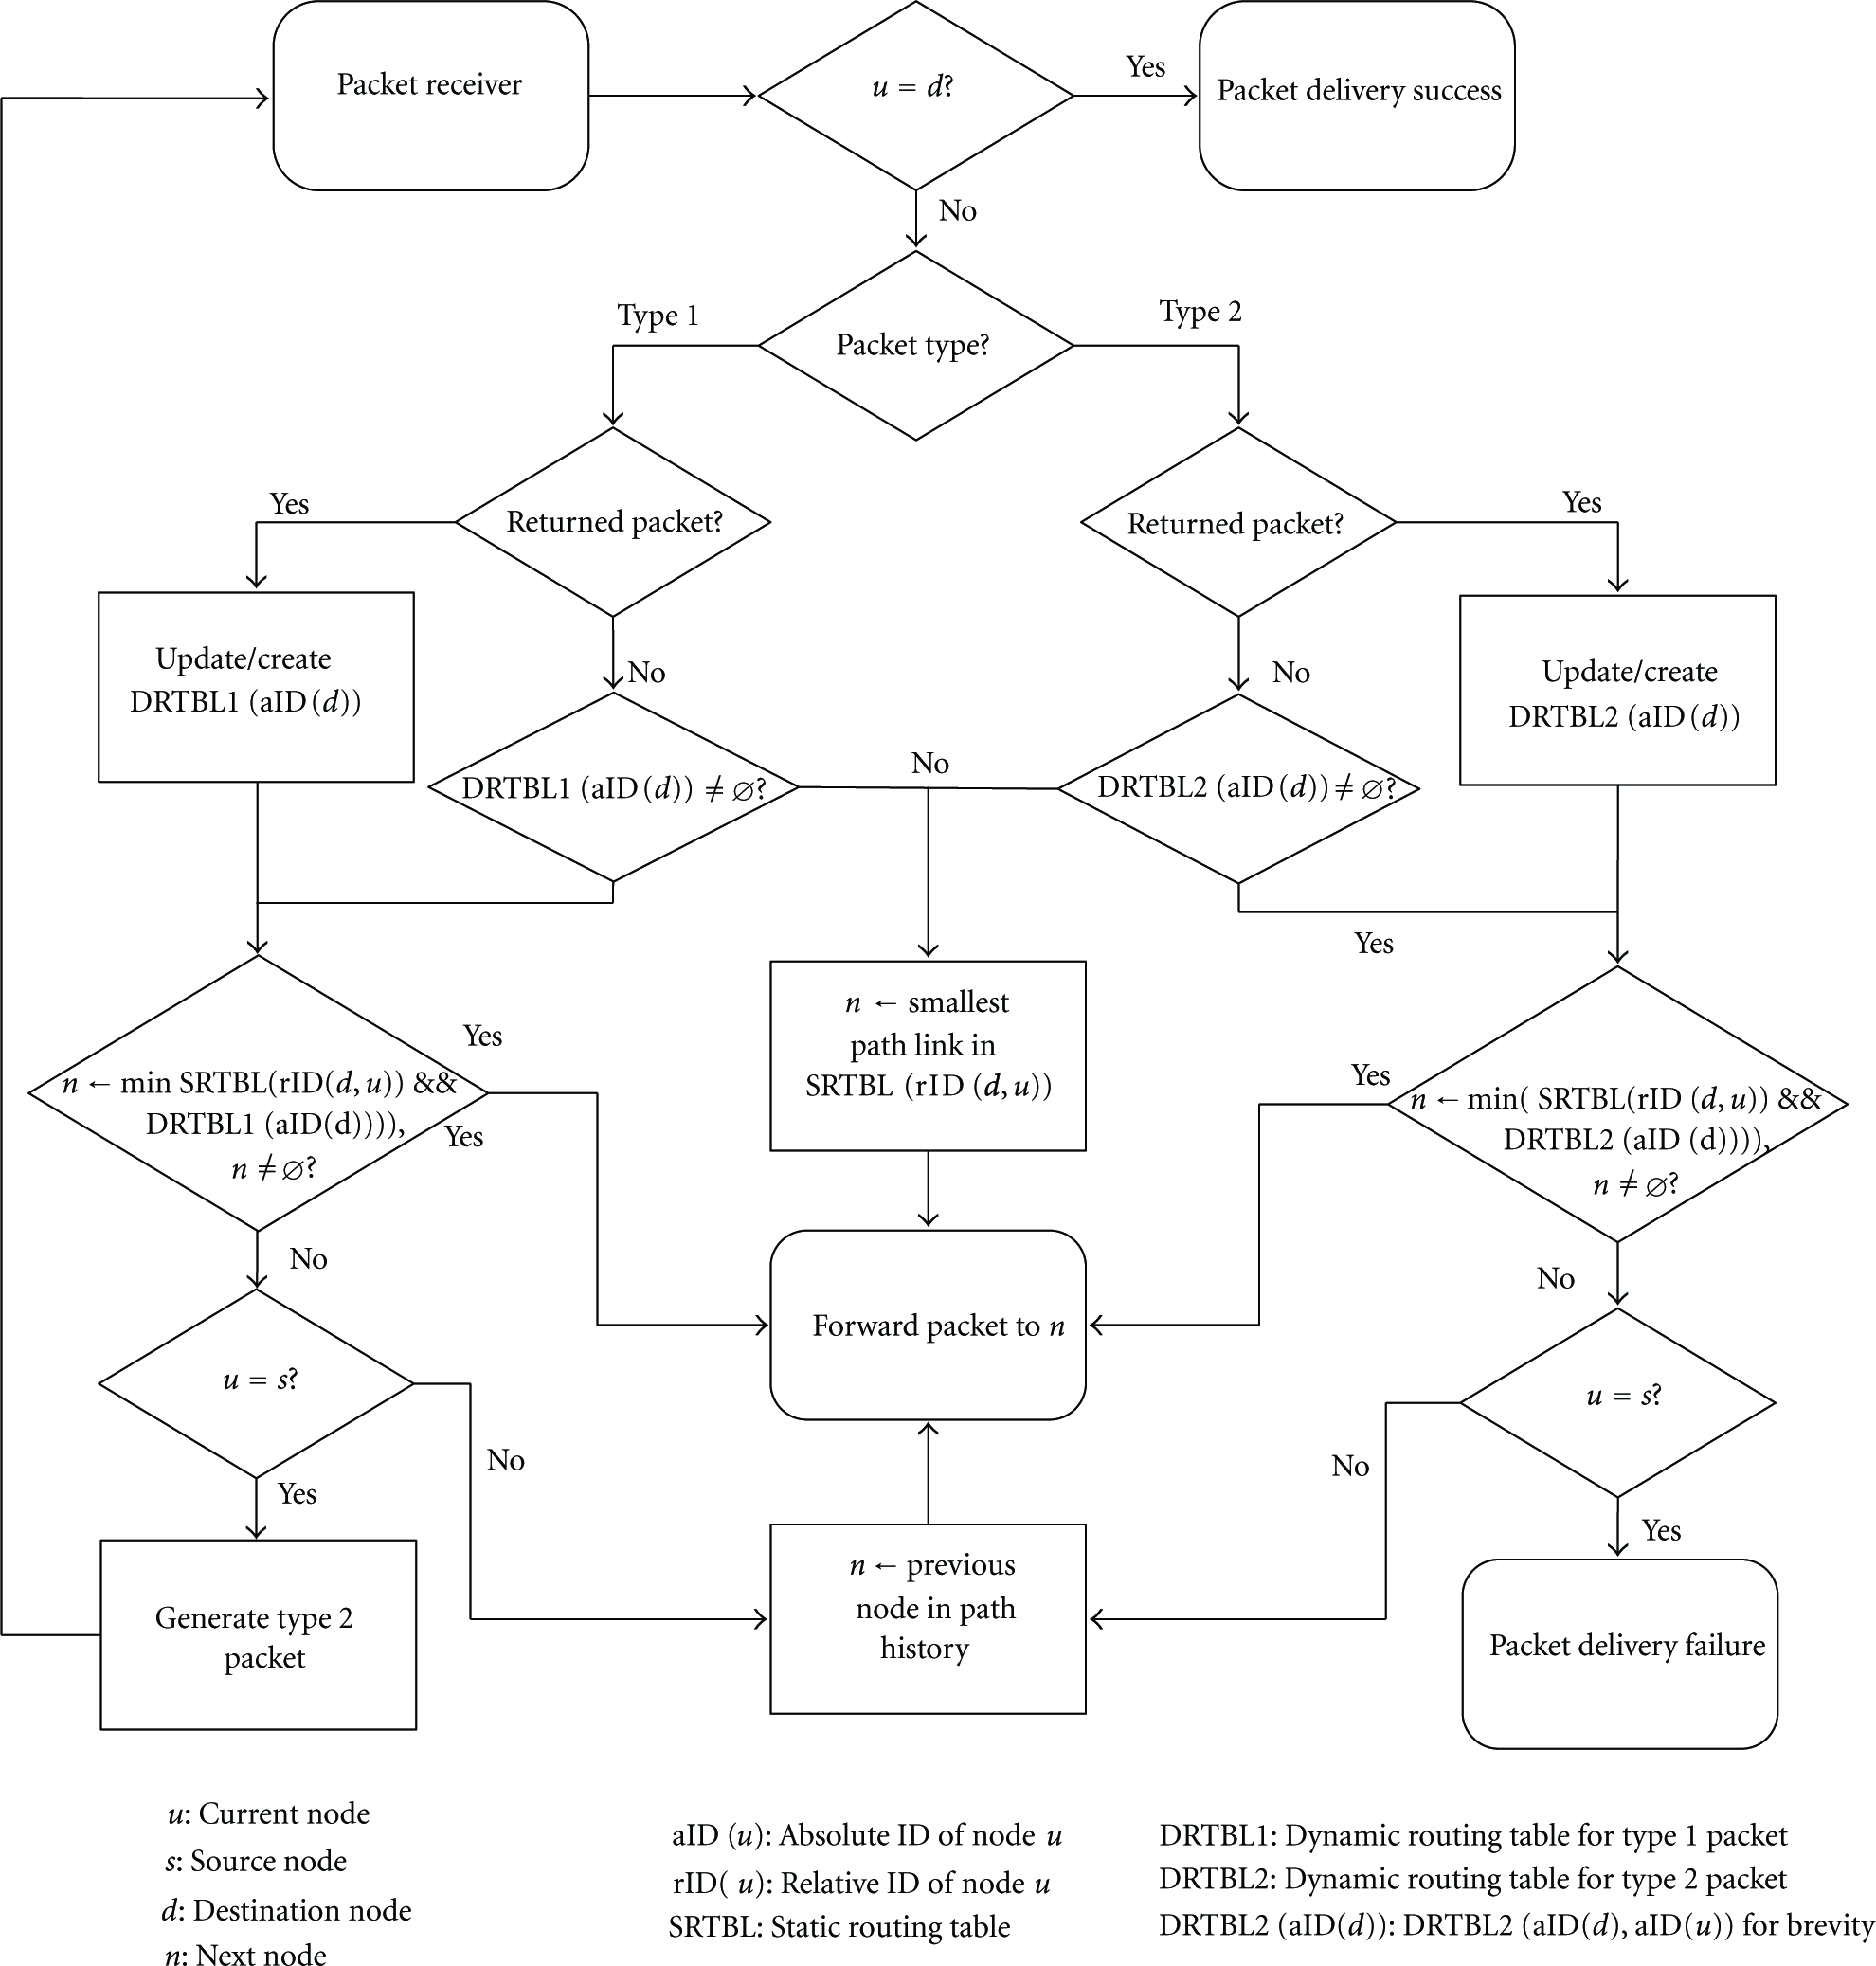
A packet gets stuck at a node having no available shortest path in Phase . In Phase , the node receiving Type packet updates or generates a D2RTBL of the destination node. The D2RTBL is initialized to at all edges when generated. Type packets directly refer to all path lengths information from the SRTBL. The node chooses the link having the smallest path length in SRTBL and an entry of one in the corresponding D2RTBL. When no outgoing link can be identified, a node forwards the packet back to the previous node in the Path history. From this, Exhaustive routing exploits more routes to destination. This mechanism improves the reachability exploiting more available paths to destination. Figure 8 shows our Exhaustive routing algorithm flow.
Exhaustive routing algorithm flow.
The phase of Exhaustive routing can have loops as shown in Figure 9. Assume node s sends a packet to node d via a. The packet reaches to node e via c but the communication link is disconnected. Then except the incoming link, the packet is forwarded to node f. The packet follows in a circle like . To prevent loops, Phase uses a different method to check whether a packet is a returned packet. In the case of Phase , a node checks whether the previous node of the last node in the Path history is itself. However, in the case of Phase of Exhaustive routing, the node checks all the Path history node IDs. Then node a is a returned packet referring to the Path history . Node a sets to zero at the generator link to node b in D2RTBL. The generator to h also sets to zero through the same method. Finally, node a delivers the packet via node m with Path history .
Network to illustrate a loop of Exhaustive routing. The dot line between nodes indicates that the communication is disconnected.
6. Simulation
We have designed simulators and performed experiments to evaluate our proposed fault-tolerant routing algorithm. We simulated BCG networks with (N is the number of nodes). We list the parameter values for BCGs used in Table 1. Parameters p and a determine N and BCG parameter k. Parameters and were used to construct the first generator. Parameters and were used to construct the second generator. Using two different generators and their inverse generators, we construct undirected degree BCGs. We arbitrary chose parameters ts and ys for generators.
6.1. Static Property Performance
First, we simulated network disconnection by edge eliminations on BCG. We randomly select edges to be eliminated. For each simulated case, we generated networks. The BCG is originally a connected graph. When we eliminate some edges, the network can consist of multiple network components (components are not connected each other). We measured packet delivery performance to the largest component only if the largest component has over of the total nodes. Figure 10 shows the percentage of connected graphs among the network samples for each edge elimination rate. From those results, we simulated BCG ranging from to elimination of edges.
Connected graph in case with edge elimination.
We showed two metrics for comparison of proposed routing algorithms: (a) routability and (b) the average hop count. We define the routability as the number of reachable source and destination pairs among all pairs of nodes in the largest component of a network and the average hop count as the average number of nodes traversed by a packet between its source and destination. In this subsection, the simulator does not generate a packet before the previous sent packet is dropped by a routing algorithm or reached to the destination (only one packet exists in the network), which helps to measure the routing algorithm performance regardless of packet congestion and buffer length.
We compared Exhaustive routing with Exhaustive routing with only Phase routing (Phase routing) and vertex-transitive routing (VT routing). Results of the Exhaustive routing are acquired after dynamic routing tables are stabilized. For comparison purpose, in our implementation of the original VT routing, a random optimal link is chosen in cases where multiple optimal links exist. When there is no available link, the packet is discarded.
6.1.1. Routability
Figure 11 shows routability of BCG with nodes after eliminating edges. Phase routing shows larger routability than Vertex-transitive routing because Phase routing exploits all shortest paths between source and destination. Exhaustive routing shows the largest routability.
Routability with BCG after edges are eliminated.
6.1.2. Average Hop Count
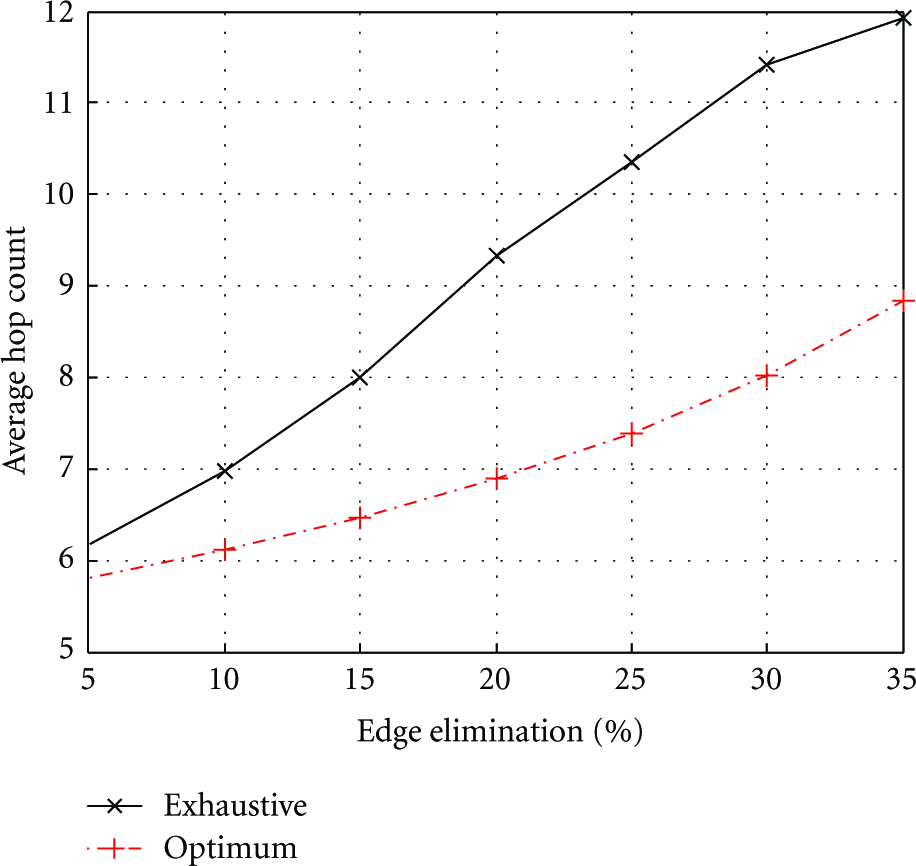
Figure 12 shows the average hop counts of BCG with nodes with edge elimination. Comparing the average hop counts of our proposed algorithms is unfair when routability is not the same. For example, one routing algorithm supports packet delivery to only nodes within a short distance from their sources and another routing algorithm supports packet delivery to all the nodes. In this case, average hop count of the second algorithm is larger than the former. So we compared only average hop count of Exhaustive routing with the results of Optimal routing in which the shortest path from the current network between the source and destination node is used. When a packet is not delivered to the destination, we exclude it from the average hop count.
Average hop count with BCG after edges are eliminated.
6.1.3. Distribution of Hop Counts
We investigated frequency of hop counts when nodes are eliminated. Figure 13 shows hop counts distribution. The histogram of hop counts exhibits a right-skewed distribution with a high frequency of short hop counts.
Hop count distribution of BCG with nodes after edge elimination. Note that hop counts exceeding are not shown for brevity.
6.2. Dynamic Property Performance
We show dynamic properties of our routing algorithms, which means measuring performance when multiple packets are flowing simultaneously in the network, as opposed to the case of static properties. In this case, packet generation rate and buffer length are important parameters. We used the network model described in Section 3 and removed a randomly chosen edge each time unit according to the edge failure rate. Simulation running time is ticks that is ten times longer than previous one because more time is needed to observe the effects of link failures. The evaluation was done in terms of the reachability according to packet generation rate, edge failure rate, and buffer length.
Table 4 shows reachability, the average ETE delay, and average occupied buffer length with infinite buffer and edge failure rate. Exhaustive routing produced the highest reachability but also the longest End-to-End delay. End-to-End delay does not consider nonreached packets.
Routing comparison with infinite buffer, 0.05 packet generation rate, and 0.0005 edge failure rate.
Reachability
ETE delay
Buffer length
VT
56.97%
6.14
0.23
Phase 1
60.7175%
6.23
0.19
Exhaustive
92.75%
9.19
0.43
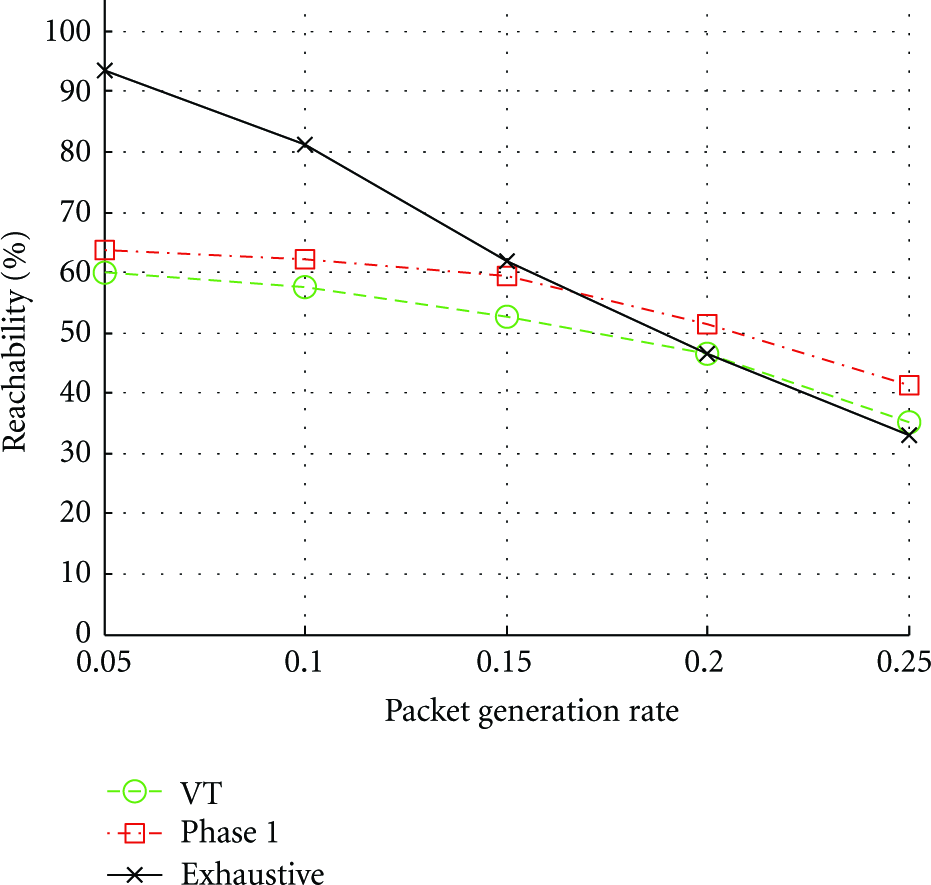
Figure 14 shows reachability as a function of packet generation rate from to . With packet generation rate, Exhaustive routing produced and better reachability than VT routing and Phase , respectively. However, as packet generation rate increases, the performance becomes similar because of network capacity and overflowed packets. With packet generation rate, Phase routing shows better reachability than Exhaustive routing because Exhaustive routing has a longer average hop count to support higher reachability in static analysis. It increases occupied buffer length and packets are dropped. Phase routing shows better reachability than VT routing even at high packet generation rate. Phase routing does not try to send packets by Dynamic Routing Table when there is no shortest path extracted from BCG. So packets guaranteed shortest path length existing in the network. Also, the occupied buffer length of Phase is smaller than one of VT.
Comparison of fault-tolerant routing reachability with buffer length and edge failure rate according to packet generation rate.
We investigated reachability in response to edge failure rate with packet generation rate as shown in Figure 15. We changed edge failure rate, which means that frequent of edge failure changes and the number of fault edges is changed at the end of simulation. The total edge number of a degree- BCG with nodes is and at the edge failure rate of , , , , and , the expected number of eliminated edges at the end of simulation are , , , , and , respectively. Regardless of edge failure rate, Exhaustive routing shows to better reachability. Reachabilities of VT routing, Phase routing, and Exhaustive routing are decreased by , , and , respectively, as edge failure rate increases from to .
Comparison of fault-tolerant routing reachability with buffer length and packet generation rate according to edge failure rate.
7. Conclusions
In networks, communication failures are possible scenarios. The existing vertex-transitive routing for Borel Cayley graphs, described in Section 2, cannot efficiently tolerate node/link failures. We proposed a fault-tolerant routing algorithm, the “Exhaustive routing,” that uses an identical routing table at each node and exploits multiple shortest paths.
Exhaustive routing has two phases. In Phase , packets are routed through the shortest path existing in the Borel Cayley graph. When all shortest paths from the BCG are disconnected, Phase of Exhaustive routing is used to exploit possible paths besides the shortest paths in the Borel Cayley graph. Through simulation, we found that the proposed Exhaustive routing showed to better routability than that of the vertex-transitive routing with various amount of link failures. Regarding the average hop count, Exhaustive routing showed just longer than the Optimal routing. We also showed good network topology properties of Borel Cayley graph comparing with torus and de Bruijn graphs with various traffic patterns.
When we consider simultaneous multiple packets flowing, Exhaustive routing showed over better reachability with certain packet generation rate. However, with high packet generation rate, Phase routing showed better reachability because it sends packets along the guaranteed shortest paths of the original Borel Cayley graph. In summary, Exhaustive routing has good reachability and small average hop counts. Our proposed fault-tolerant routing algorithm makes it possible for Borel Cayley graphs to be deployed in realistic network scenarios.
Footnotes
Acknowledgments
The authors are partially supported by the National Science Foundation under Grants nos. CNS 0829656 and IIP 0917956. Any opinions, findings, and conclusions or recommendations expressed in this paper are those of the authors and do not necessarily reflect the views of the National Science Foundation.
References
1.
SivarajanK. N.RamaswamiR.Lightwave networks based on de Bruijn graphsIEEE/ACM Transactions on Networking19942170792-s2.0-002837721110.1109/90.282610
2.
ZhuK.MukherjeeB.Traffic grooming in an optical WDM mesh networkIEEE Journal on Selected Areas in Communications20022011221332-s2.0-003616755310.1109/49.974667
3.
DuncanR.Survey of parallel computer architecturesComputer19902325162-s2.0-002538871210.1109/2.44900
4.
D'AndreaR.DullerudG. E.Distributed control design for spatially interconnected systemsIEEE Transactions on Automatic Control2003489147814952-s2.0-014175057610.1109/TAC.2003.816954
5.
SunJ.ModianoE.Capacity provisioning and failure recovery for Low Earth Orbit satellite constellationInternational Journal of Satellite Communications and Networking20032132592842-s2.0-034605543310.1002/sat.752
6.
BjerregaardT.MahadevanS.A survey of research and practices of network-on-chipACM Computing Surveys2006381711212-s2.0-33745800231
7.
MoussaH.BaghdadiA.JézéquelM.Binary de Bruijn interconnection network for a flexible LDPC/turbo decoderProceedings of the IEEE International Symposium on Circuits and Systems (ISCAS '08)May 2008971002-s2.0-5174910443910.1109/ISCAS.2008.4541363
8.
El GamalA.Trends in CMOS image sensor technology and designProceedings of the IEEE International Devices Meeting (IEDM '02)December 20028058082-s2.0-0036927968
9.
Mirza-AghatabarM.KoohiS.HessabiS.PedramM.An empirical investigation of mesh and torus NoC topologies under different routing algorithms and traffic modelsProceedings of the 10th Euromicro Conference on Digital System Design Architectures, Methods and Tools (DSD '07)August 2007Washington, DC, USAIEEE Computer Society19262-s2.0-4414909724710.1109/DSD.2007.4341445
10.
NoelE.TangW.Novel sensor MAC protocol applied to cayley and manhattan street networks with cross bow MICA22Proceedings of the3rd Annual IEEE Communications Society on Sensor and Ad Hoc Communications and Networks (SECON '06)September 20066266312-s2.0-4404908300510.1109/SAHCN.2006.288522
11.
TalebA. A.MathewJ.PradhanD. K.Fault diagnosis in multi layered De Bruijn based architectures for sensor networksProceedings of the 8th IEEE International Conference on Pervasive Computing and Communications Workshops (PERCOM '10)April 20104564612-s2.0-7795400796710.1109/PERCOMW.2010.5470627
12.
LuaE. K.CrowcroftJ.PiasM.SharmaR.LimS.A survey and comparison of peer-to-peer overlay network schemesIEEE Communications Surveys &Tutorials20057272793
13.
StoicaI.MorrisR.KargerD.KaashoekM. F.BalakrishnanH.Chord: a scalable peer-to-peer lookup service for internet applicationsProceedings of the conference on Applications, Technologies, Architectures, and Protocols for Computers Communications (ACM SIGCOMM '01)August 2001New York, NY, USAACM1491602-s2.0-003478200510.1145/964723.383071
14.
KaashoekM. F.KargerD. R.Koorde: a simple degree-optimal distributed hash tableProceedings of the International Peer-to-Peer Symposium (IPTPS '03)2003
15.
NaorM.WiederU.Novel architectures for P2P applications: the continuous-discrete approachACM Transactions on Algorithms200733, article 342-s2.0-3454829025810.1145/1273340.1273350
16.
LoguinovD.CasasJ.WangX.Graph-theoretic analysis of structured peer-to-peer systems: routing distances and fault resilienceIEEE/ACM Transactions on Networking2005135110711202-s2.0-2804446152510.1109/TNET.2005.857072
17.
QuC.NejdlW.KriesellM.Cayley dhts—a group-theoretic framework for analyzing dhts based on cayley graphsProceedings of the International Symposium on Parallel and Distributed Processing and Applications (ISPA '04)2004Springer
18.
BarrenetxeaG.Berefull-LozanoB.VetterliM.Lattice networks: capacity limits, optimal routing, and queueing behaviorIEEE/ACM Transactions on Networking20061434925052-s2.0-3374558953710.1109/TNET.2006.876187
19.
AkersS. B.KrishnamurthyB.Group-theoretic model for symmetric interconnection networksIEEE Transactions on Computers1992385555662-s2.0-34250833453
20.
TangK. W.ArdenB. W.Representations of borel cayley graphsSIAM Journal on Discrete Mathematics19936655676
21.
BermondJ. C.DelormeC.QuisquaterJ. J.Strategies for interconnection networks: some methods from graph theoryJournal of Parallel and Distributed Computing1986344334492-s2.0-0000173448
22.
MillerM.SiranJ.Moore graphs and beyond: a survey of the degree/diameter problemElectronic Journal of Combinatorics2009142-s2.0-77957570789
23.
PanchapakesanG.SenguptaA.On a lightwave network topology using Kautz digraphsIEEE Transactions on Computers19994810113111372-s2.0-0033204214
24.
DíazJ.PetitJ.SernaM.A survey of graph layout problemsACM Computing Surveys20023433133562-s2.0-034470428910.1145/568522.568523
25.
TangK. W.ArdenB. W.Vertex-transitivity and routing for Cayley graphs in GCR representationsProceedings of the ACM/SIGAPP Symposium on Applied Computing (SAC '92)March 1992New York, NY, USAACM118011872-s2.0-0026981806
26.
Olfati-SaberR.MurrayR. M.Consensus problems in networks of agents with switching topology and time-delaysIEEE Transactions on Automatic Control2004499152015332-s2.0-464424404110.1109/TAC.2004.834113
27.
YuJ.NoelE.TangK. W.A graph theoretic approach to ultrafast information distribution: borel Cayley graph resizing algorithmComputer Communications20103317209321042-s2.0-7795714280610.1016/j.comcom.2010.07.013
28.
MaoJ. W.YangC. B.Shortest path routing and fault-tolerant routing on de Bruijn networksNetworks20003532072152-s2.0-0034178693
29.
HoC. T.StockmeyerL.A new approach to fault-tolerant wormhole routing for mesh-connected parallel computersIEEE Transactions on Computers20045344274382-s2.0-194246812810.1109/TC.2004.1268400
30.
BoppanaR. V.ChalasaniS.Fault-tolerant wormhole routing algorithms for mesh networksIEEE Transactions on Computers19954478488642-s2.0-002934501210.1109/12.392844
31.
IntanagonwiwatC.GovindanR.EstrinD.HeidemannJ.SilvaF.Directed diffusion for wireless sensor networkingIEEE/ACM Transactions on Networking20031112162-s2.0-003729569210.1109/TNET.2002.808417
32.
ParhamiB.Introduction to Parallel Processing: Algorithms and Architectures1999Norwell, Mass, USAKluwer Academic
33.
FengZ.YangO. W.Routing algorithms in the bidirectional de Bruijn graph metropolitan area networks3Proceedings of the Military Communications Conference (MILCOM '94)October 1994IEEE9579612-s2.0-0028746278
34.
DijkstraE. W.A note on two problems in connexion with graphsNumerische Mathematik1959112692712-s2.0-3414712047410.1007/BF01386390