
Abstract
The growing need of the real-time traffic data has spurred the deployment of large-scale dedicated monitoring infrastructure systems, which mainly consist of the use of inductive loop detectors. However, the loop sensor data is prone to be noised or even missed under harsh environment. The state-of-the-art wireless sensor networks provide an appealing and low-cost alternative to inductive loops for traffic surveillance. Focusing on the urban traffic data collection, this paper proposes a distributed algorithm to collect the traffic data based on sensor networks and improve the reliability of data by quality analysis. Considering the certain correlated characteristics, this algorithm firstly processes the data samples with an aggregation model based on the mean filter, and then, the data quality is analyzed, and partial bad data are repaired by the cusp catastrophe theory. The performance of this algorithm is analyzed with a number of simulations based on data set obtain in urban roadway, and the comparative results show that this algorithm could obtain the better performance.
1. Introduction
Nowadays, the traffic jams is a difficult problem that confronts the urban residents with environmental pollution, traffic incident, and great financial loss every year. The intelligent traffic system (ITS) has proved to be the most effective approach to resolve this problem. In the ITS, the real-time traffic data collection and data quality analysis play the critical roles for studying and monitoring the traffic state.
As the ITS operations expand in major urban areas, vast amount of traffic detectors are deployed in road networks which provide the most abundant source of traffic data. But the detectors are prone to errors and malfunctioning, data samples are often missing or invalid. As reported, 30% out of 25000 detectors do not work properly daily in California [1]. And a program named Performance Measurement System (PeMS) has been launched for the traffic data health checking by the California Department of Transportation and researchers of the University of California at Berkeley [2, 3]. The PeMS currently collects more than 1GB per day from thousands of loop detectors in the California [4]. According to statistics, only 32.78% of detectors worked well and provided good data (reliable data), and the others worked with failure and provided missing data or bad data. While, some good data reported by the well-functioned detector working in the severe environment such as incident or bad weather were discarded as error data, because they were apparent outliers in normal condition. In fact, these data are more valuable to the ITS in some extent. To improve the usability of traffic data, it is urgent to develop new technology to collect the data and the effective algorithm to identify the real bad data or repair them.
Wireless Sensor Network (WSN) is a distributed collection of sensor nodes having potential application in traffic surveillance system with detection accuracy as good as that of inductive loop detectors. As they have a much higher configuration flexibility, which makes the system scalable and deployable everywhere in the road network, the sensor networks offer an attractive alternative to inductive loops for traffic surveillance [5].
In this paper, we focus on studying the performance of the traffic data detection based on WSN. And a distributed traffic data detection and quality analysis (DTDDQA) algorithm is proposed to process the traffic data collection and data quality analysis. This algorithm firstly aggregates the samples according to their correlated characters. Then, based on the nonlinear and catastrophic characters of traffic data, the algorithm analyzes the data quality and repairs partial bad data based on the cusp catastrophe theory. Furthermore, a number of simulations are conducted to evaluate the performance of the algorithm. The simulation results show that this algorithm outperforms other data quality analysis algorithms with better performance and robustness.
2. Related Work
2.1. Traffic Data Collected by WSN
WSN is an effected technology and a revolution in remote information sensing and collection applications. Sensor node has advantages such as low costs, small size, wireless communication, and high sensing accuracy, and it can be deployed with great quantity. Compared with the traditional centralized data processing mode, WSN provides a new solution for distributed method to acquire and process traffic data [6]. In the prior research publications [5, 7, 8], the possibility of replacing traditional methods with WSN is creatively researched in the California Partners for Advanced Transit and Highways (PATH) project of University of California at Berkeley. In this three-year research project, they focused on the prototype design, analysis, and performance of WSN for traffic surveillance using both acoustic and magnetic sensors. And in California, they verified the feasibility of collecting information based on WSN with a large number of on-road experiments. Jeahoon deployed WSN in the road networks and introduced an autonomous passive localization (APL) scheme to perform the localization using vehicle-detection timestamps along with the road map of target area. It was evaluated in Minnesota roadways, and the results shown that it was effective [9].
In the state-of-the-art vehicle detection based on WSN, magnetic sensor, such as Honeywell HMC1002, has been integrated with sensor node of WSN. The magnetic sensor can measure the change of Earth's magnetic field with high accuracy [10]. According to the magnetic field distortion signal caused by moving vehicle, an efficient vehicle detection algorithm (adaptive threshold detection algorithm, ATDA) was developed with high precision of 97% [2]. Based on WSN and ATDA algorithm, Ding used a 3-node WSN to estimate the vehicle speed, and the precision was over 90% [11]. Similarly, Zhang developed a magnetic signature and length estimation algorithm to identify the vehicle type with binary proximity magnetic sensor networks and intelligent neuron classifier, and the simulations and on-road experiments obtained high recognition rate over 90% [12].
2.2. Traffic Data Quality Analysis
As the ITS applications expand in major urban areas, traffic data collection becomes more comprehensive. However, the quality of these traffic data is not as good as expected. They always contain many missing values or incorrect values and require careful “cleaning” to produce reliable results. The bad data and missing data have been an obstacle to ITS applications that use the data for performance.
Missing data is mainly caused by traffic data detectors failures or disruptions in communications. Given the continuous operation of most ITS traffic monitoring devices, missing data are almost inevitable. But they are relatively easy to be handled. For short periods of missing data identification, the method of time series analysis has been addressed. And the linear interpolation and neighborhood averages are natural methods to fill missing data with the data from the neighbors' data or the history [4].
Compared with the processing of missing data, how to identify bad data and retrieve the good data from unreliable detectors are relatively complicated. In order to identify the bad data, there are many theories and practical methods proposed in the literature surveys, such as internal range checks, time series patterns, and historical patterns. For the single detector, Nihan introduced the conception of an acceptable region based on historical observations, which declared data to be inaccurate if they fell outside the region [13]. Similarly, Ki proposed an approach to check the error speed measurement with a fixed error-filtering algorithm [14]. While for the occasions of detectors extensively deployed in a large scale, the distributed methods coordinated with the nearby detectors should be proposed. C. Chen proposed a method to detect bad data with modeling the relationship between neighboring loops as linear and used linear regression to evaluate them [4]. Based on the similarity theory of traffic flow, Lelitha considered the conservation of traffic flow over a set of adjacent detectors to identify unreliable data [15]. Rajagopal presented a distributed and sequential algorithm for detecting multiple faults in a sensor network which worked by detecting the correlation statistics of neighboring sensors [16].
3. Modeling and Methodology
3.1. Traffic Data Detection and Aggregation
3.1.1. Traffic Data Detection by WSN
The model of distributed traffic data detection is shown as Figure 1, which is proposed by [11]. Compared with the other traffic data models based on WSN, it is more efficient with higher detection accuracy and lower energy consumption.

Topology of the traffic data detection model.
In the model, it is composed of two sensing nodes and one detecting node. The function of the sensing node is mainly to detect vehicle presence, whether a vehicle passing or not, and transmit the detection information (DI) as soon as a passing vehicle is detected. And the detecting node records the local time (
Based on the traffic data detection model, the traffic data are detected as follows.
(a) Vehicle Passing Speed
The vehicle passing speed is calculated by

(b) Occupancy
The occupancy p is the fraction of time when the detector is covered by vehicles in the observation interval. It can be calculated by

(c) Traffic Flow
The traffic flow q is the number of vehicles crossing the traffic data detection model in an observation interval, and it is given by

3.1.2. Data Aggregation
Considering the distributed traffic data sources with a certain correlated character, the collected traffic data are correlated. Due to the correlation, the approach taking the correlation into account will outperform those which use the data directly.
In-network data aggregation is an important technique in WSN which exploits correlated sensing data and has been well studied in recent years [17].
For WSN that has irreplaceable batteries with limited energy capacity and poor data processing capability in practice, a distributed aggregation model based on the mean filter is proposed. The processing of the aggregation is shown as Figure 2.

Aggregation model based on the mean filter.
Based on the distributed traffic data detection model, traffic data samples ((
The aggregation model is as follows:

3.2. Model of Traffic Date Based on Cusp Catastrophe Theory
The existing models of traffic data mainly assume that the traffic data is at least locally gradual and linear, such as car following or hydrodynamic principle. However, according to recent researches, the discontinuity and catastrophe of traffic flow have been identified. But the previous traffic models are difficult to determine the breakpoint. The source of breakpoint is complex. Some breakpoints lie between the regime of free-flow condition and congested flow condition, and others are caused by the traffic incident.
The cusp catastrophe theory is used to describe the discontinuous phenomena of the natural. And researches have discussed the discontinuous behavior using the cusp catastrophe theory in traffic [18–20].
According to the basic cusp catastrophe [21, 22], the total potential energy (W) function of traffic data is
Based on the manifold function and the bifurcate equation of the cusp catastrophe, the model of traffic data based on the cusp catastrophe is defined as follows:

In (7), m and n are coefficients, which can be captured by using the methods of mathematical statistics.
3.3. The Evaluation Function of Traffic Data Quality
Based on (7), the evaluation function of traffic data quality is defined as below:

Conclusion 1.
speed, flow, and occupancy are good when

Conclusion 2.
speed is error, but flow and occupancy are valid, and the speed could be repaired when

Conclusion 3.
speed, flow, and occupancy are bad when

In Conclusion 2, v can be repaired by q and p, where
4. DTDDQA Algorithm
In this section, we design a distributed traffic data detection and quality analysis algorithm, named distributed traffic data detection and quality analysis (DTDDQA) algorithm, which consists of two steps. The first step is the traffic data collection and aggregation which aggregates the traffic data collected from n nodes in every 5 minutes. The second step is the real-time data quality analysis according to the data profiling of traffic data constructed by the model based on cusp catastrophe theory. As the output, the good data can be verified and some bad data can be repaired.
Based on DTDDQA algorithm, the processing of traffic data analysis is shown as Figure 3. The whole processing is running on the AP node.

Processing of traffic data quality analysis based on the DTDDQA algorithm.
Based on the method mentioned above, a state machine is designed to perform the processing of DTDDQA algorithm adaptively for traffic data detection and quality analysis, as shown in Figure 4. The Initialization state. It is mainly to set the initial value of system ( Distributed detection state. In this state, ( Aggregation state. It is aggregated to Analysis state. It uses cusp catastrophe theory to evaluate Output state. Store good data and repaired data, or transmit these data to the data center, and then transit to distributed detection state. Repair state. According to (7), the average speed is rectified by

State machine for the DTDDQA algorithm.
As a result, the state machine can be running automatically without the end state. In actual operations, the system needs to be stopped or restarted manually at a pinch.
5. Simulation Results and Analysis
The presented traffic data collection and data quality analysis are investigated in this paper via simulation with VISSIM which is a professional traffic simulation software.
5.1. Simulation Setup
The traffic data set adopted in this paper comes from the Dalian Transportation Management Center. It has been collected by the inductive loop detectors deployed in the Huanghe Road, Dalian, China. And the data set contains the traffic data (speed, flow, and occupancy) from 0:00 AM to 12:00 PM, December 2, 2008.
The Huanghe Road is a road with four-lane in each direction. The traffic flow is quite complicated, and the traffic state varies obviously.
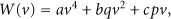
Based on the traffic data set, we reinstate the traffic scene using VISSIM. In the simulation, a distributed traffic data collection model based on WSN is deployed on the westbound direction's entrance of Huanghe Road, as shown in Figure 5.
Traffic scene reinstated by VISSIM: (a) The test bed of WSN in VISSIM; (b) The layout of WSN.
The traffic data collection model is deployed at point A in Figure 5(a). The model contains four observation points (OP) and one AP node. Each OP is composed of 3 sensor nodes and deployed in each lane. The functions of each sensor nodes are described in the Section 3.1. The AP node collects the traffic flow data from OPs and performs the algorithm DTDDQA to analyze and clean the traffic data.
5.2. Performance of Traffic Data Detection and Aggregation
In this subsection, we focus on the traffic data collection based on WSN and study the characters of traffic flow, especially whether the traffic flow has correlation and catastrophe. Furthermore, we analyze the performance of the aggregation of distributed collection model based on WSN.
Using the experimental data collected with the platform as above, the statistics of average speed, average occupancy rate, and flow from OP1 to OP4 in every 5 minutes of 24-hours are shown in Figure 6.

24-hours traffic data samples collected from OP1 to OP4 in every 5 minutes: (a) Speed; (b) Flow; (c) Occupancy.
It is obvious that the traffic flow is catastrophic and nonlinear.
For the performance of the aggregation and the correlation of distributed collection model based on WSN, both standard deviation and relative performance indices are utilized in this paper.
The standard deviation index of ith OP (

According to [23], the corresponding relative performance index of ith OP (

So, the performance of the aggregation of distributed collection model is shown as Table 1 in which the
Performance of the aggregation.

It is obvious that the collection data of each OP is certainly correlated. While the
5.3. Performance of Traffic Data Quality Analysis
In this subsection, we focus on performance of the DTDDQA algorithm. Without loss of generality, we compare the performance of the following two traffic data quality analysis algorithms:
the DTDDQA algorithm, the error data identification method in [14].
We analyze these two algorithms based on the data set achieved from loop sensor. Firstly, the data set is aggregated by (5), and then, we analyze the traffic data quality using these two algorithms based on the aggregated data set.
In order to evaluate the algorithms, 40 of 288 in the aggregated data set are modified to bad data manually. Among the 40 bad data, 20 samples are only the speed value altered (regarded as repairable data) and in the other 20 samples' speed and flow are altered (regarded as error data). The new data set will be analyzed separately using these two algorithms. The results illustrate that the performance of DTDDQA algorithm is better. The performance detailed is as follows.
5.3.1. Performance of DTDDQA
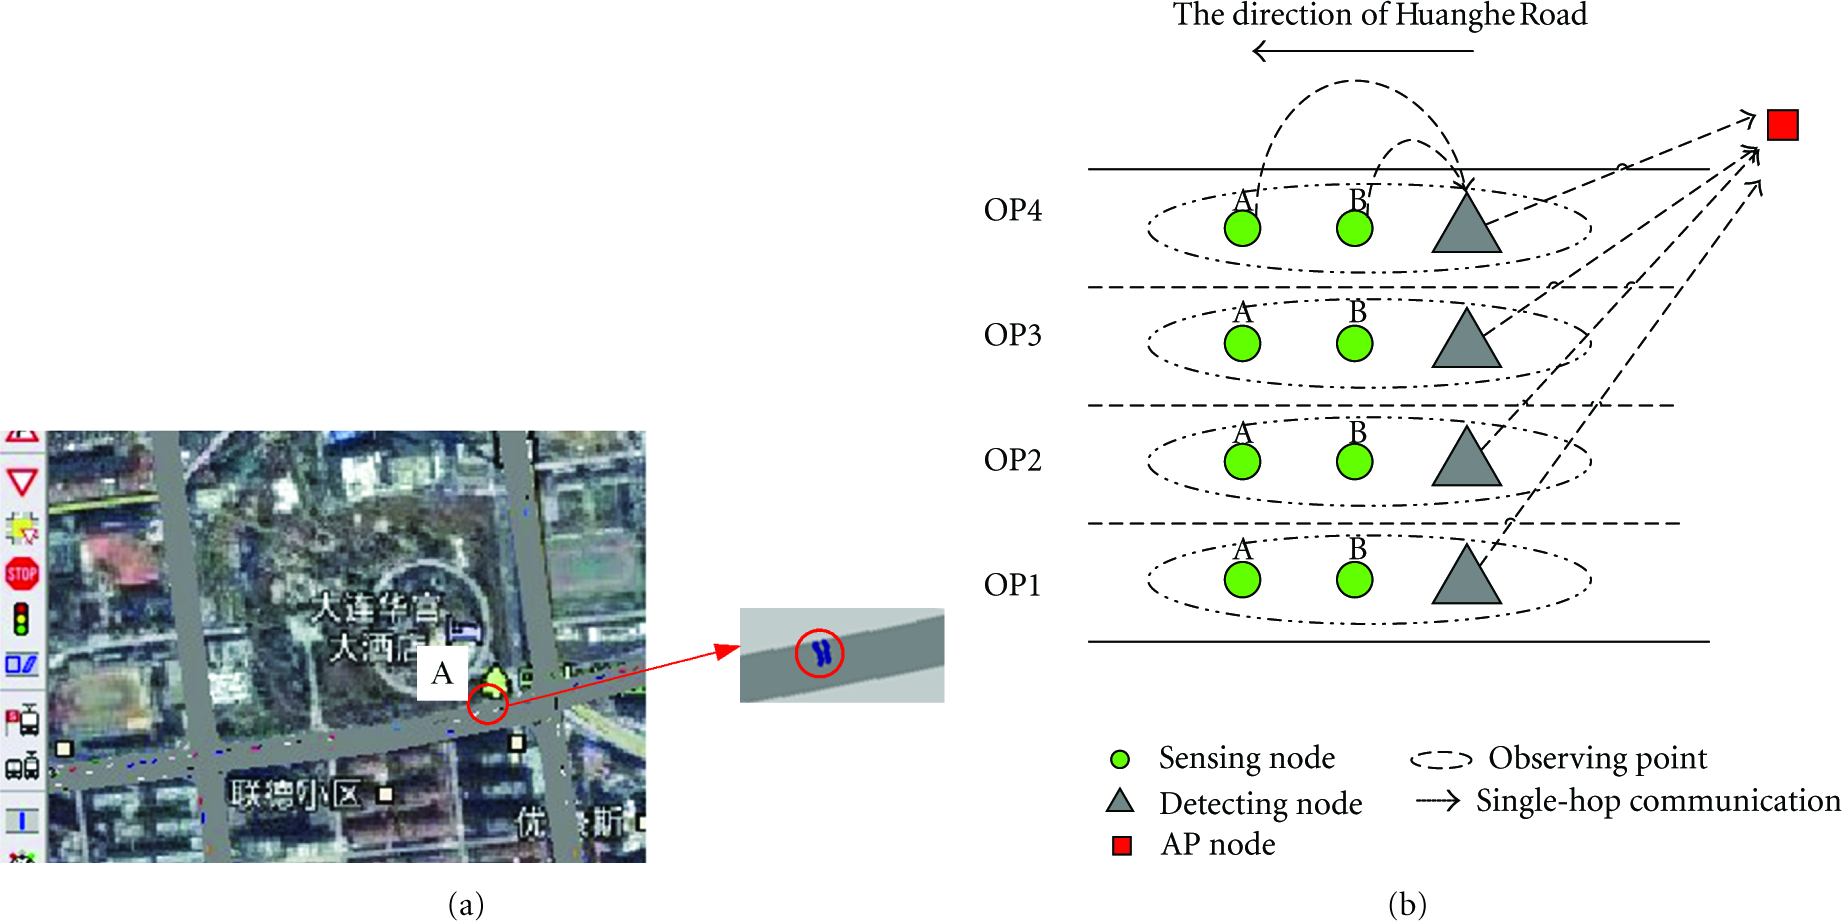
The new data set is analyzed by DTDDQA algorithm, and the result is shown in Figure 7. The samples of the aggregated data set are input, and three integer values predefined (1, 2 and 3) are output. Based on the three Conclusions of (8), 1 represents that the sample is good; 2 is stated that the sample is repairable (occupancy and flow are exact, but velocity is error); 3 means that this sample is error and irreparable. The performance analysis result is shown in Table 2. The identification of good data is about 87.71%, and it increases to 94.40% if the repaired data are included. And the identification of bad data is 75.00%.
DTDDQA results.

The traffic data quality analysis results with DTDDQA.
5.3.2. Performance of the Data Quality Algorithm in [14]
The existing traffic data quality analysis algorithms mainly focus on the data collected from freeway. However, the traffic flow of freeway tends to linear and gradual. In order to study whether the algorithms are fit for the traffic data in urban roadway, the algorithm in [14] is tested. It is proposed with a filter to process traffic data, which is only dealt with the speed value. When the data deviation is more than 5%, the sample will be removed.
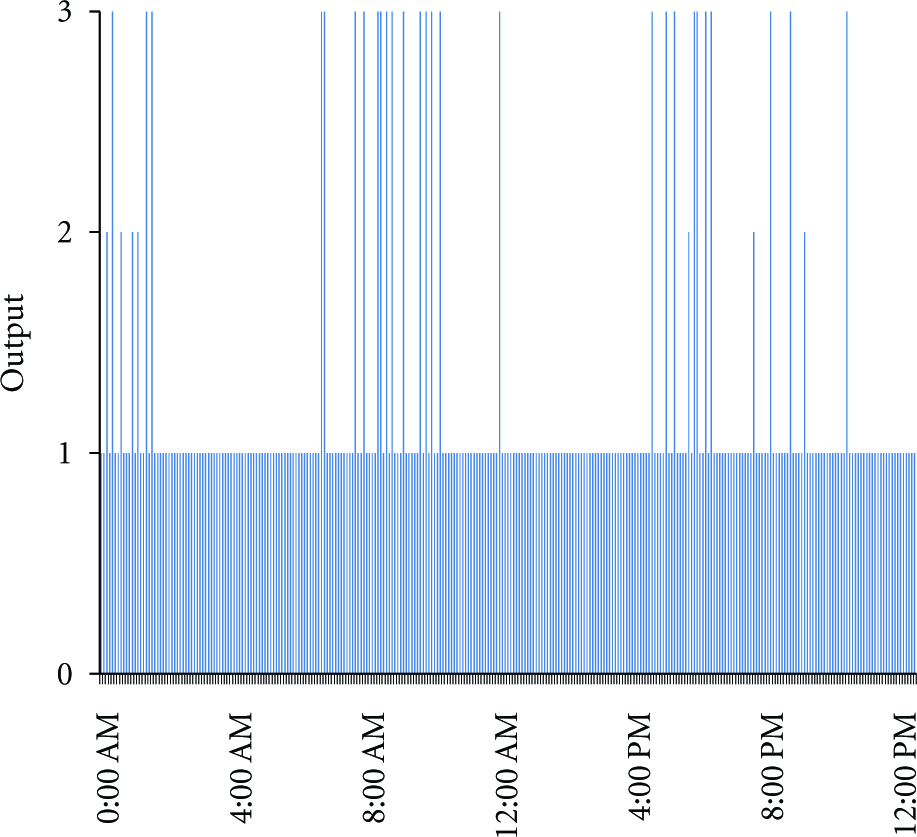
Using this algorithm to analyze the aggregated data set, the result is shown in Figure 8. Similarly, the speed values of the aggregated data set are the input, and two integer values predefined (0 and 1) are output, where 0 means the data is good and 1 represents the data is error. As a result, there are 176 samples out of 288 considered to be good data, so the identification rate is 70.97%, which shows that the performance of the algorithm to the data from the urban roadway is not as good as it does from the freeways.
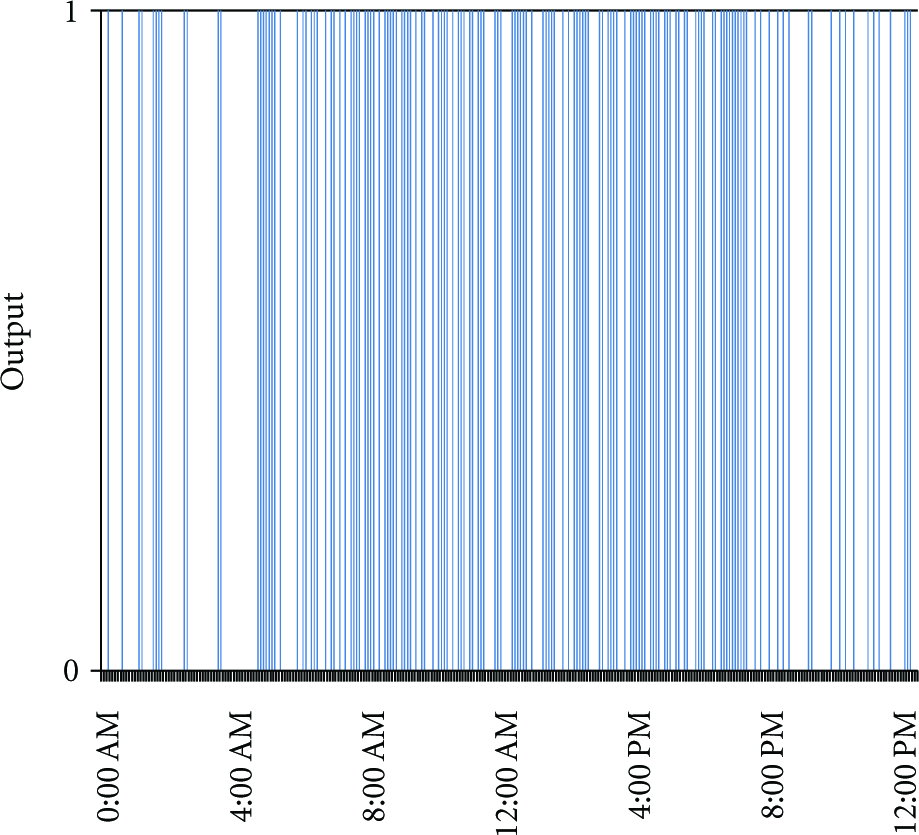
The traffic data quality analysis results with the algorithm in [14].
6. Conclusions
WSN is a revolution in applications of information sensing and collection, and consequently, it has broad prospect in the ITS. In this paper, we develop a distributed algorithm (DTDDQA) for urban traffic data detection and quality analysis based on WSN. In this algorithm, we firstly propose an aggregation model based on the mean filter to process the distributed data samples collected by WSN and then present an evaluation equation and data quality analysis model based on the cusp catastrophe theory to identify the bad data and try to repair them. A number of simulations are conducted based on the real data samples collected from on-road detectors. As a result, with the processing of data quality analysis and data recovery, this algorithm improves the correctness and robustness of traffic data collection using WSN.
Although we focused on the effort in developing a general algorithm for urban traffic data detection and quality analysis, the difference and variation of traffic flow characters in the live detection scenario should be taken into account. For future work, we propose to study the algorithm further to be more self-adaptable and self-adjustable according to the traffic data detection based on the active-learning mechanism.
Footnotes
Acknowledgments
This work was supported in part by the Key Program of National Science Foundation of China under Grant no. 60873256. The authors would like to thank the Dalian Department of Transportation for providing the utilized real traffic measurement data and the anonymous reviewers for their valuable comments.