
Abstract
An experimental investigation has been carried out to study the effect of delta-shaped obstacles mounted on the absorber surface of an air heater duct with an aspect ratio 6 : 1 resembling the conditions close to solar air heaters. This study encompassed the Reynolds number (Re) ranging from 3400 to 27600, longitudinal pitch of the obstacle (
1. Introduction
The thermal efficiency of solar air heaters (SAHs) has been found to be generally poor because of the inherent poor thermal conductivity of air. In order to make the solar air heaters economically viable, their thermal efficiency needs to be improved by enhancing the heat transfer coefficient. There are different factors affecting the SAH efficiency, for example, collector length, collector depth, type of absorber plate, glass cover plate, wind speed, and so forth.
The shape factor of the absorber plate is the most important parameter in the design for any type of SAH. Increasing the absorber plate shape area will increase the heat transfer to the flowing air. On the other hand, it will increase the pressure drop in the collector; this increases the required power consumption to pump the air flow crossing the collector [1].
The main applications of SAHs are space heating and drying. The SAHs occupy an important place among solar heating systems because of minimal use of materials.
The conventional solar air heaters are generally improved by means of various augmentation techniques with emphasis on many types of surface enhancements. Augmented surfaces can create one or more combinations of the following conditions that are favorable for the increase in heat transfer rate with an undesirable rise of friction: (1) interruption of boundary layer development and increasing turbulence intensity, (2) increase in heat transfer area, and (3) generating of vortex and/or secondary flows [2].
In order to increase the thermal performance of solar air heater various designs, with different shapes and dimensions of the air flow passage in flat plate-type solar air collectors has been developed in literature [3–9].
Another method of improving the thermal performance of solar air heater is by introduction of obstacles in the dynamic air vein of the collector which creates a turbulent flow and hence enhances the thermal energy exchange by convection and the maximal extraction of the absorber energy can be obtained of course at the cost of higher increased pressure drop. Ozgen et al. [10] studied the thermal performance of double-flow SAHs in which aluminum cans of different arrangements are used as obstacle. This method substantially improves the collector efficiency by increasing the fluid velocity and enhancing the heat-transfer coefficient between the absorber plate and air.
Esen [11] compared the experimental results between SAH supplied with obstacles and those without obstacles for the case of the double-flow SAHs, and thus the influences of various parameters, such as the obstacles types, the mass flow rate of air, and the level of absorber plates in duct, on the energetic and exergetic efficiencies of the SAHs were examined.
Abene et al. [12] carried out experimental study, which consists of a solar energy simulation, with an aim to improve the efficiency-temperature rise couple of the flat plate solar collector by considering several types of obstacles: ogival transverse (OT), ogival inclined folded (OIF1), waisted tube (WT), waisted delta lengthways (WDL1), and waisted ogival lengthways (WOL1) disposed in rows in the dynamic air vein of the flat plate collector and have proceeded to the application of the best two systems (WDL1) and transverse-longitudinal obstacles (TL) for drying an agricultural product.
By comparing with the collector without obstacles (WO), the thermal transfers, and, consequently, the output temperature (TO) and the collector efficiency (η) are clearly improved. The heat quantities and drying times obtained in the case of WDL1 are very interesting compared with the collector WO.
The choice of the geometrical shapes of the obstacles to be used has to satisfy some criterion as the form and the disposition of the obstacles affecting the air flow during its trajectory. The obstacles ensure a good air flow over the absorber plate, create the turbulence, and reduce the dead zones in the collector.
As it has been observed from the literature, a few researches were carried out to study the effect of obstacles (of various geometries) on heat transfer and friction factor characteristics of a solar air heater. Even though it is the goal of every researcher to increase the efficiency of solar air heater by enhancing the heat transfer coefficient between the absorber plate and the air, the geometrical characteristics and arrangement of the obstacles greatly affect the result. So detail parametric study is always necessary in order to find the optimum obstacles parameter.
2. Experimental Program
2.1. Experimental Setup
An experimental setup has been designed to conduct experimental investigation on the heat transfer and fluid flow characteristics of a rectangular duct with obstacles attached on the heated surface. Because of the variation of the solar energy intensity at different times and positions repeatability of the work is not possible at outdoor condition. So an indoor setup is selected to control the heat flux supplied to the system at desired level all the time so that all variables can be studied at the same heat flux supplied and repeatability is also possible.
A schematic diagram of the indoor experimental setup and its sectional view are shown in the Figures 1 and 2, respectively. Air is sucked through the rectangular duct by means of a blower driven by a 3-phase, 440 V, 3.73 KW, 2880 rpm AC motor and delivered back to the atmosphere making an open loop system.

Schematic diagram of the experimental setup.
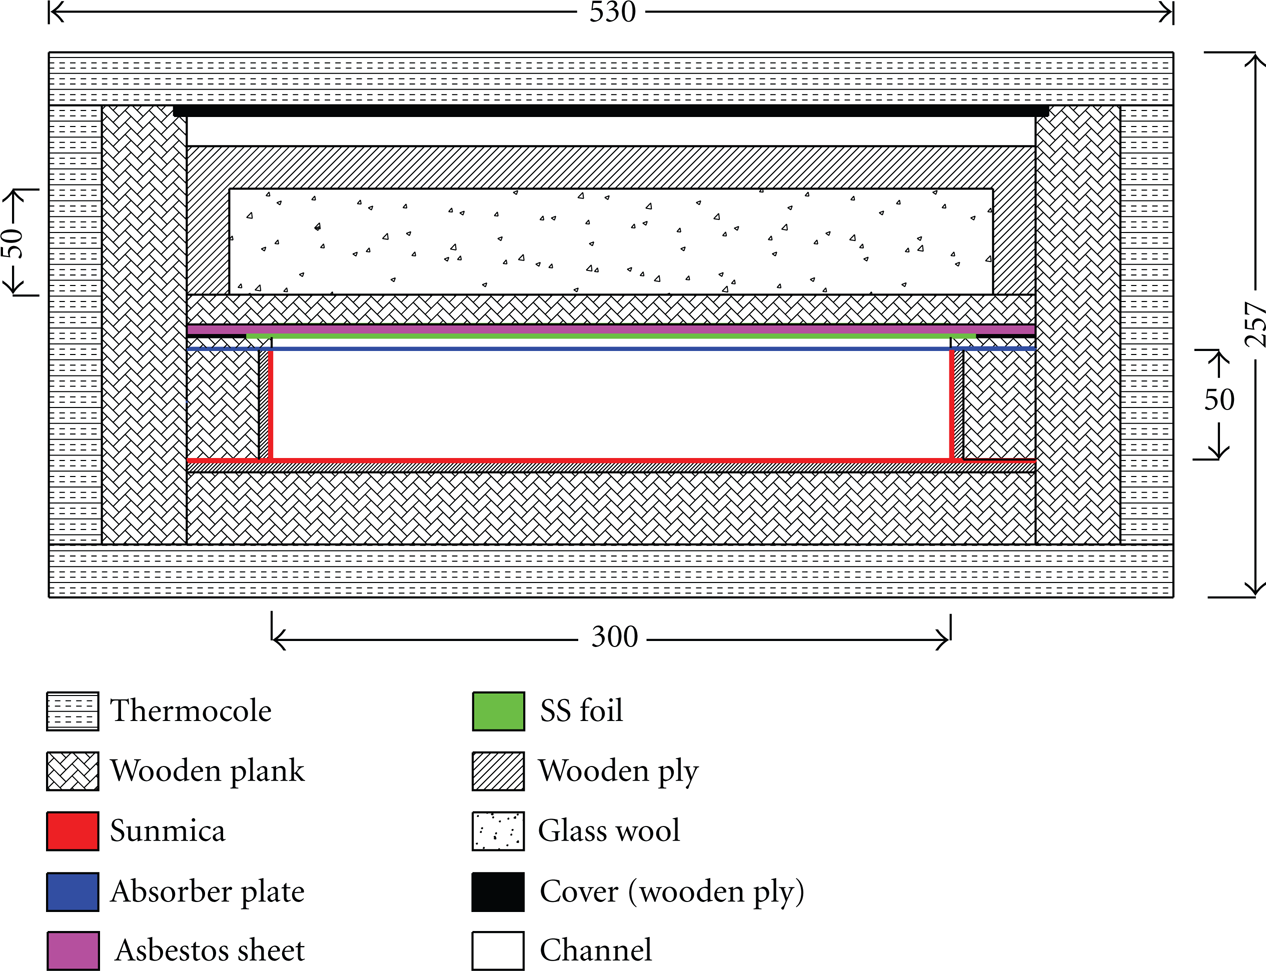
Cross-sectional details of test section (Section X-X).
The rectangular duct consists of an entrance section (800 mm × 300 mm × 50 mm), a test section (1200 mm × 300 mm × 50 mm), and an exit section (500 mm × 300 mm × 50 mm). It may be noted that ASHRAE standard 93–77 [13] recommends a minimum entry and exit length to be 5
The absorber plate is heated by an electric heater made of 0.05 mm thick stainless steel foil (SS foil) which is used as heating element and a uniform heat flux of 800 W/m2 is supplied by using a variac and step-down transformer. All sides of rectangular duct are insulated with a 50 mm thick thermocole. The piping section up to the thermal mass flow meter is insulated by 192 mm thick foamed polygene and foam sheet.
A GI sheet of 1200 mm × 400 mm × 0.5 mm is used as an absorber plate (heated plate; Figure 3) on which delta shaped obstacles (Figure 4) of the same material and thickness are attached on the lower side and the upper side is exposed to the heating element (uniform heat flux). The effective area (heat transfer area) of the absorber plate is 1200 mm × 300 mm = 0.36 × 106 mm2. The upper side of the absorber plate is painted dull black to increase the absorptivity of the plate.

Photographic view of plate with obstacles mounted.
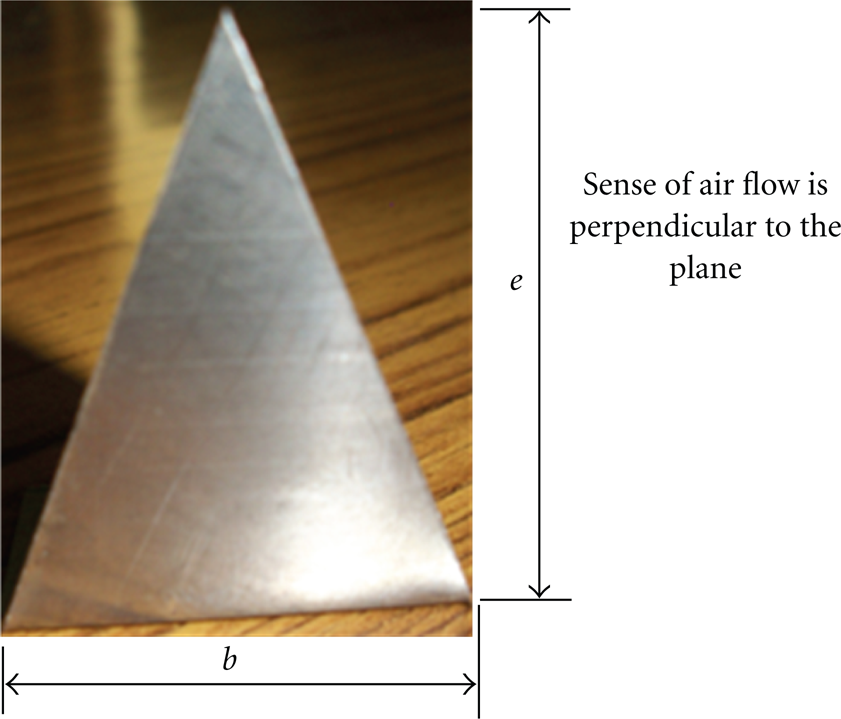
Photographic view of delta-shape obstacle.
The air from the atmosphere enters the inlet section of the rectangular duct through a bell mouth entrance. The uniform fully developed air passing through the inlet section of the rectangular duct enters the test section where it is heated by a power supplied through the heater assembly and then passes through the exit section of the rectangular duct to the circular pipe and finally discharged to the atmosphere through the centrifugal blower. A thermal mass flow meter is provided at the circular pipe line for the measurement of air mass flow rate.
The temperature of the air stream and the absorber plate at different position of the test section are measured by K-type thermocouples using National Instruments data acquisition system of chassis model NI cDAQ-9172. Analog-type micromanometer is used to measure the pressure drop across the test section. The rate of flow of air in the duct is controlled by programmable blower motor speed controller.
The test was conducted at a constant heat input and by varying air flow rate such that the Reynolds number is maintained in the range of 3,400–27,600 and required readings were recorded. All readings are noted under steady-state condition. The steady state for each run was found to reach within 1.5 to 2 hrs.
The variation of geometry and arrangement of obstacles are presented in Table 1. The ranges of parameters for this study have been decided on the basis of practical considerations of the system and operating conditions of the solar air heater. The range of relative obstacle height is selected on the basis of percentage of air flow blockage in the channel with minimum 25% blockage and maximum 75% blockage. The range of obstacle transverse and longitudinal pitch is selected on the basis of consideration of flow separation and reattachment length. And similarly the angle of twisting the obstacle or angle of incidence is selected on the basis of creating turbulence. The range of Reynolds number is selected on the basis of the air flow rates reported in the literature [14, 15] for solar air heater and on the capacity of the blower used.
Details of obstacle geometry and arrangement.

2.1.1. Instrumentation
(i) Temperature Measurement and Thermocouple Locations. K-type (chromel (Ni-Cr alloy)/alumel (Ni-Al alloy)) thermocouples of 0.315 mm wires diameter are used to measure the air and the heated plate temperatures at different locations. Before installing the thermocouples in place, they were calibrated under similar environmental conditions using a temperature calibrator for an accuracy of ±0.1°C. Twelve thermocouples are provided along the axial centre line of the absorber plate while twenty-four thermocouples were used to measure the spanwise variation of absorber plate temperature as shown in the Figure 5(a). Overall a total of thirty-six thermocouples are used to measure the temperature variation in the heated plate. After passing over the heated plate in the test section, the air enters to the 500 mm long exit section, at the end of which a baffled mixing chamber exists. It is expected that air will leave at nearly uniform temperature after passing through the mixing chamber. After the mixing section, five thermocouples are arranged spanwise to measure the outlet air temperature as shown in Figure 5(b) and one thermocouple at inlet section to measure the inlet air temperature as shown in Figure 5(c).

Location of thermocouples (a) on the absorber plate, (b) on the outlet section, and (c) on the inlet section.
(ii) Air Flow Measurement. The actual mass flow rate through the pipe is measured by using insertion-type thermal mass flow meter Model MMFC-100_2, operating temperature 0–120°C, and maximum flow range 9 kg/min, which first calibrated using a standard micromanometer with the help of pitot tube.
2.2. Experimental Procedure
Before starting the experiment, all the thermocouples were checked carefully so that they indicate the room temperature, the thermal mass flow meter for the measurement of mass flow rate of air through the duct, and the micromanometer for pressure drop measuring indicates zero. The test runs were conducted under steady-state conditions to collect relevant heat transfer and flow friction data. The steady-state condition was assumed to have been reached when the temperature at any location does not change for about 10 min. The first steady-state for each set of run was observed to arrive after about 1.5–2 hrs. When a change in the operating conditions is made, it takes 15–25 min to reach steady state. Seven values of flow rates (and hence Reynolds number) are used for each set of experiment at a fixed heat flux of the test. After each change of flow rate, the system was allowed to attain a steady state before the data were recorded.
The following parameters were measured during the experiments:
temperature of air at inlet and outlet,
temperature of the absorber plate,
mass flow rate of air,
pressure drop across the test section,
voltage and current supplied to the heating section.
2.3. Data Reduction
Steady-state values of the plate and air temperatures in the duct, at various locations for a given heat flux and mass flow rate of air, are used to determine the values of performance parameters.
(a) Mean Air and Plate Temperatures. The mean air temperature
The mean plate temperature can be found from weighted average of the temperature of all plate thermocouples.
(b) Velocity of Air through Duct. The velocity of air flowing through the duct is calculated from the knowledge of mass flow rate and area of flow as

(c) Equivalent Hydraulic Diameter. The hydraulic diameter of the rectangular section of the duct is defined as

(d) Reynolds Number. The Reynolds number of air flow in the duct is calculated from
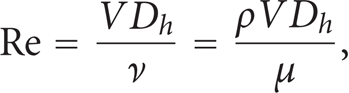
where ν is kinematic viscosity and μ is dynamic viscosity.
(e) Heat Transfer Coefficient. Steady-state values of the plate and air temperatures in the duct at various locations were used to determine the values of useful parameters, namely, heat supplied to the air “Q u ” and heat transfer coefficient “h” calculated as

where
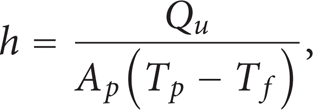
where A p is the effective heat transfer area of the absorber plate.
(f) Nusselt Number and Stanton Number. The convective heat transfer coefficient is then used to obtain Nusselt number, Nu, as

where k is thermal conductivity of air and
(g) Friction Factor. The friction factor is determined from the measured values of pressure drop, (ΔP) across the test section length;

where
From the analysis of uncertainties in the measurements by various instruments [16] the maximum uncertainties in the calculated values of various parameters are given below,
Reynolds number, Re=0.00938 = 0.938%,
useful heat gain, Q u = 0.0444 = 4.44%,
heat transfer coefficient, h=0.046 = 4.6%,
Nusselt number,
Stanton number,
friction factor, f=1.84%.
2.3.1. Validity Test for Smooth Duct
Prior to the actual data collection, the setup is checked by conducting experiments for smooth duct. The Nusselt number and friction factor determined from these experimental data are compared with the values obtained from the standard correlations like Dittus-Boelter equation [17] for the Nusselt number and modified Blasius equation [18] for friction factor as shown in the Figures 6 and 7, respectively.

Variation of Nusselt number with Reynolds number for smooth duct.
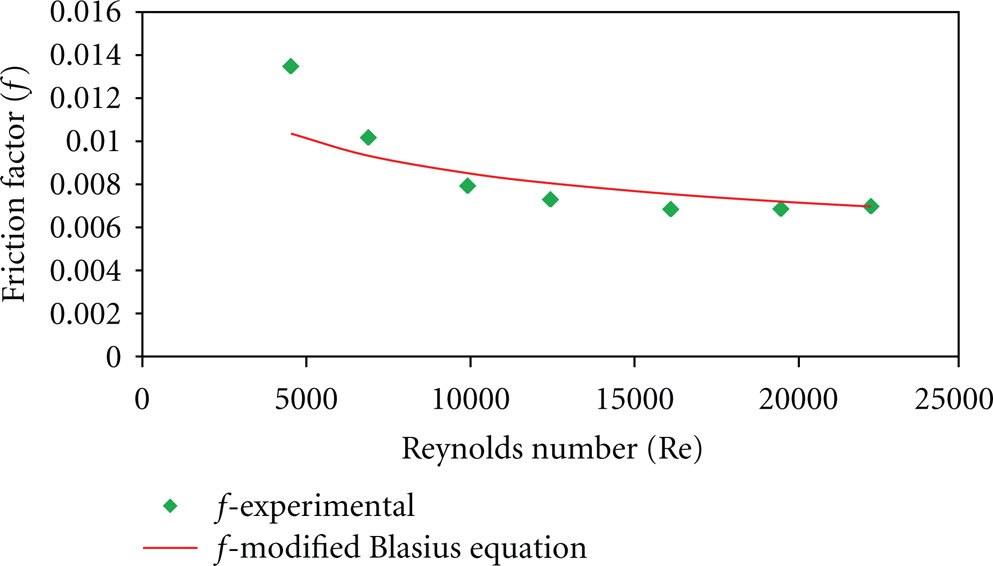
Variation of friction factor with Reynolds number for smooth duct.
Dittus-Boelter equation:

Modified Blasius equation:

The average absolute percentage deviation of the present experimental Nusselt number is 2.77% from the value predicted by (8), and the average absolute percentage deviation of the present experimental friction factor is 8.77% from the value predicted by (9) as shown in the Figures 6 and 7. Thus there is a good agreement between the predicted values and the experimental values of the Nusselt number and friction factor. This ensures the accuracy of the experimental data obtained from the present setup.
3. Results and Discussion
Figure 8 shows the variation of temperature of plate and air along the length of the test duct. The longitudinal distribution of air temperature has been represented as straight line connecting the measured mean values at the inlet and exit of the test section. This pattern of temperature variation is similar to that of [14, 15].

Plate and air temperature distributions along the length of the test duct.
The effects of flow and obstacle parameters on the heat transfer and friction characteristics for flow of air in a rectangular duct are observed. Results have also been compared with those of the smooth duct under similar flow and thermal boundary conditions to determine the enhancement in the heat transfer coefficient and friction factor.
When the fluid strikes with the obstacles some of the fluid will flow back causing the flow to separate near the obstacles and as the flow passes the obstacles some of the fluid will circulate back causing secondary flow to occur, and the fluid will reattach again after some flow length next to the obstacle. This causes vortex to be created next to the obstacles that will increase the turbulence intensity near the obstacle and allow more fluid to come and stay in contact with the heated plate (absorber plate) such that heat transfer to the fluid will be increased.
Figures 9(a) and 9(b) show the variation of Nusselt number for obstacled plate and smooth plate ducts as a function of Reynolds number for different values of relative obstacle height (e/H) and relative obstacle longitudinal pitch (

(a) Variation of Nusselt numbers with Reynolds number for different values of

(a) Variation of friction factor with Reynolds number for different values of
The values of Nusselt number were found to increase with increasing Reynolds number in all cases whereas the friction factor decreases with increase of Reynolds number as expected. It can also be seen from Figures (9(a): (i), (ii), (iii)) and Figures (10(a): (i), (ii), (iii)) that the values of both the Nusselt number as well as the friction factor are getting higher as relative obstacle height (e/H) increase from 0.25 to 0.75 for all relative obstacles longitudinal pitch (P l /e) and Reynolds number. “This is due to the fact that an increase in obstacles height increases the air flow blockage and results in higher turbulence as well as higher the heat transfer coefficient.”
Likewise Figures (9(b): (i), (ii), (iii)) and Figures (10(b): (i), (ii), (iii)) show that the Nusselt numbers as well as the friction factors are getting higher as relative obstacles longitudinal pitch (P l /e) decreases from 11/2 to 3/2 for all relative obstacle height (e/H) and Reynolds number because as the relative obstacles longitudinal pitch (P l /e) decrease there are more numbers of rows of obstacles for the same absorber plate length such that the number of obstacles increases creating more turbulence that will increases the heat transfer coefficient and simultaneously the friction factor also increases because of the increase in air flow blockage.
In all the cases, the rate of increase in both heat transfer and friction factor is very high for
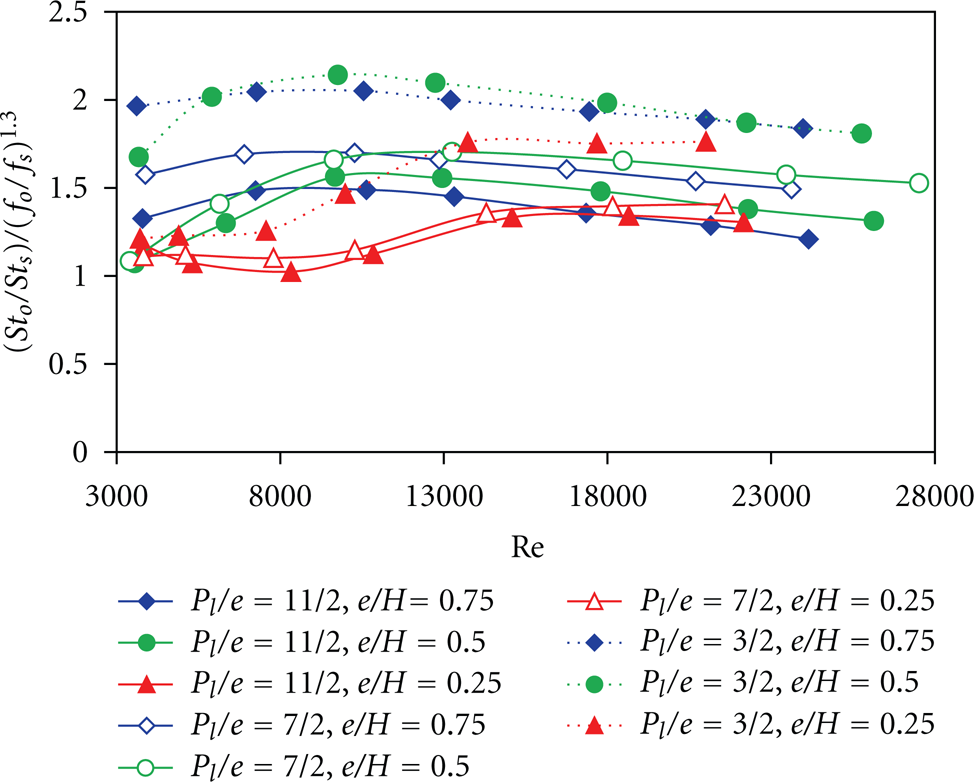
As shown in Figures 11 and 13 for e/H=0.50 and

Enhancement ratio as a function of Reynolds number.
The maximum enhancement in heat transfer and pressure drop penalty is obtained for P l /e=3/2 and e/H=0.75 for whole range of Reynolds number whereas the thermohydraulic performance curve (Figure 13) shows the maximum overall thermohydraulic performance is obtained for P l /e=3/2 and e/H=0.50.
Further, from Figures 11 and 12 it has been observed that as the relative obstacle longitudinal pitch, (P l /e) decreases from 11/2 to 3/2 the heat transfer enhancement as well as friction penalty increase for all relative obstacles height. This is because of the fact that as the relative longitudinal pitch of the obstacle decreases there are more numbers of obstacles on the same length of the heated plate so that the turbulence intensity as well as air flow blockage increase resulting in an increase in heat transfer enhancement and friction factor penalty, respectively.

Friction factor ratio as a function of Reynolds number.
Variation of thermohydraulic performance parameter with Reynolds number.
The effect of relative obstacles height (e/H) on the heat transfer enhancement is negligible for relative obstacles longitudinal pitch (P l /e) = 11/2 at higher Reynolds number whereas for P l /e=7/2 and P l /e=3/2 the enhancement in heat transfer is increasing with an increase in relative obstacles height. The friction factor ratio increases with an increase in relative obstacles height (e/H) for all relative obstacles longitudinal pitch (P l /e).
4. Conclusion
An experimental study of the flow of air, in a rectangular duct with delta shaped obstacles mounted on one wall subjected to uniform heat flux and with remaining three smooth insulated walls, has been performed. The conditions and geometrical configuration correspond to the flow in the actual solar air heater duct.
Investigations have been carried out over a wide range of Reynolds number (Re=3400–27,600) and results have been compared with those of a smooth duct under similar flow conditions to determine enhancement in heat transfer coefficient and friction factor.
Following conclusions can be drawn:
the effect of Reynolds number, relative obstacle height (e/H), and relative obstacle longitudinal pitch (P l /e) on the heat transfer coefficient and friction factor has been studied for a fixed value of relative obstacle transverse pitch (P t /b) = 7/3.
Thermal performances of such collectors have been found superior to that of smooth ones for the same operating parameters. However, pressure drop increases in such collectors.
Obstacle longitudinal pitch strongly affects the flow pattern and hence the performance of the duct.
The maximum enhancement in Nusselt number compared to that of smooth duct is obtained for P l /e=3/2, e/H=0.75 at Reynolds number Re=7276.82 and is of the order of 3.6.
The maximum thermohydraulic performance is obtained for P l /e=3/2, e/H=0.50 at Reynolds number Re=9757.38, and its value is of the order of 2.14.
The obstacle geometry chosen shows an appreciable heat transfer enhancement.
In general, it can be said that for all the relative height and any arrangement of obstacles, the enhancement of heat transfer is caused due to the increased turbulence and also due to the secondary flow of air produced along the obstacles, which carry the heated air away from the plate surface.