
Abstract
Turbulent forced convection flow of a water-Al2O3 nanofluid in a circular tube subjected to a constant and uniform temperature at the wall is numerically analyzed. The two-phase mixture model is employed to simulate the nanofluid convection, taking into account appropriate thermophysical properties. Particles are assumed spherical with a diameter equal to 38 nm. It is found that convective heat transfer coefficient for nanofluids is greater than that of the base liquid. Heat transfer enhancement is increasing with the particle volume concentration and Reynolds number. Comparisons with correlations present in the literature are accomplished and a very good agreement is found with Pak and Cho (1998). As for the friction factor, it shows a good agreement with the classical correlation used for normal fluid, such as Blasius formula.
1. Introduction
In a thermal system, convective heat transfer rate can be enhanced passively by changing flow geometry, boundary conditions, or by improving thermophysical properties, for example, enhancing fluid thermal conductivity. Suspending small solid particles in a fluid represents an innovative way to improve its thermal conductivity.
First studies on possibility of increasing thermal conductivity of a solid-liquid mixture by adding more volume fraction of solid particles were in Maxwell [1, 2]. Several investigations revealed that the thermal conductivity of the nanoparticles suspension could be increased by more than 20% for the case of very low nanoparticles concentrations [3–10].
Different concepts and models have been proposed to explain the enhancement in heat transfer [8, 11–14]. Theoretical and experimental investigations have been accomplished to estimate the effective thermal conductivity of nanofluids. Some experimental studies [15, 16] show that the measured thermal conductivity of nanofluids is much larger than the classical theoretical predictions [17]. Other experimental investigations [18, 19] found that the thermal conductivity has not shown any anomalous enhancement, and for lower volume fractions the results agree well with the classical equations [17, 20]. Many attempts have been made to formulate efficient theoretical models for the prediction of the effective thermal conductivity, but there is still a lack on this topic [21–23].
Relatively few theoretical and experimental investigations have been reported on convective heat transfer in confined flows, as also reviewed in [7–9, 24]. Experimental results are provided for convective heat transfer of nanofluids laminar and turbulent flow inside a tube in [11, 25–30].
Furthermore, a number of numerical studies dealt with laminar and turbulent convection. Basically there are two approaches to simulate nanofluids convection, the first approach consists of the single-phase model where the fluid with the suspended nanoparticles is assumed to be continuous, while the second approach uses a two-phase model in order to get a better description of the mixture taking into account the interactions between the liquid and the nanoparticles. The single-phase model with physical and thermal properties-all assumed to be constant with temperature was, employed in [31–34]. It represents the simplest way to treat numerically the nanofluids, anyway this method was successfully validated with experimental data.
A numerical study on fully developed laminar mixed convection of a nanofluid consisting of water and Al2O3 in a horizontal curved tube was carried out in [35]. Three-dimensional elliptic-governing equations were used and the single phase model was employed. It was found that the nanoparticles volume fraction does not have a direct effect on the secondary flow, axial velocity, or the skin friction coefficient. For a given Reynolds number, a negative effect of buoyancy force on the Nusselt number was obtained while the nanoparticles concentration had a positive effect on the heat transfer enhancement and also on the skin friction reduction. The two-phase approach seems a better model to describe the nanofluid flow. In fact, the slip velocity between the fluid and particles may not be zero [11] due to several factors such as gravity, friction between the fluid and solid particles and Brownian forces, and the phenomena of Brownian diffusion, sedimentation, and dispersion. The two-phase approach provides a field description of the dynamics of each phase or, alternatively, the Lagrangian trajectories of individual particles coupled with the Eulerian description of the fluid flow field [36, 37]. Recently, a single- and two-phase model was employed with either constant or temperature-dependent properties [38]. The results for the two-models were quite similar, so the simpler model may be employed. Quite recently, a two phase mixture model was applied to study the turbulent forced convection flow of a nanofluid in a uniformly heated tube [39]. The comparison of calculated results with experimental values shows that the mixture model is more accurate than the single-phase model.
In the present paper, developing turbulent forced convection flow of Al2O3/water nanofluid in circular tube is numerically investigated. Steady state of a two-dimensional axial symmetric flow is considered and the channel is heated at uniform wall temperature. Alumina particles have a spherical size of 38 nm diameter.
The finite volume method is employed to solve the problem and the two phase approach is used to evaluate the developing forced convection flow. The obtained results are presented in terms of temperature distributions, local and average heat, mass transfer coefficients, and Nusselt number profiles.
2. Mathematical Modelling
Figure 1 shows the considered geometrical configuration. It consists of a tube with length (L) of 1.0 m and circular section with the diameter (D) equal to 0.01 m.

Schemae of the configuration under investigation.
The considered nanofluid is a mixture composed of water and particles of Al2O3, with a diameter of 38 nm. The fluid enters with uniform temperature, T0 = 293 K, and velocity profiles at the inlet section and the tube length is appropriate in order to obtain fully developed profiles (of velocity and temperature) at the outlet section. The condition of uniform wall temperature is considered and the flow and the thermal field are assumed to be symmetrical with respect to the vertical plane passing through the tube main axis, so half tube is considered, in order to save computational time without loosing in accuracy.
2.1. Governing Equations
The two-phase mixture model is employed to analyze the thermal and fluid dynamic behavior of the considered nanofluid.
In the mixture model the fluid is considered to be a single fluid with two phases and the coupling between them is strong [39]. But each phase has its own velocity vector and within a given control volume there is a certain fraction of each phase.
One of the major issues in these simulations is found to be the evaluation of nanofluid thermophysical properties in general and viscosity and thermal conductivity in particular, because the use of classical models is questionable for nanofluids. On the other hand, too few experimental data on nanofluids are available to build new models.
The following formulation represents the mathematical description of the mixture model governing equations [39, 40].
Conservation of mass:

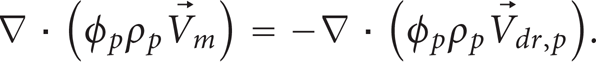
Conservation of momentum:

where
Volume fraction:
Conservation of energy:

Compression work and the viscous dissipation are assumed negligible in the energy equation (4).
In the equation of the conservation of momentum, (2),

The slip velocity (relative velocity) is defined as the velocity of secondary phase (p) relative to the velocity of the primary phase (f)

The drift velocity is related to the relative velocity

The relative velocity, determined from (5) proposed by Manninen et al. [41] while from (6) by Schiller and Naumann [42] is used to calculate the drag function fdrag


The acceleration in (8) is

2.2. Turbulence Modeling
To close the governing equations of the thermofluid dynamics field. Experimental data or approximate models are necessary to close the governing equations of thermofluid dynamics fields in turbulence phenomena.
In the present work, the k-ε model proposed by Launder and Spalding [43] is considered. The k-ε model introduces two new equations, one for the turbulent kinetic energy and the other for the rate of dissipation. The two equations can be expressed in the following form:


where
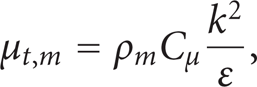

with
2.3. Boundary Conditions
At the channel inlet profiles, uniform axial velocity V0 and temperature T0 = 293 K are assumed. Moreover, a constant intensity turbulence, equal to 1%, is imposed. At the channel exit section, the fully developed conditions are considered, that is to say that all axial derivatives are zero. On the channel wall, the non-slip conditions and a uniform temperature of 350 K are imposed, while both turbulent kinetic energy and dissipation of turbulent kinetic energy are equal to zero. Moreover, flow and thermal fields are assumed symmetrical with respect to the axial plane.
2.4. Nanofluids Physical Properties
The most difficult problem in nanofluids simulation is represented by the evaluation of thermophysical properties, particularly viscosity and thermal conductivity, because it is not clear if classical equations give reliable results. But on the other hand, too few experimental data are available to build new models [40].
In the present paper, the following equations are considered to evaluate Al2O3/water nanofluid thermophysical properties:


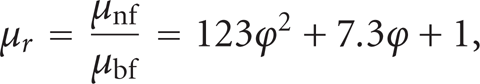
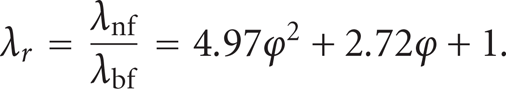
Equations (15) and (16) are based on the classical theory of two-phase mixture and given in [25, 31–33, 39, 40]. Equation (16) was first employed in [25] and then utilized in many different papers [31–33, 38, 40]. Another formulation of specific heat, based on heat capacity concept, is present in literature, see for example [46]. The two formulations may, of course, provide some differences for specific heat values, but due to the lack of data both formulations can be considered equivalent, as observed in [47]. Equation (17) was proposed in [31–33, 48] and obtained as a result of a least square curve fitting of available experimental data [14, 49, 50] for the considered mixture. As for thermal conductivity, (18) was obtained in [31–33] using the well-known model proposed by Hamilton and Crosser [17], assuming spherical particles. Such a model, which was first developed on data from several mixtures containing relatively large particles, that is, millimeter and micrometer size particles, is believed to be acceptable for use with nanofluids, although it may give underestimated values of thermal conductivity. The equations employed to evaluate thermophysical properties are also appropriate for turbulence flow without any modification [39, 51].
In the present paper the thermo-physical properties considered for Al2O3 are [48]

and those of base fluid are

It should be underlined that the assumption of thermo-physical properties constant with temperature may determine some error in the numerical results, mainly with respect to the viscosity. In fact, it changes by a factor of 2 from 293 K to 350 K.
2.5. Numerical Method and Validation
The computational fluid dynamic code FLUENT [52] was employed to solve the present problem. The governing equations (1)–(4) were solved by control volume approach. This method is based on the spatial integration of the conservation equations over finite control volumes, converting the governing equations to a set of algebraic equations. The algebraic “discretized equations” resulting from this spatial integration process were sequentially solved throughout the physical domain considered. FLUENT [52] solves the systems resulting from discretization schemes using a numerical method. The residuals resulting from the integration of the governing equations (1)–(4) are considered as convergence indicators.
In order to ensure the accuracy as well as the consistency of numerical results, several nonuniform grids have been submitted to an extensive testing procedure for each of the cases considered.
Preliminary tests were carried out to test the accuracy of the numerical solution. To this scope four different grids were compared in terms of Nusselt number and the relative errors are reported in Table 1.
Differences in terms of Nusselt number among the different tested grids. Grid “1” has 5×6×200 elements, respectively on the radius, circumference, and longitudinal axis, grid “2” 10×12×400 elements, grid “3” 20×24×400 elements, and grid “4” 20×24×800 elements.

Results have shown that, for the problem under consideration, the 20 × 24 × 400 non-uniform grid “3” appears to be satisfactory to ensure the precision of numerical results as well as their independency with respect to the number of nodes used. Such grid has, respectively, 20, 24, and 400 nodes along the radial, tangential, and axial directions, with highly packed grid points in the vicinity of the tube wall and especially at the entrance region.
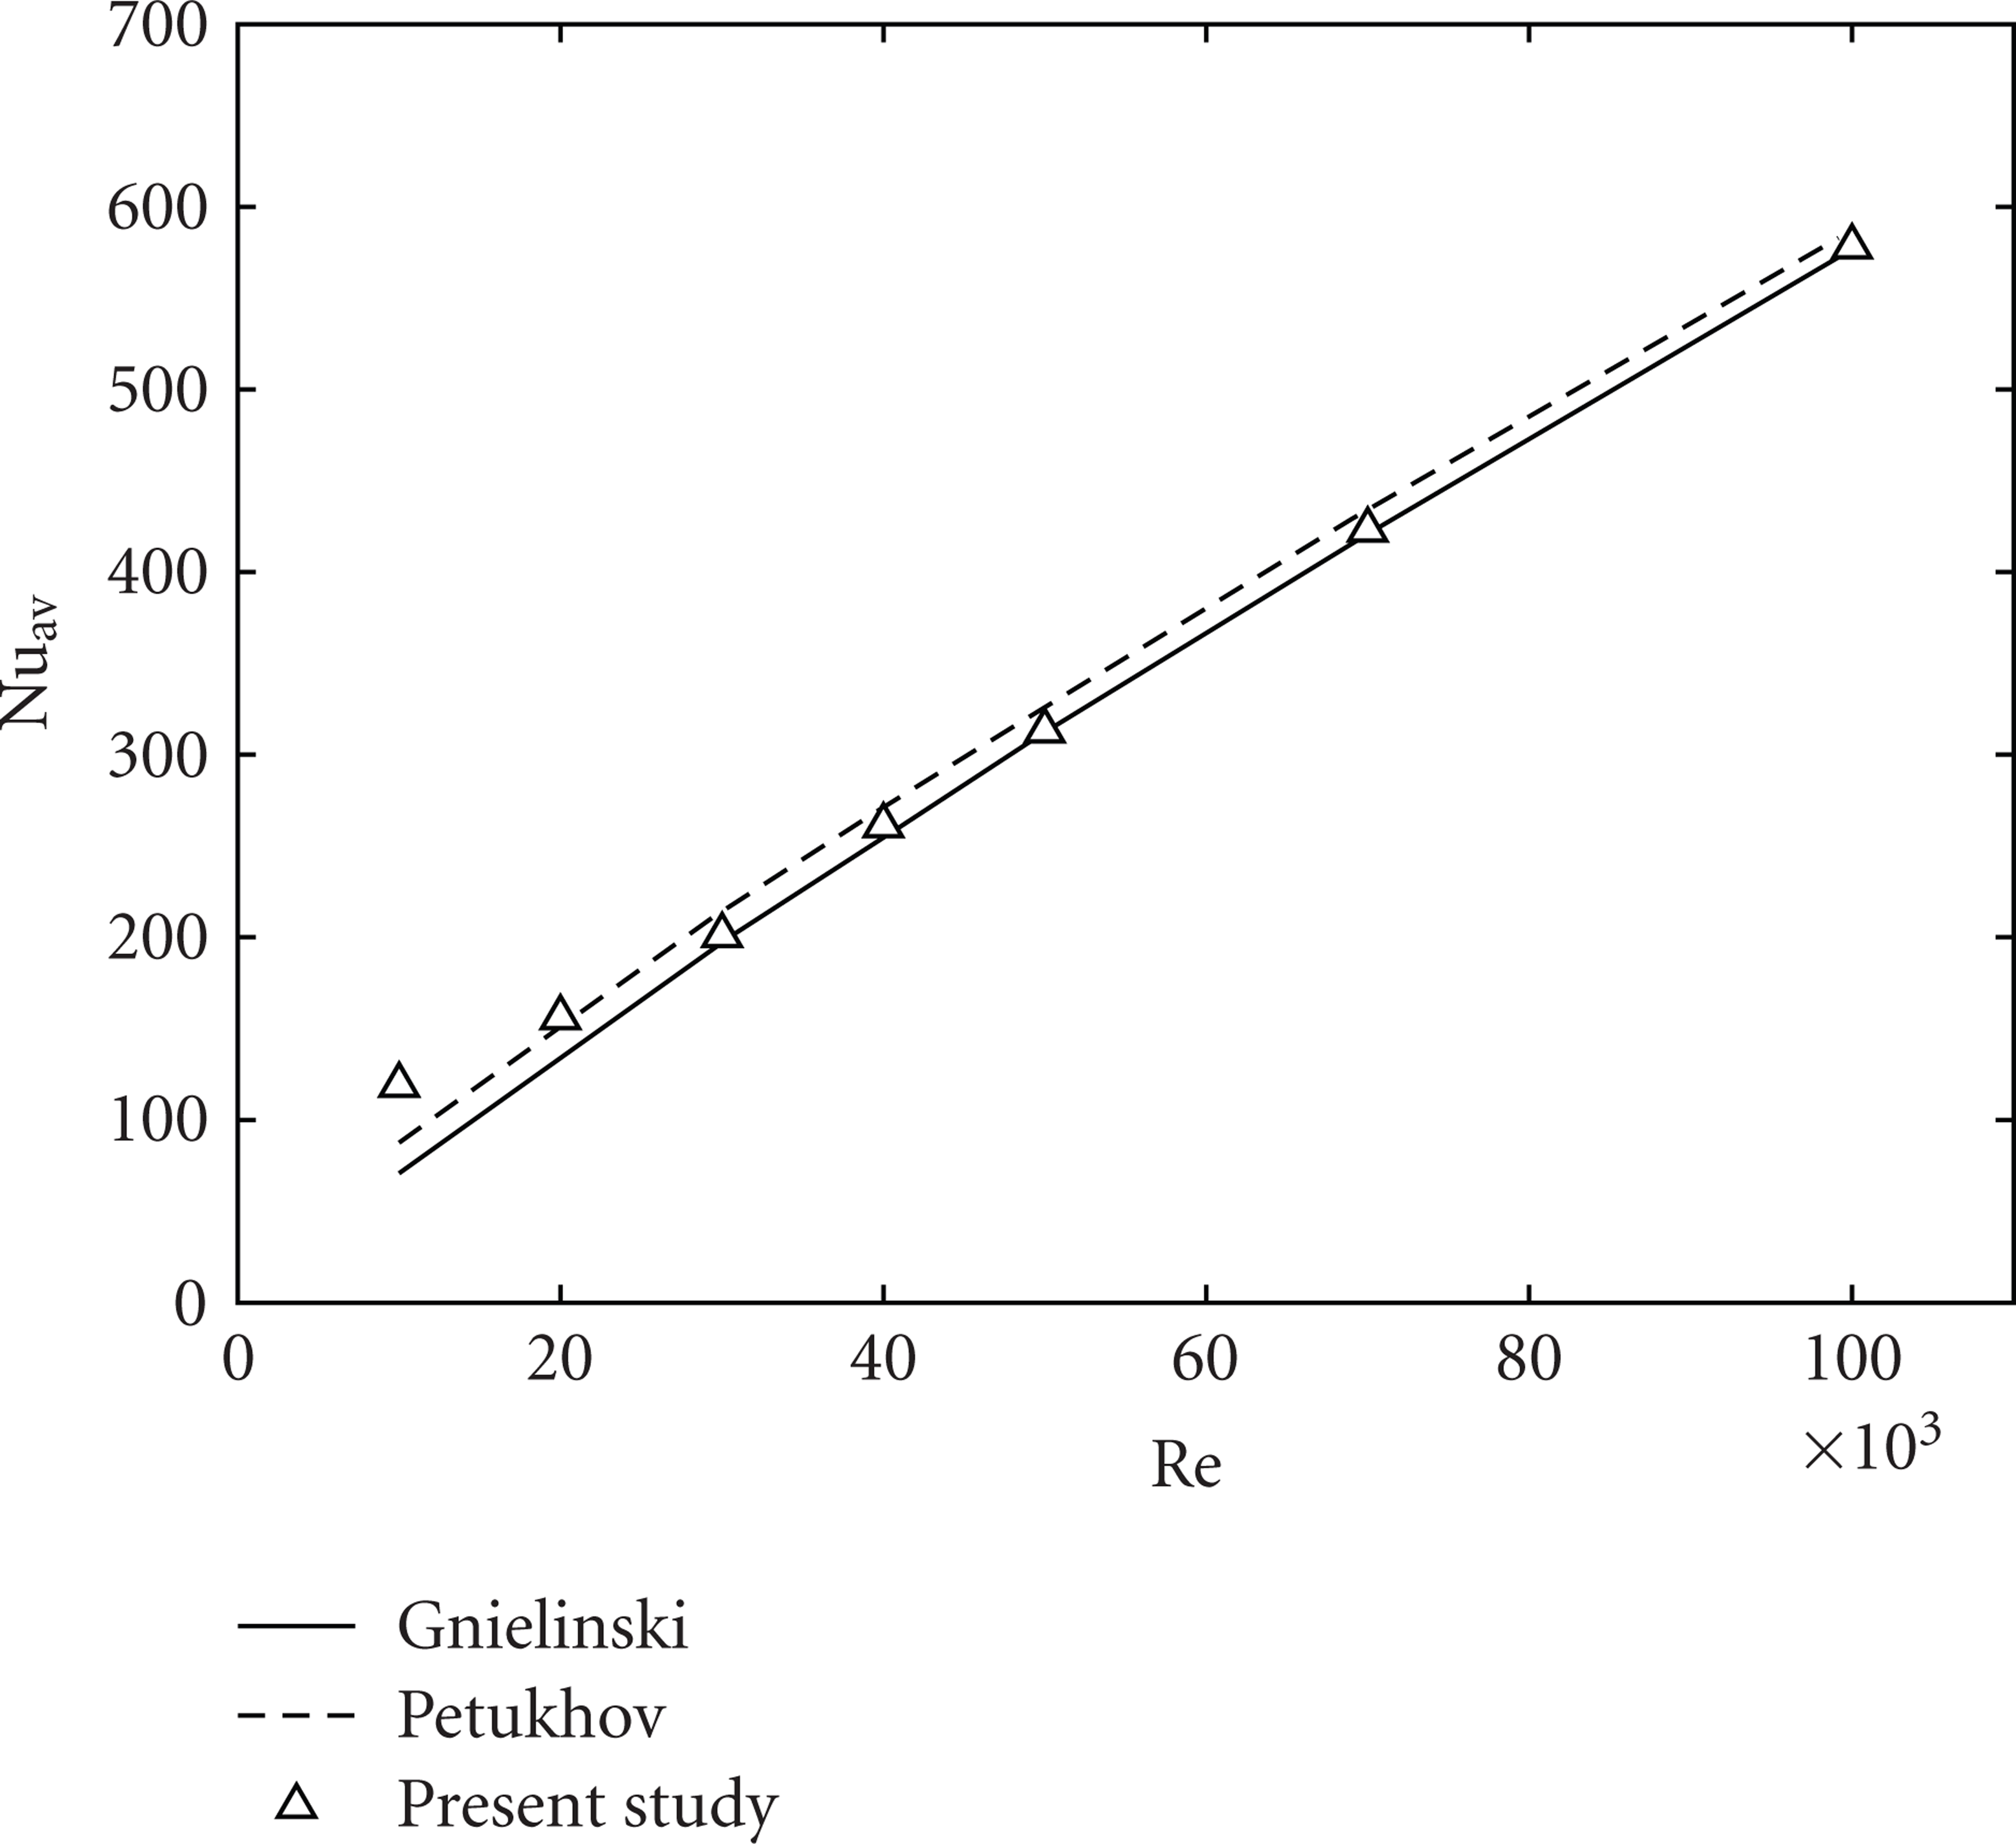
The computer model has been successfully validated with correlation reported in [44, 45] for thermally and hydraulically developing flow with uniform heat flux on the wall, showing an average error of 3%, as reported in Figure 2.
3. Results
Investigations were carried out employing the two-phase mixture model, for concentration ϕ = 0%, 1%, 4%, and 6% and an imposed uniform wall temperature T w = 350 K.
Heat flux profiles on tube wall are reported in Figure 3 for ϕ = 4% and several values of Reynolds number, Re = 2.0 × 10⁴, 4.0 × 10⁴, 6.0 × 10⁴, and 8.0 × 10⁴. Heat flux profiles are decreasing due to the heating of the fluid along the tube and their slope are nearly independent on the Reynolds number. The increase of local heat flux with respect to an increase of the Reynolds number is almost linear.
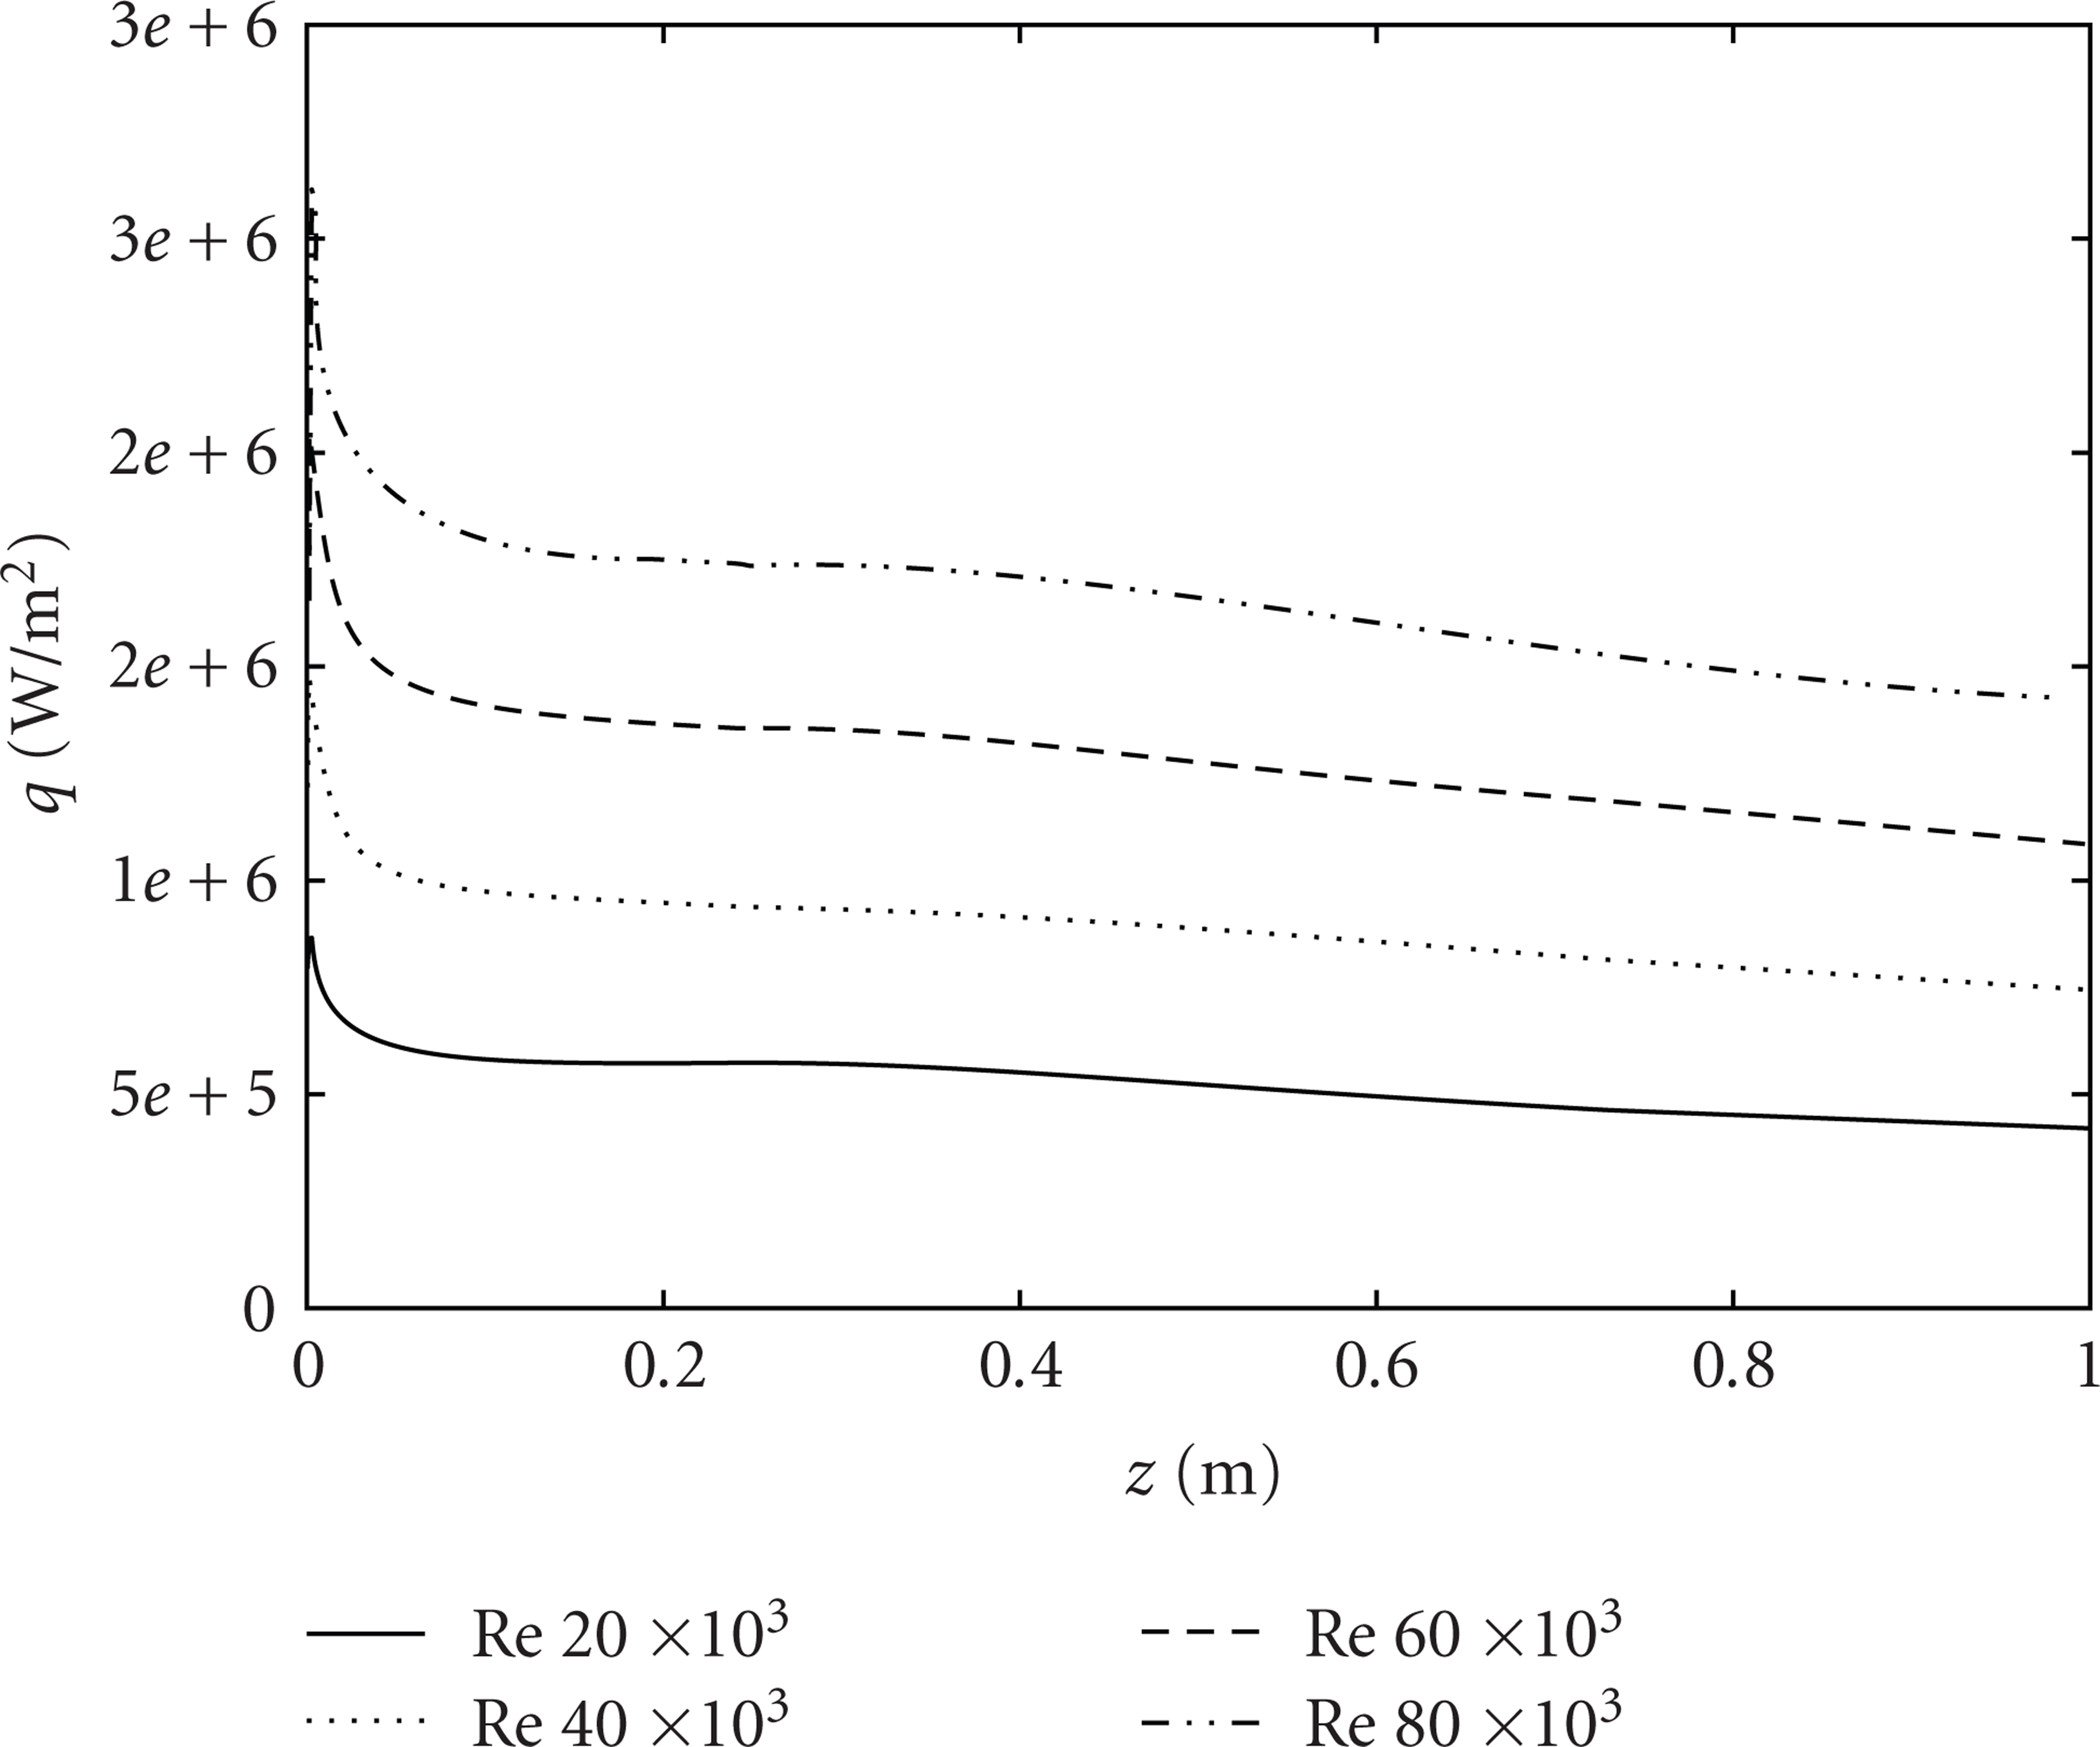
Heat flux for ϕ = 4% and several Reynolds numbers.
The development of the axial velocity along the tube centreline for ϕ = 4% and Re from 1.0 × 10⁴ to 5.0 × 10⁴ is shown in Figure 4. The results suggest the existence of a fully developed region for z/D = 30, for Re equals to 1.0·104, and 2.0·104, whereas in the other cases the developing length is equal to about z/D = 40. It is noted that, immediately after the tube inlet, the boundary layer growth pushes the fluid towards the centreline region, causing an increase of the centreline velocity in accordance with [39]. As the Reynolds number increases, the velocity maximum point moves further downstream, because the increase of axial momentum transports the generated turbulence in the flow direction. After the maximum point, the velocity at the centreline decreases in order to satisfy the continuity equation. Moreover, it is interesting to note that the maximum and fully developed values of the nondimensional centreline velocity decrease as Reynolds number increases. This effect is due to the fact that the corresponding velocity profiles become more uniform as Re increases.

Axial profiles of centreline velocity referred to the average velocity for ϕ = 4% and different Re values.
Figure 5 presents bulk temperature along tube axis for ϕ = 4% and several values of Reynolds number. The profiles are linear and their slopes depend on Reynolds number value. The effect of Reynolds number is strong passing from Re = 2.0 × 10⁴ to Re = 4.0 × 10⁴ and becomes weaker for higher values.
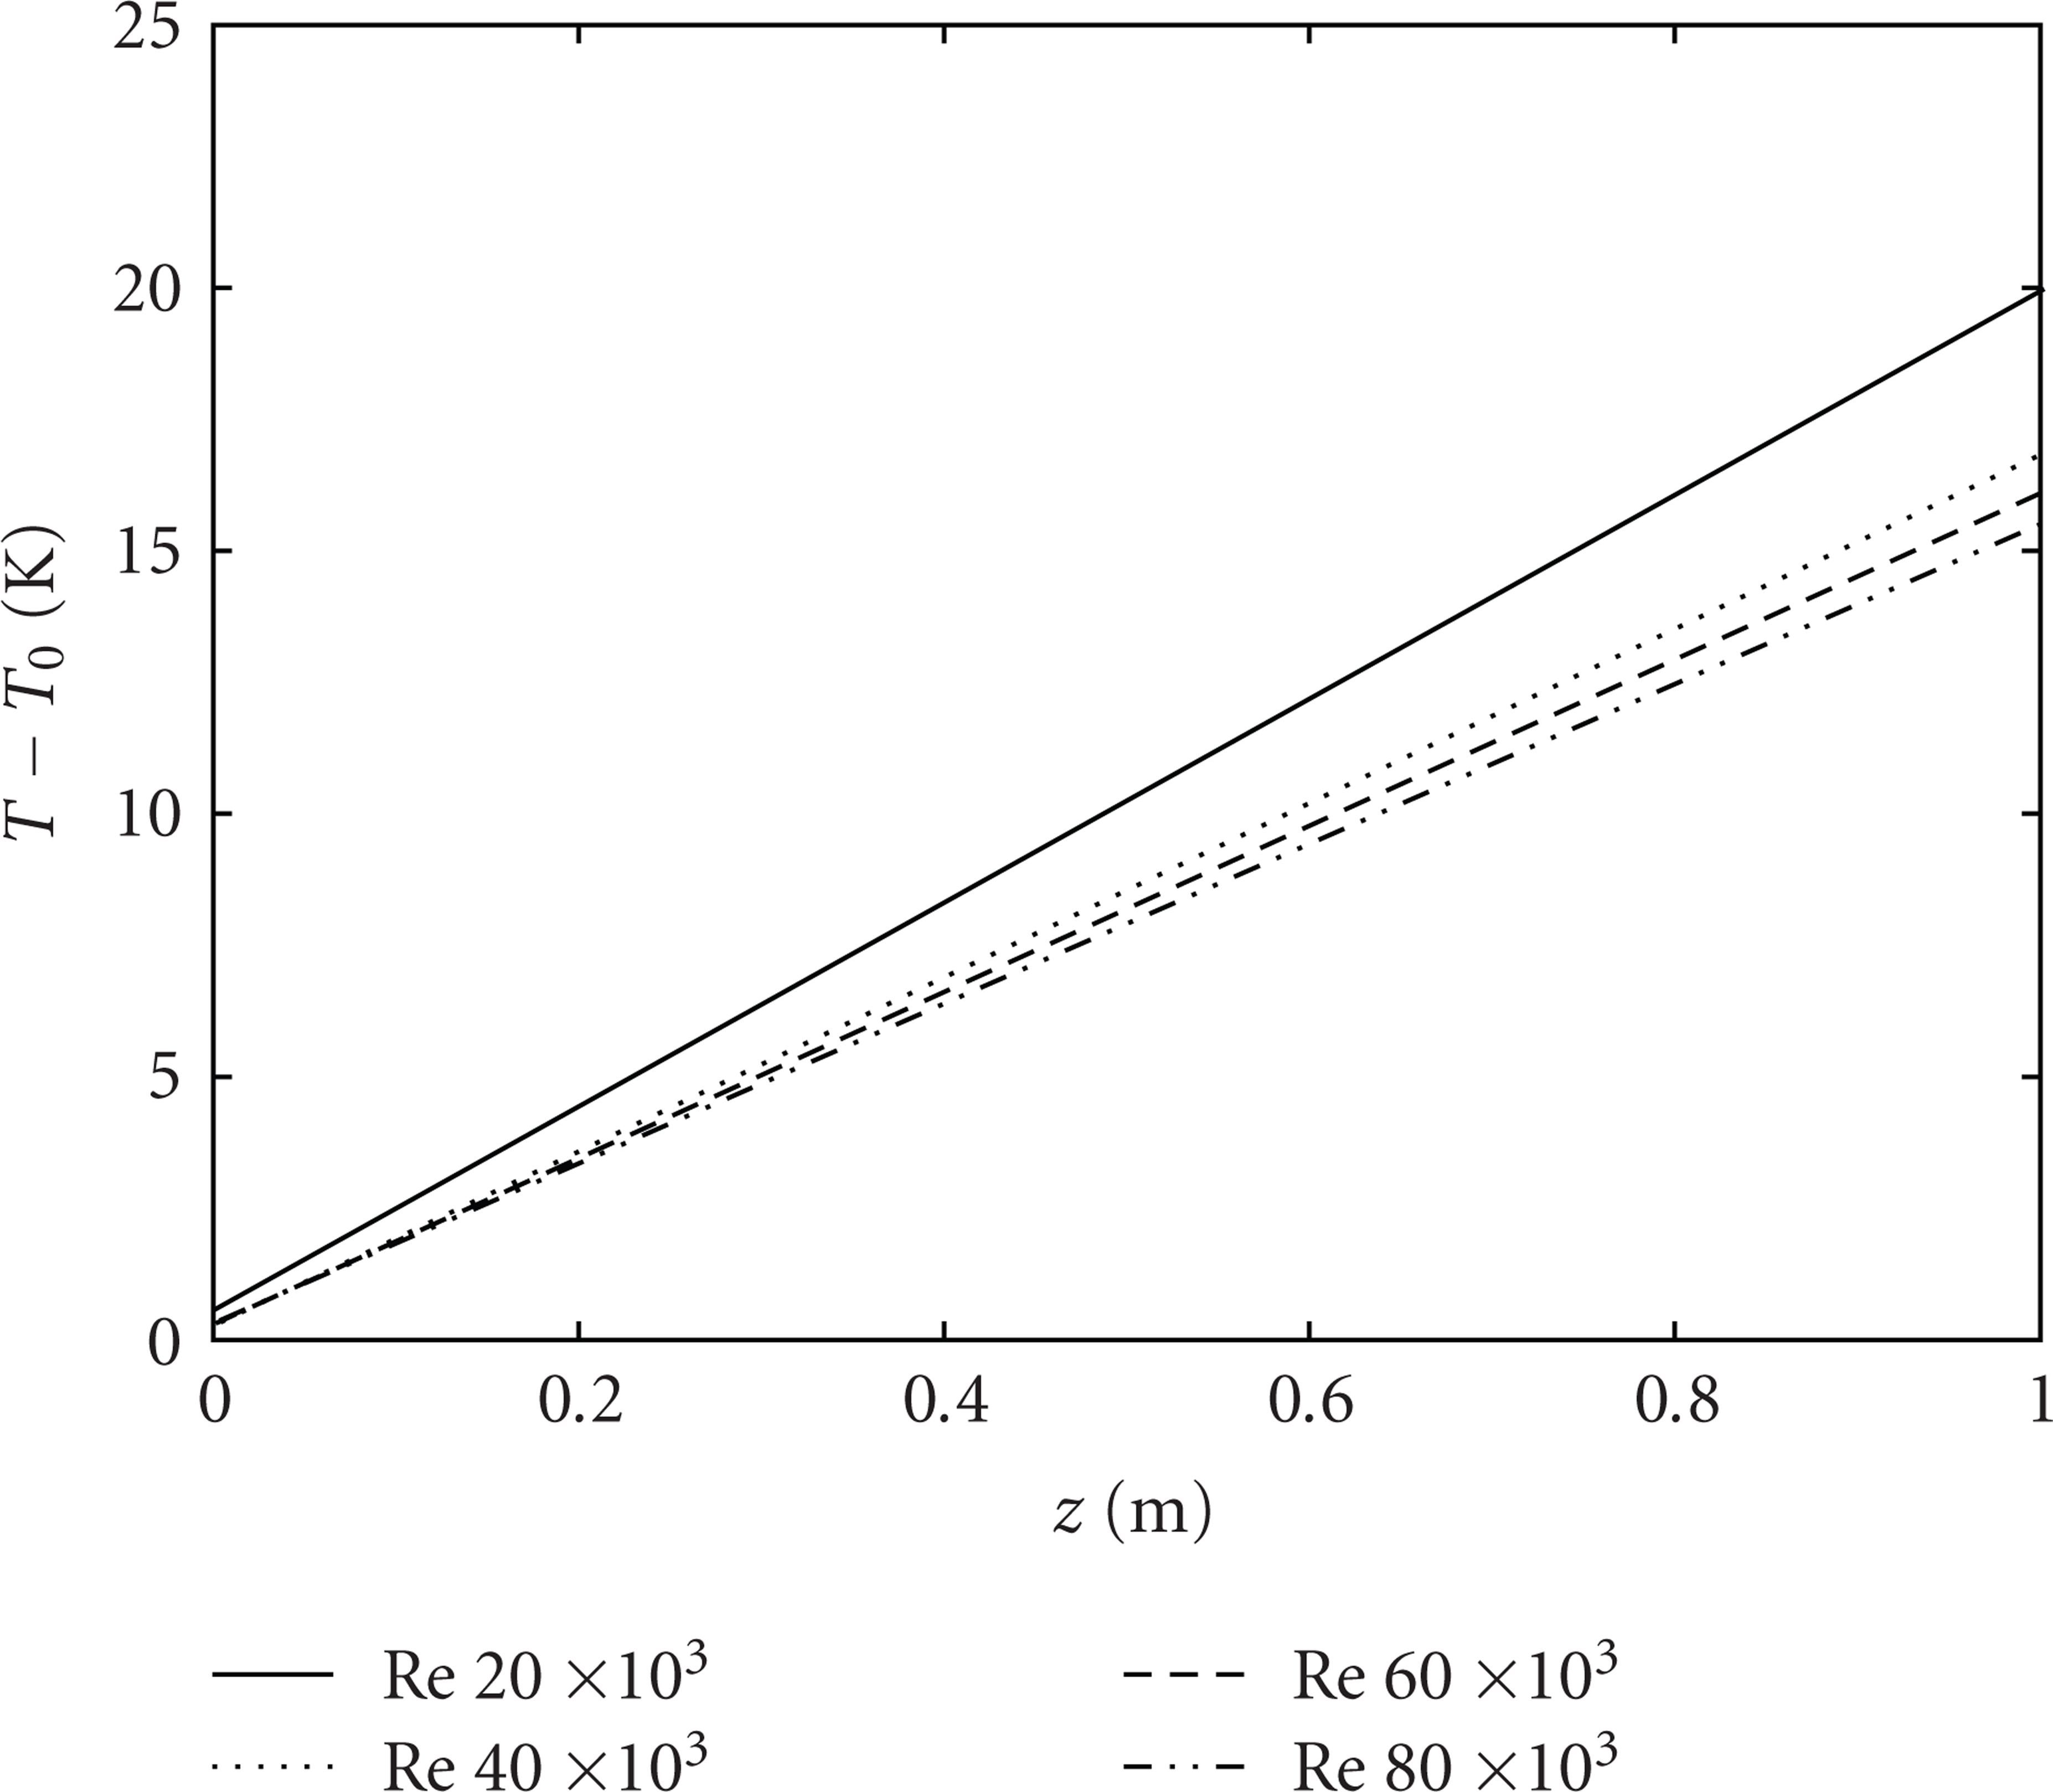
Profiles of bulk temperature along tube axis for Re = 4.0 × 10⁴ and several concentrations.
The dependence of particle volume concentration on wall heat flux is reported in Figure 6 for Re = 4.0 × 10⁴. It is very clear that the beneficial effect due to nanoparticles presence is due to the improvement of thermal proprieties of the mixture, whereas the additional effects such as gravity, drag on the particles, diffusion, and Brownian forces can be negligible in turbulent flows. Wall heat fluxes at z/L = 1 for ϕ = 1%, 4%, and 6% are higher than that for the base fluid of 4%, 24%, and 41%, respectively.

Heat flux for Re = 4.0 × 10⁴ and several concentrations.
As a consequence of the heat transfer enhancement, bulk temperature decreases with particle volume concentration, as shown in Figure 7, passing at z/L = 1 section from 311 K for ϕ = 0% to 309 K for ϕ = 6%.
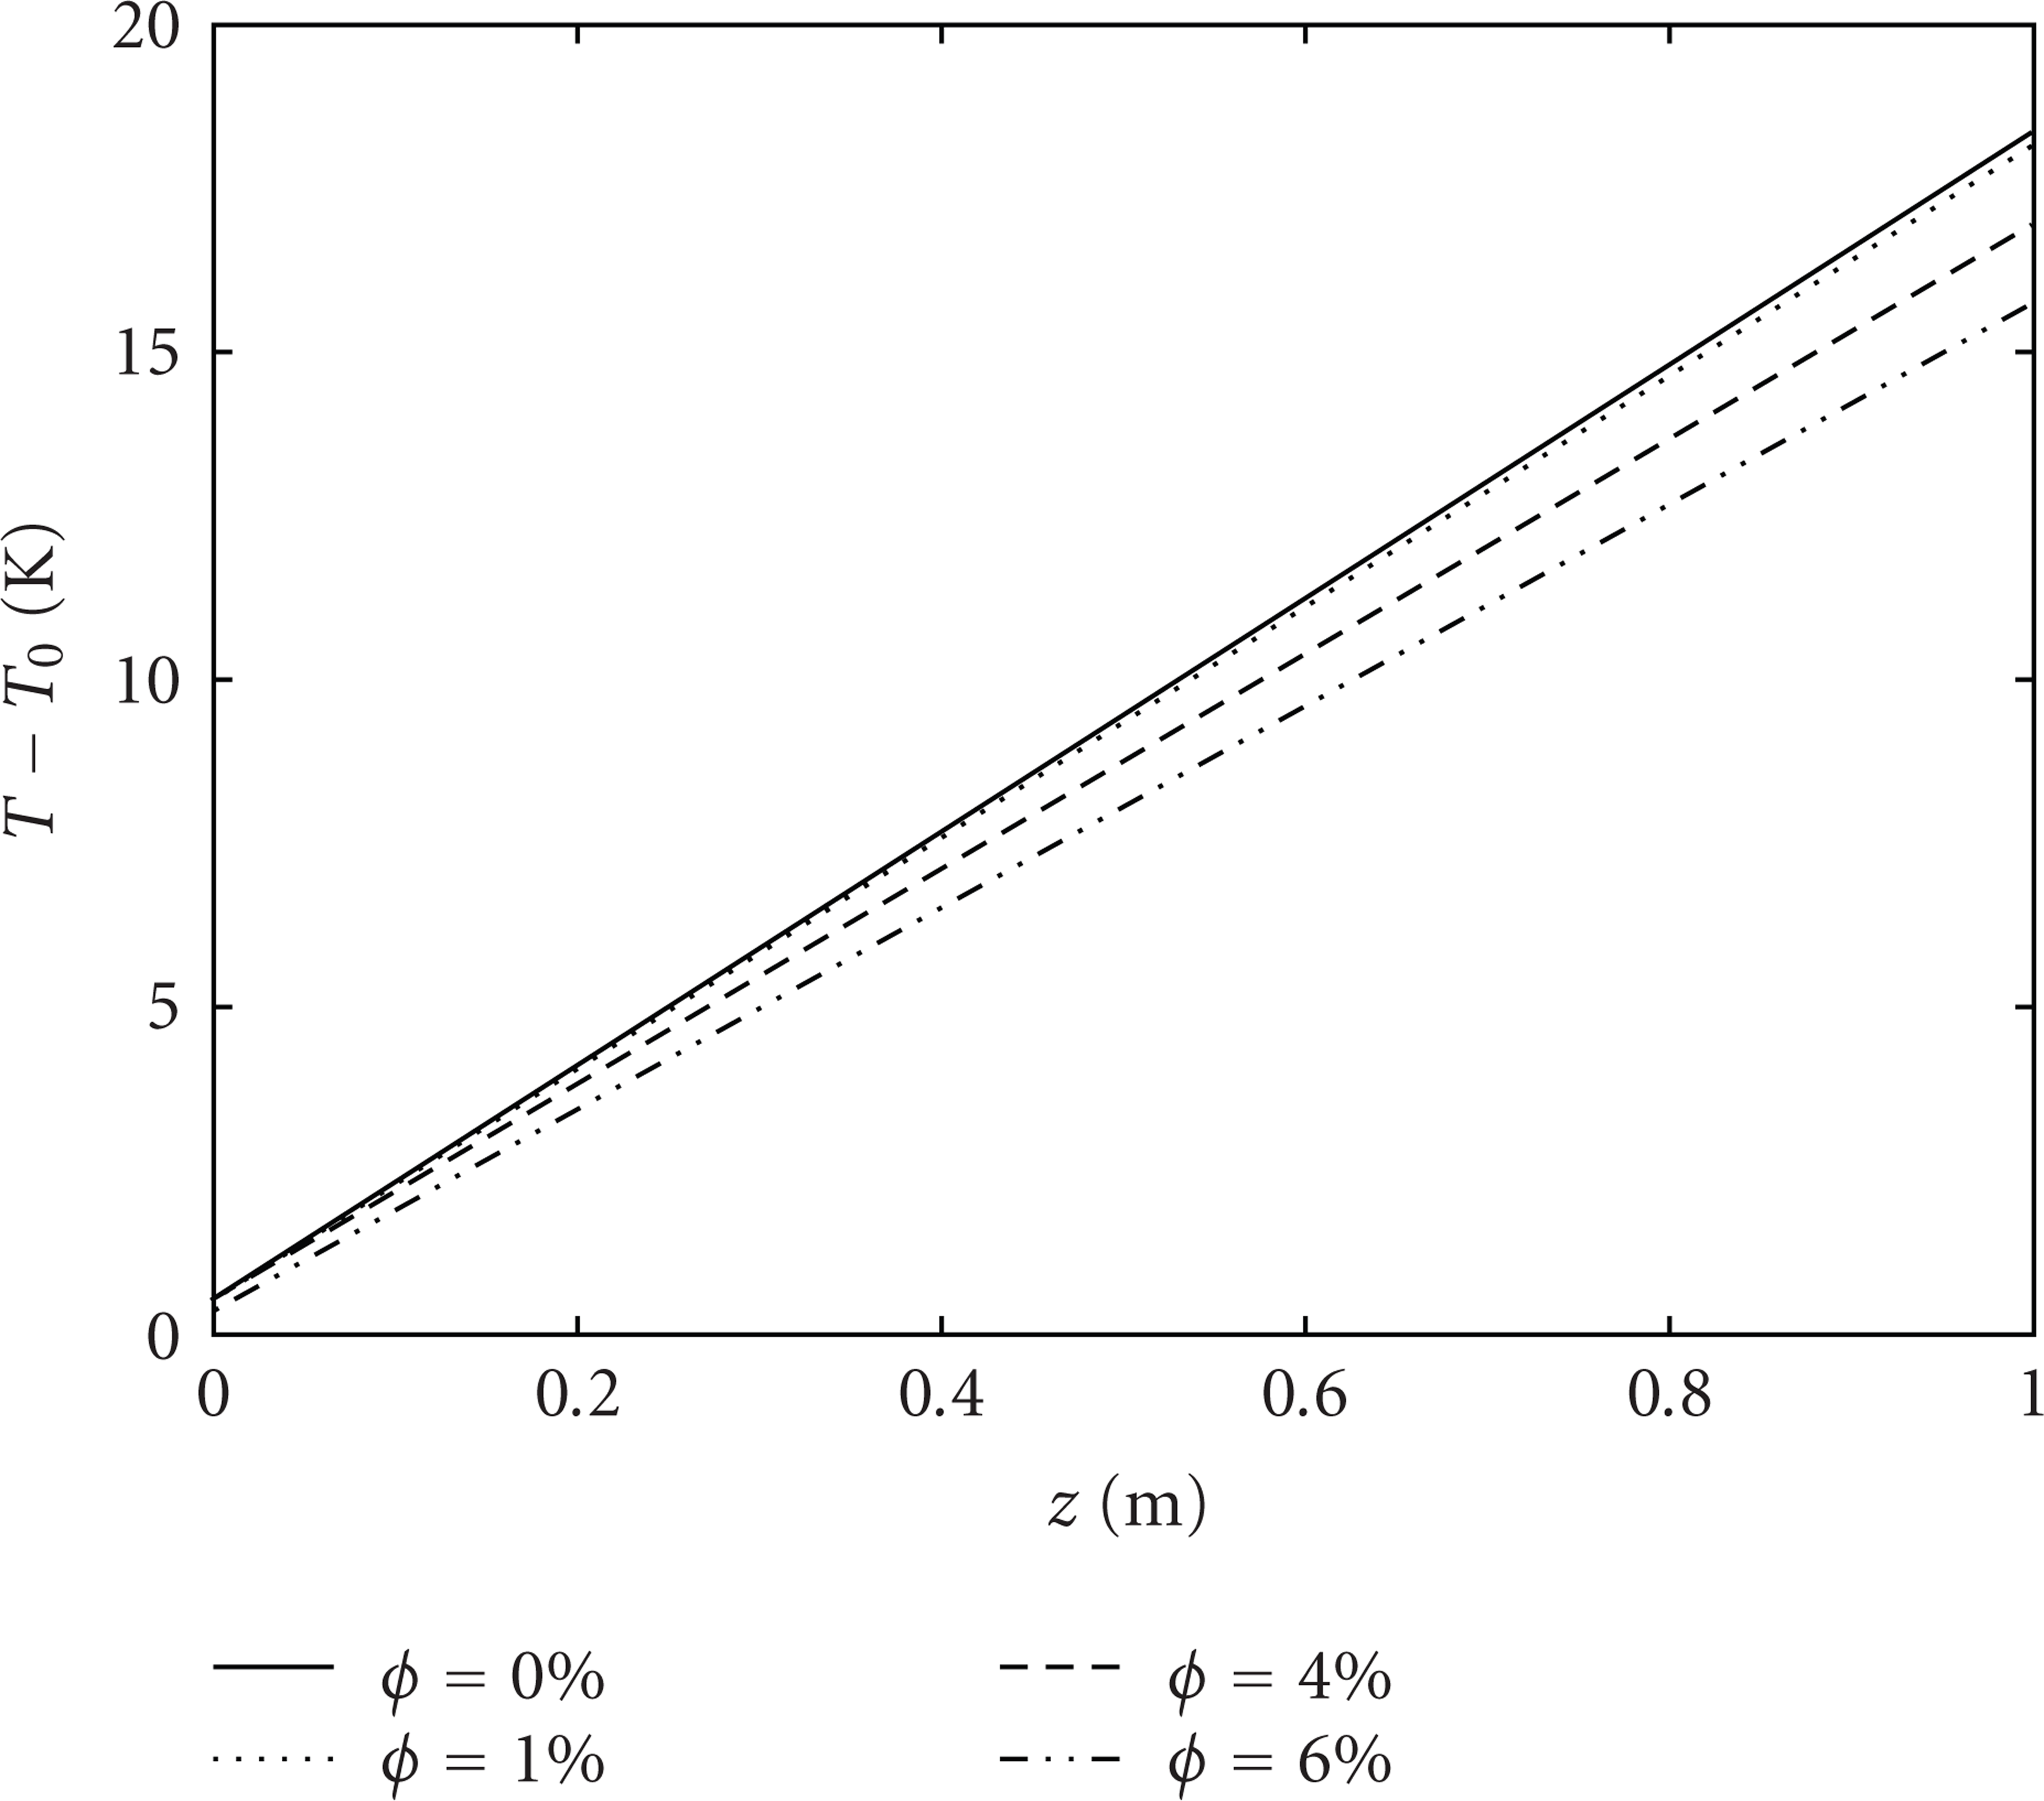
Profiles of bulk temperature along tube axis for Re = 4.0 × 10⁴ and several concentrations.
In Figure 8 radial temperature profiles at z/L = 1 for Re = 4.0 × 10⁴ are reported for the investigated particle volume concentrations. For all concentration values, temperature is slightly dependent on position except when close to the tube wall. When concentration increases, temperature decreases. Furthermore, the difference between temperature values for base fluid and nanofluids increases as r increases, indicating again an augmentation in heat transfer.

Profiles of temperature along tube radius at z/L = 1 for Re = 4.0 × 10⁴ and several concentrations.
The increase of the total heat transfer rates with the use of suspended nanoparticles is accompanied by an increment of the corresponding wall shear stress. A comparison between the friction factor determined from the Blasius relation
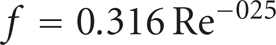
and that calculated from present numerical investigation results is presented in Figure 9 for ϕ = 4%. Data are in good agreement particularly for high Reynolds number values. The discrepancy at lower Re values could be due to the assumption of constant properties in the numerical simulations. It should be underlined that f is not dependent on ϕ value.
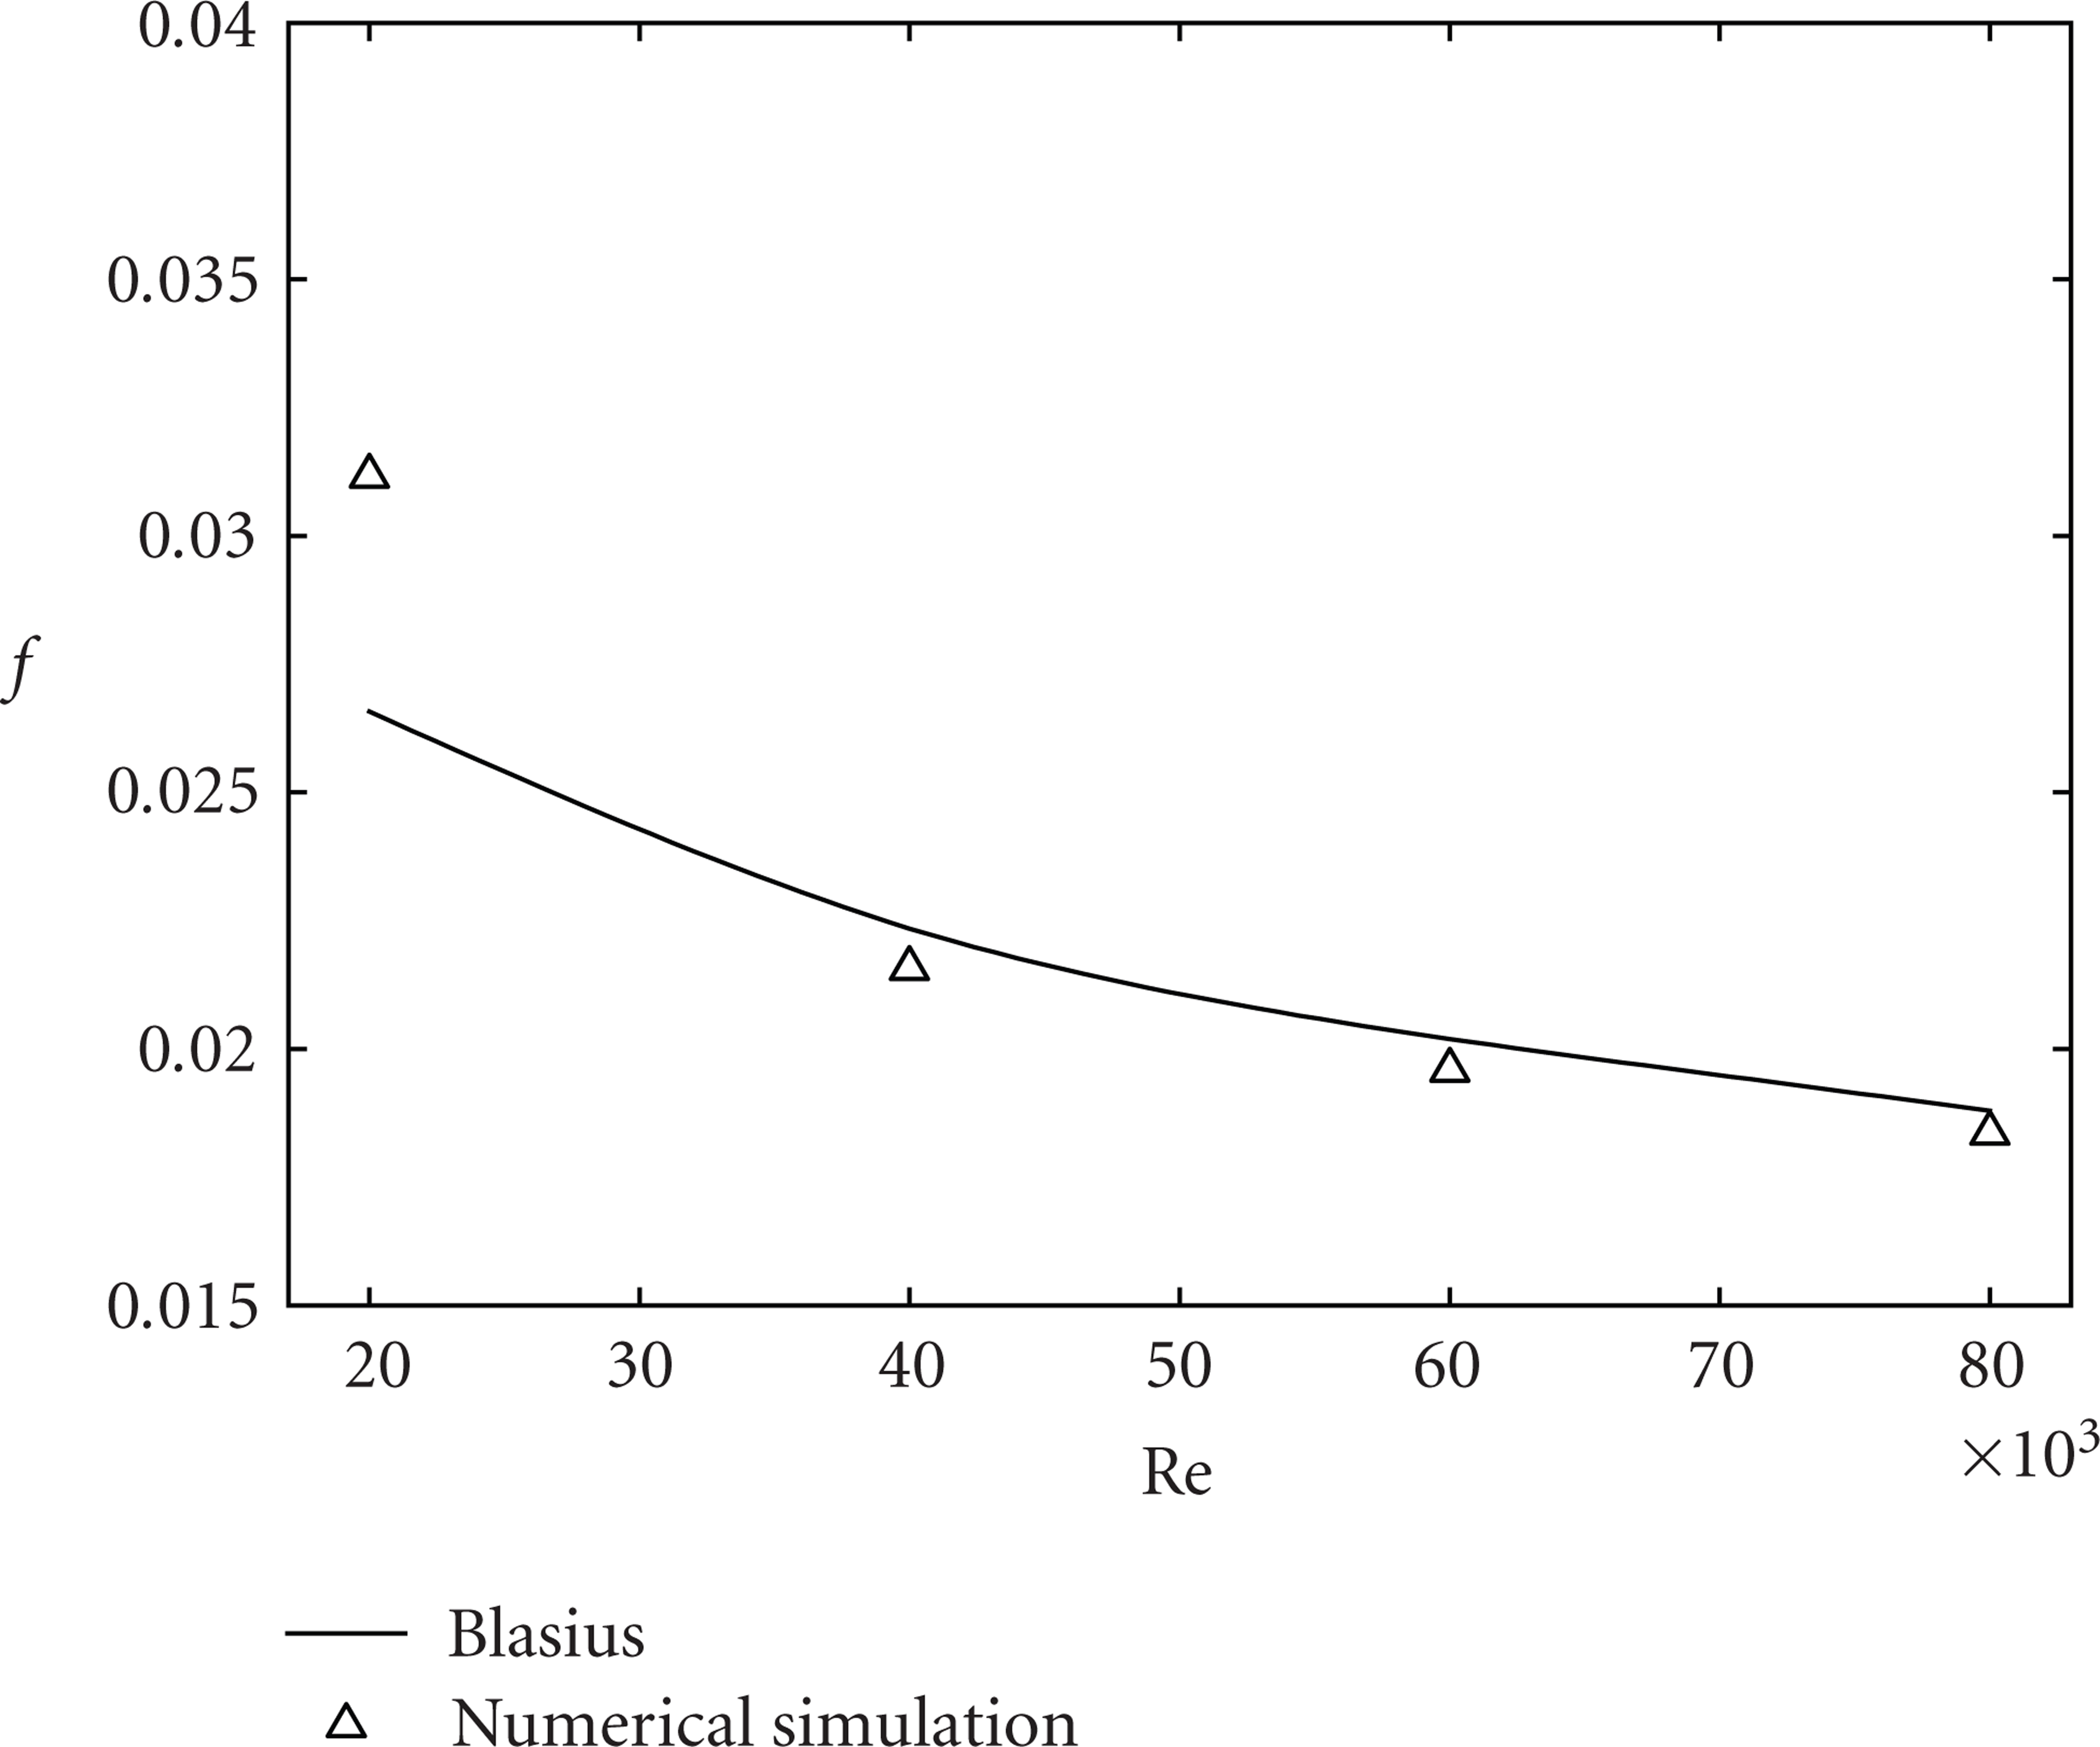
Friction factor as a function of Reynolds number for ϕ = 4%.
In Figure 10 the ratios between the nanofluids and basic fluid average heat transfer coefficients and shear stresses are reported for all the Reynolds numbers and concentrations investigated. Heat transfer coefficient ratios (Figure 10(a)) and shear stresses ratios (Figure 10(b)) are almost constant for each concentration value, so the percent increase is independent on Reynolds number. As the concentration increases, in an increment of the heat transfer coefficient, respect to the basic fluid of about 5%, 20% and 30% for particles concentrations of 1%, 4% and 6% respectively is detected. The corresponding increase in the shear stress ratios is significant, in fact there is an increase of 10%, 200%, and 300% for particles concentration of 1%, 4%, and 6%, respectively.
(a) Average heat transfer coefficient ratio; (b) average shear stress coefficient ratio.

In Figure 11 average Nusselt numbers are reported together with those from correlation by Pak and Cho [25]. It is clear the strong agreement particularly for low Reynolds number values. In fact, the average error is less than 5% for particles concentration of 1% and 4%, while for a concentration of 6% (Figure 11(d)) the maximum error is 8%.
Average Nusselt number as a function of the Reynolds number for: (a) base fluid (ϕ = 0%); (b) ϕ = 1%; (c) ϕ = 4%; (d) ϕ = 6%.

4. Conclusions
The present paper dealt with the stationary turbulent convection of water-Al2O3 nanofluid inside a circular tube, that was numerically investigated by means of finite volume method. The two-phase mixture model was employed to simulate the nanofluid convection, taking into account appropriate thermo-physical properties.
The results showed that heat transfer increased according to the particles volume concentration, but it was accompanied by increasing wall-shear stress values.
The highest heat transfer rates were detected, for each concentration, in correspondence to the highest Reynolds number; moreover a good agreement is found among the results of this study and the experimental correlation proposed by Pack and Cho [25]. This allows us to confirm that the mixture model approach for the simulation of nanofluid is satisfactory, as sustained also in [39, 40]. However, it seems that the accuracy of the model could be improved by using a better description of nanofluid thermo-physical properties taking into account also the temperature dependence. Moreover, the need to investigate the effect of nanoparticle diameter is recognized as an important topic for future studies.
Footnotes
Nomenclature
Acknowledgments
The authors would like to thank the anonymous reviewers for very helpful comments useful in improving the quality of the present paper. This work was supported by MIUR with Articolo 12 D. M. 593/2000 Grandi Laboratori “EliosLab.”