
Abstract
Water resources are under unprecedented strain. The combined effects of population growth, climate change, and rural industrialization have led to greater demand for an increasingly scarce resource. Ensuring that communities have adequate access to water—an essential requirement for community health and prosperity—requires finegrained management policies based on real-time in situ data, both environmental and hydrological. To address this requirement at the state level, we have developed the South Carolina Digital Watershed, an end-to-end system for monitoring water resources. In this paper, we describe the design and implementation of the core system components: (i) in situ sensing hardware, (ii) collection and uplink facilities, (iii) data streaming middleware, and (iv) back-end repository and presentation services. We conclude by discussing key organizational and technical challenges encountered during the development process.
1. Introduction
Water is the planet's most important natural resource, fundamental to human health and economic prosperity. Put simply, communities that have access to high-quality water resources are positioned to prosper, while those that do not are destined to languish. This supposition has startling consequences in light of the mismatch between the planet's water supply and water demand: our resources are under unprecedented strain. Burgeoning population growth, planetary climate change, and rapid industrialization in emerging market economies have together increased the demand for water resources while simultaneously reducing the supply. The impact of the mismatch could be disastrous, throttling energy production, limiting manufacturing capacity, damaging food crops, and compromising human health. The scale and urgency of the situation are underscored by recent drought emergencies across the globe, from the foothills of South Carolina [1] to the banks of the Yangtze river [2].
To safeguard water resources and to ultimately avoid a planetary water crisis, an integrated resource management approach is necessary. At the policy level, this means fine-grained resource estimation, provisioning, and pricing. At the implementation level, it means careful coordination of dams, floodgates, pumping stations, and myriad other control structures (An overview of the elements associated with an integrated water resource management program is provided in [3].). The difficulty at both levels stems from the enormity of the systems being managed and the associated complexity of their dynamics. Effective policy and implementation decisions hinge on the availability of accurate and timely data across a broad set of hydrological and environmental parameters at ultradense temporal and spatial scales. Further, the sheer magnitude of such datasets necessitates the need for supporting computational tools and presentation interfaces.
To address these requirements, we have developed the South Carolina Digital Watershed (This effort is part of the larger Intelligent River project spearheaded through Clemson Public Service Activities.), an end-to-end hardware/software infrastructure engineered to support real-time monitoring and management of water resources across the state. In this paper we describe the design and implementation of the infrastructure, provide preliminary evaluation results, and report on organizational and technical obstacles we encountered. The presentation centers on the four main components of the infrastructure. (i) First, we describe a family of in situ sensing platforms tailored for ultradense environmental deployments. (ii) Second, we describe a flexible data collection and uplink architecture used across our deployment sites. (iii) Third, we describe data streaming middleware for massively distributed sensor data publishers and subscribers. (iv) Finally, we describe back-end repository and presentation services. Together these components form the backbone of an emerging statewide compute fabric for monitoring and managing water resources.
Paper Organization
Section 2 surveys other in situ monitoring efforts reported in the literature and highlights the novelty of our solution. Section 3 describes the design and implementation of the four principal components of the Digital Watershed system. Section 4 provides an overview of key performance evaluation measures. Section 5 discusses organizational and technical challenges encountered during the development process. Finally, Section 6 concludes with a summary of contributions and pointers to future work.
2. Related Work
Despite the relative adolescence of the technology, in situ sensor network systems continue to experience rapid adoption. The ability to instrument the world at unprecedented scales has served as a catalyst for transforming a host of science and engineering disciplines. Environmental science has stood at the epicenter of this transformation from the start. Here we survey some of the most significant efforts in in situ environmental monitoring and place the Digital Watershed system in context.
Among the first large-scale efforts was the Great Duck Island deployment off the coast of Maine [4, 5]. The system was designed to monitor the nesting habitat of the Leach's Storm Petrel and was composed of approximately 150 Mica2Dot nodes [6] (The first deployment consisted of 32 Mica [7] nodes.). Burrow-deployed nodes monitored ambient and object temperature, and humidity. Surface-deployed nodes monitored ambient temperature, humidity, and barometric pressure. Both sets of devices were organized in single- and multihop routing topologies. In the latter case, synchronized sleep and transmission schedules were used to conserve power and increase network longevity. (The system was designed to operate unattended for months at a time, though burrow-deployed nodes failed earlier than expected.) Additional solar-powered nodes were used as (always-on) gateway devices to route in situ data to a high-powered satellite uplink. A replicated database was used as the principal sharing mechanism for collected data. Basic query tools were also developed.
The Macroscope deployment in Sonoma, California targeted a far different spatial scale [8]. The system was designed to study variation in microclimate characteristics throughout a single redwood tree. Thirty-three Mica2Dot nodes, the same platform used on Great Duck Island, were deployed at 2 m intervals throughout the interior of the tree. Each node reported temperature, humidity, and photosynthetically active radiation, both incident and reflected. The TASK system [9] was used to develop the sensing application, which relies on a multihop routing protocol that spans the network. Data was routed to a Stargate basestation [10] connected to a cellular modem for data exfiltration. The system ran unattended for 44 days.
More recent efforts span a broad spectrum of environmental applications—from studying soil ecology [11], to volcanic activity monitoring [12], to understanding the light dynamics within shrub thickets [13] (noting only a few). While these projects improve upon their predecessors in a number of important ways (e.g., the addition of nonvolatile storage, support for delay-tolerant networking, specialized sensing hardware), the basic deployment strategy remains the same: each system involves a single deployment site with instrumentation components tailored to address a relatively small number of scientific questions. By contrast, the Digital Watershed is designed to serve as an integrated data collection and processing system, unifying a large number of highly distributed sensor networks composed of heterogeneous devices. The breadth of data collected spans a broad range of scientific questions related to effective and timely management of water resources.
Closest to our work is the SenseWeb project led through Microsoft Research [14–16], focused on enabling planetary-scale sharing of heterogeneous sensor data. Their approach involves an integrated system architecture composed of middleware components, web services, and web 2.0 presentation tools. Sensor data—scalar and multimedia—is published to a centralized repository (In [16], the authors note that the repository could be distributed; the technical details of distribution are not discussed.) using standard web service interfaces. The repository system in turn provides services for locating, querying, and controlling individual sensors, as well as for subscribing to selected streams. Support for application-specific data transformations (e.g., graph generation, image processing) is also provided. The reference application developed using this system is the SensorMap web interface [17], which provides access to public streams over an interactive map.
While our system shares similarities with SenseWeb, there are also important differences: most important, our system is designed to support water resource management; the constituent components are consequently tailored to this purpose. Data integrity has been a principal thrust of our design effort; we have focused on providing integrated quality assurance and control measures. The underlying middleware system is also inherently distributed, safeguarding the system against single point failures. Further, our approach spans end-to-end, including the development of specially tailored in situ hardware platforms. Finally, our system exposes sensor data using standard data formats accepted by environmental scientists and hydrologists.
3. System Design and Implementation
The Digital Watershed is comprised of four components: (i) field-deployed sensors, (ii) an in situ collection and uplink infrastructure, (iii) real-time data streaming middleware, and (iv) repository and presentation services. We describe each of these components in the subsections that follow.
Before proceeding, we note that four sites were instrumented as part of the Phase I deployment. These sites are shown in Figure 1. The expanded view of Bannockburn shows the placement of the sensors deployed at that site. The image was captured using the web front-end described in Section 3.4.

Phase I Deployment Sites.
3.1. In Situ Sensing Hardware
The sensing fabric consists of a range of heterogeneous devices. While the system could be simplified by adopting a single hardware platform, doing so would limit the set of environmental and hydrological parameters that could be captured and would couple the system to a particular technology provider. Hence, a range of sensing platforms are deployed—from standard mote-class devices [18] to commercial dataloggers [19] to custom platforms designed to improve configurability and cut costs. Here we focus on two of the custom platforms.
Our first board design was guided by four objectives: (i) support for multiple analog sensors, (ii) high-fidelity data sampling, (iii) inexpensive production, and (iv) design simplicity. The last objective may require justification: given the scale of the end-to-end architecture, the process strategy relied on parallel development at each layer. Dependencies on the sensing layer necessitated rapid deployment. Hence, our efforts focused on producing a design with limited failure points amenable to rapid field testing. This enabled development to proceed at other layers while providing a foundation for empirical evaluation that informed future hardware revisions.
The board design is shown in Figure 2(a). The main sensing and communication component is the XBee Pro module (at the bottom-left of the board) [20], which includes an integrated 10-bit ADC converter. The module is programmed out-of-system using a serial programmer and seated in the board header (obscured in figure) at deployment time. Programmability is somewhat limited: the module enables on-board ADC conversion, data transmission, and sleep. Programming options specify the ADC ports to sample, network parameters (e.g., network PAN, source address, destination address), and the periodicity of the sampling and transmission behavior. The remaining board components supply sensor excitation power, signal conditioning, output voltage scaling (to utilize a larger portion of the 10-bit ADC range), and static power switching.
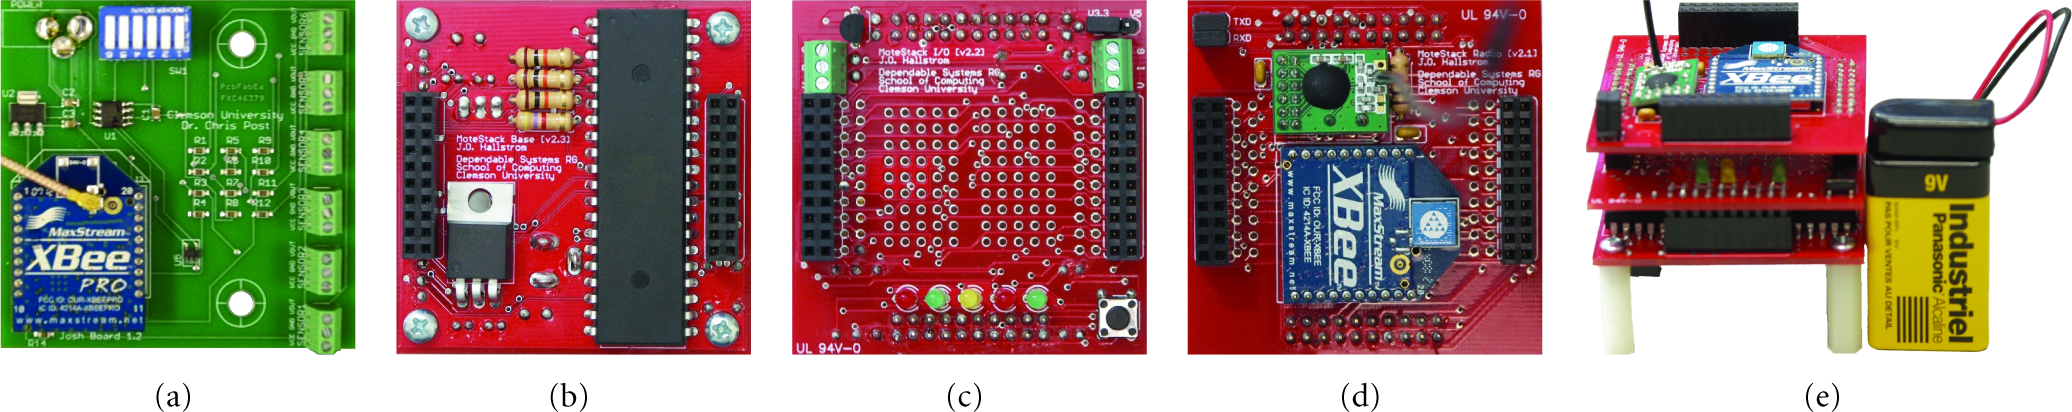
In Situ Hardware Platforms.
For nodes that perform low-frequency sampling with interleaved sleep transitions, longevity is dictated by the idle draw of the device. Consider, for example, the operation of the basic board: the maximum allowable sleep period is 4 minutes and the approximate duration of the sample and transmit phase is 6 seconds. This yields a duty cycle of approximately 2.5%. Or stated another way, the device spends about 97.5% of its time drawing idle current. In this case, the idle draw is approximately 1 mA, plus the draw of the external sensors. The additional current draw varies by device; a single pressure transducer, for instance, might draw 5 mA, while a CO
A second platform was developed in parallel with the original board. Due to its increased complexity, a longer development cycle was required. The parallel effort allowed us to refine the design based on our initial deployment experiences. Supplementary objectives addressed in the second design include (i) increased hardware configurability and programmability, (ii) improved power management, (iii) support for common digital sensor interfaces, and (iv) the addition of basic user interface elements.
The board was designed to be stackable to enable application-specific customization. The idea is to abandon the monolithic structure common to commercial platforms in favor of a componentized architecture. By composing layers that provide basic services, site engineers can assemble a platform tailored to their specific deployment needs.
The reference stack is shown in Figures 2(b)–2(e). Figure 2(b) shows the processor board. In addition to providing basic power regulation and noise filtering, the board hosts a general purpose microcontroller. In this design, an AVR microcontroller with an integrated 10-bit ADC unit is used. The standard 6-pin ISP header is exposed for device programming. Figure 2(c) shows the interface board. In addition to providing basic user interface elements (i.e., LEDs, tactile switches, headers), the board exposes standard digital interfaces (i.e., I
Devices deployed in the field are programmed to mirror the original board. However, the power consumption profile is significantly improved: the sampling period is set at 15 minutes, and the approximate duration of the sample and transmit phase is 5 seconds. This yields a duty cycle of approximately
3.2. Collection and Uplink Architecture
The collection and uplink approach copes with diverse deployment environments (e.g., open fields, hilly terrain, dense woods) by flexibly adapting the selection of networking technologies, infrastructure, and sensor platform configurations within a common architecture. An instantiation of the architecture consists of three components: (i) the local sensor network, (ii) the regional transit network, and (iii) the long range backhaul network. Technology selection and configuration are based on two criteria.
Sensing Requirements
The mission of the network is to connect all sensors in their deployed environments and to transport all measurements at the required data rates. Different wireless technologies (e.g., 3G/4G cellular, Wi-Fi, Zigbee, Bluetooth, WiMAX) offer different coverage, foliage penetration, data rate, and topology characteristics due to their operating frequency, power constraints, and radio techniques. For a given technology, the radio configuration (e.g., transmission power, amplifiers, antenna) can be adjusted to a limited extent according to the network coverage, transport capacity, and packet reception requirements.
Existing Infrastructure and Cost Tradeoffs
When telecommunication service is available, the service is considered based on recurring cost estimates and technology capabilities. For example, AT&T EDGE cellular service is available in portions of the Clemson Forest. The service is sufficient for transporting low-rate data and low-resolution video. (Satellite service is also available, but the hardware and service costs are substantially higher.) Looking forward, we intend to introduce high data rate sampling and high resolution video. We have therefore selected a multihop, long-range, Wi-Fi backhaul connected to the main campus network.
The sites targeted in the Phase I deployment required technology selection and configuration differences. These differences are summarized in Table 1. We note that the heterogeneity of the sites enabled us to perform a comparative evaluation of each technology component. We return to this point in Section 4.
Technology selection and configuration.

3.3. Data Streaming Middleware
In addition to supporting real-time delivery of in situ data, a key design requirement was the need to support a virtually unlimited set of data producers and consumers and to decouple their respective implementations. This was achieved through a custom middleware layer that simplifies the integration of new site installations and supports seamless producer/consumer expansion. The architecture implements a brokered variant of the common Observer pattern [21], providing internet-scale publish/subscribe functionality. Further, the system provides services for transforming field observations to standardized data formats, applying QA/QC measures, and simplifying routine data sharing tasks.
Brokered publish/subscribe messaging is a common communication pattern in large-scale distributed systems. Within the context of environmental monitoring, it offers a number of advantages. Consider the decoupling dimensions defined by Eugster et al. [22]: synchronization, space, and time. By supporting asynchronous publication, communicating entities need not synchronize transmission and reception. Communicating through a broker achieves decoupling in space and time: entities need not be aware of one another for communication to occur, nor does a receiving entity need to be present to receive an observation.
There are a number of brokered publish/subscribe messaging systems available, both commercially and in the public domain. We restricted our option space to open-source implementations to ensure long-term sustainability (not to mention economic factors). The space was further restricted by scalability, performance, and reliability requirements. The NaradaBrokering system [23, 24], a general purpose distributed messaging infrastructure, emerged as the best match. The system acts as an overlay network, supporting efficient data routing and dissemination through a distributed, hierarchical broker network. Replication and failover services provide fault masking in the presence of fail-stop faults and transient message loss. It is also worth noting that the system supports hierarchical topic descriptors (used to link publishers to subscribers), which provides a convenient mechanism for organizing data streams by project, site, quality assurance level, and so forth.
NaradaBrokering serves as a substrate for the observation management software used to control the movement of data observations from each deployment site to a suite of back-end processing applications. In addition to providing a simple, standardized interface for in situ network developers, the software translates observation data into common representation models, both for sensor data and metadata. This choice simplifies the development of back-end processing tools and facilitates automated inspection of observation data for purposes of quality control, network management, and health monitoring (We note that the underlying transmission system is model independent; in principle, multiple data models may be used simultaneously.).
In choosing each representation model, adoption potential was a driving thrust. With a focus on domain scientists, we chose the Unidata Common Data Model (CDM) [25] for observation data. CDM describes a unified representation for multidimensional scientific datasets; supporting libraries support a range of model translations (e.g., to NetCDF, HDF, DAP). For representing metadata (e.g., site information, publisher information, measurement units), we chose the Unidata NcML markup language. We are currently working to replace this model with SensorML [26], a more descriptive markup language developed by the Open Geospatial Consortium.
One of the most significant benefits afforded through data standardization is the ability to provide integrated quality assurance and quality control (QA/QC) services. These services are implemented as internal subscribers that receive, validate, and, when possible, correct observation data before it is republished to a separate stream. The QA/QC process is organized in levels, with each level performing more robust checks and corrections. Level-0 subscribers apply simple heuristics to identify invalid packets. Specifically, observations with identical timestamps originating from the same device, empty observations, and observations exhibiting excessive variability originating from the same device are flagged. (The last check is performed by comparing successive observations from the same node and performing a threshold test based on QA/QC configuration parameters.) Flagged observations are republished to a level-1 process responsible for correcting the errors. Specifically, the subscribers discard empty observations and observations exhibiting excessive variability (More precisely, the observations are stored in a back-end repository for offline analysis, but they are not republished.). In the case of duplicate timestamps, a single observation is generated by computing an average over the data contained in the affected records. We are currently developing level-2 subscribers that perform more rigorous statistical checks based on models of the phenomenon being sensed.
3.4. Repository and Presentation Services
Finally, the system provides back-end repository services and a web 2.0 portal for accessing these services (Public data products are available at http://www.intelligentriver.org/). The portal serves both regional and third-party data products (e.g., U.S. Geological Survey data, U.S. Army Corp of Engineers data). By unifying providers under a common interface, researchers can look to the Digital Watershed as a “one stop shop” for water resources data. To support this vision, the portal provides a range of presentation services.
Data formatting requirements vary by community. Supporting a range of formats and delivery mechanisms encourages broader adoption and enables interoperability with existing tools. When data enters the Digital Watershed system, it is republished to an extensible set of repositories. Currently supported repositories include a PostgreSQL database, the Thematic Realtime Environmental Distributed Data Service (THREDDS), and a simple text-based web delivery system. The PostgreSQL system uses the Xenia model for storage of scalar observation data. THREDDS, developed by Unidata, provides metadata and data access for scientific datasets. THREDDS supports a number of access standards, including OpenDAP, HTTP file access, the Open Geospatial Consortium's Web Coverage Service, and the NetCDF Subset Service. The text-based delivery system enables researchers to bring observation data directly into familiar tools like Microsoft Excel.
Data visualization is an important component of the web portal. Users can visualize real-time observation data using both web-based tools and specialized data visualization applications. Web-based tools rely on a combination of technologies that include AJAX, Flash, and Google Maps. Spatial representation is achieved using the Google Maps API with a custom JavaScript back-end that supports advanced data displays and dynamic content adjustments. In particular, a Flash-based, interactive charting system is provided. Other data visualization methods are supported through the GeoServer internet mapping engine. GeoServer provides multiple data access pathways, including GeoRSS, the Open Geospatial Consortium's Web Feature Service, and the Keyhole Markup Language. The Unidata-Integrated Data Viewer is a third-party application that supports time-series visualization of multidimensional scientific data. The application accesses real-time observation data through the THREDDS server.
4. Performance Evaluation
A project of this scale offers a multitude of performance dimensions amenable to evaluation. Here we focus on two of the most important—the performance of the collection and uplink infrastructure and the performance of the data streaming middleware.
4.1. Collection and Uplink Infrastructure
Measurement studies were performed to assess the achievable throughput of the two Wi-Fi backhaul networks. Three experimental configurations were considered. The results were as follows.
Long-Range Link
Over a 4-mile Wi-Fi link using fixed directional antennas, signal strength increased with transmission power, while throughput was unaffected (Figure 3(a)). Link connectivity was maintained throughout an antenna rotation of

Backhaul Performance.
Medium-Range Link
Over a 525 ft Wi-Fi link using two software-steerable directional antennas, throughput was measured as a function of antenna alignment. Alignment was varied from perfect (
Tree-Obstructed Link
Linksys routers with omnidirectional antennas were placed in a wooded area with approximately uniform tree growth. Received signal strength decreased consistently with distance, but the throughput variation was unexpected (Figure 3(d)). Specifically, an increase in throughput was observed beyond 120 ft. While multipath effects are suspected, the cause is unconfirmed. Signal strength was unaffected by transmission power.
4.2. Data Streaming Middleware
A benchmark study was performed to gauge the scalability of the middleware system. Observation transit delay was the focus of the study. The delay captures the time required for an observation to leave a measurement device, undergo packaging into the CDF format, pass through the brokering system, and arrive at a subscriber.
Twenty-thousand simulated observations were generated in 5-message batches for each trial run. A delay was introduced between each batch; this ranged from 1 to 400 ms over the runs, corresponding to a peak publication rate of 5,000 observations per second. Payload size was also varied across runs, from 32 to 2,560 bytes. Production and consumption were carried out on the same machine over a gigabit ethernet connection to a NaradaBrokering node. Both machines were Sun Microsystems servers with 2.6 GHz Dual Core AMD Opteron processors with 2 GB of physical memory running RedHat Enterprise 5.
The results of the study are shown in Figure 4. The average observation transit delay was 12.31 ms. Except at the very highest publication rates, performance was uniformly acceptable. To our surprise, no observations were dropped.
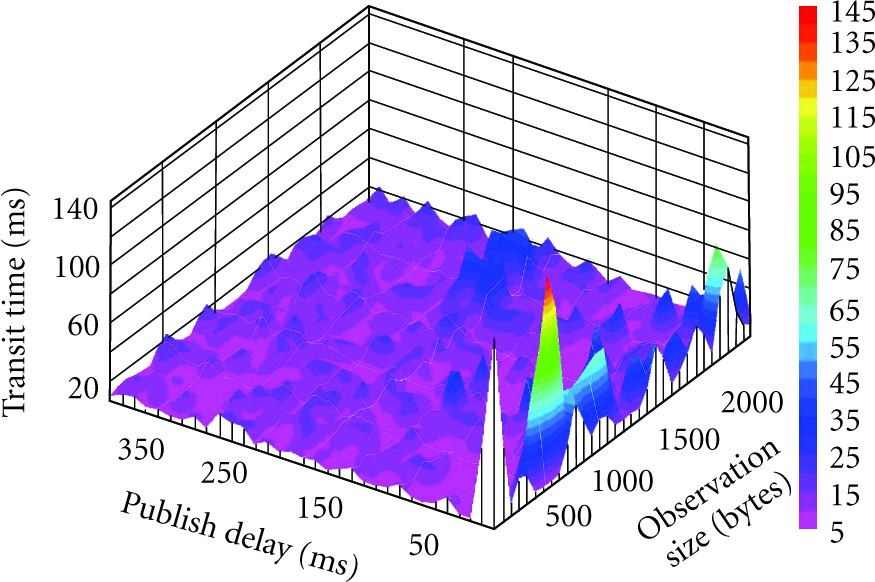
Middleware Performance.
5. Project Challenges
We experienced both organizational and technical challenges. Here we highlight some of the most significant and discuss our approach to overcoming them.
Organizational Challenges
Organizational challenges stemmed both from the scale of the development effort and the number of interdisciplinary participants. The 14 principal investigators were comprised of wetland ecologists, forestry and natural resource experts, computer scientists, electrical and computer engineers, applied ecologists, and biological engineers. These investigators brought in an additional 52 faculty, staff, and students, both graduate and undergraduate (These figures do not include students from two undergraduate engineering courses who performed project work as part of their curriculum.). We found that there were numerous differences—sometimes subtle, sometimes not—across disciplines in technical vocabulary, problem solving techniques, and design strategies. These differences hindered communication and progress. To overcome these issues, we relied on a professional Project Manager hired through the Clemson Computing and Information Technology Office.
Project management requires a clear and documented definition of the work to be done, who will do it, and the date it must be completed. In a largely self-directed program of this scale, this type of definition, direction, and timeline validation proved to be critical in understanding project challenges and directing project resources. It is also worth noting that the visualization component of our system benefited from this relationship. Regular project meetings helped us to come to a common understanding of what each stakeholder hoped to see. As a result, the team was able to develop a precise requirements document that was used to outsource much of the web development work.
Technical Challenges
Other experience reports have discussed the unexpected consequences of harsh environmental conditions (e.g., [4, 11]). Our experiences corroborate these findings. While the team expected differences between laboratory and field conditions, the differences were underestimated. The harsh environments selected (e.g., 100% salt marsh; heavily wooded, hilly terrain) resulted in poor hardware performance. In particular, radio transmission capability was far below the manufacturer's specification, even compared to the statistics provided for indoor (obstruction-filled) deployments. Further, some hardware components appeared to consume (or leak) more energy when deployed in humid environments (These results are consistent with those reported in [4]. The authors were unable to provide a precise explanation for the behavior.). To address the transmission difficulties, we are using a careful analysis of packet reception to adjust network topology and antenna orientation. To address humidity issues, we are investigating waterproofing compounds and experimenting with improved enclosures. The initial results are promising.
6. Conclusion
The point of departure for this interdisciplinary effort was the observation that the planet's water resources are in danger and the supposition that an end-to-end monitoring infrastructure could help to avert this danger. To that end, we described the South Carolina Digital Watershed, a hardware/software infrastructure designed to monitor and safeguard the state's water resources. We presented the design and implementation of the core system components, surveyed initial performance results, and discussed key organizational and technical challenges.
Deploying a statewide network is necessarily a long-term effort; we are only now completing the first phase. In the short-term, our future work will focus on three activities. First, we are expanding both the number of deployment sites and the coverage of existing sites. Instrumentation of (key portions of) the Savannah River is a top priority. Second, we are developing an in-network storage system with support for data replication. The objective is to guarantee high yield rates in the presence of node and network failure. Finally, we are incorporating support for multihop mesh networks with synchronized sleep and transmission scheduling. This will enable us to improve coverage of remote areas without incurring significant uplink costs.
Footnotes
Acknowledgments
This work was supported through the Clemson PSA Remote Sensing Initiative, Clemson Computing and Information Technology, and the NSF (CNS-0745846, CNS-0520222). The authors gratefully acknowledge these agencies for their support.