
Abstract
To overcome the faulty data query problem to improve the accuracy of data query, an efficient fault-tolerant event query algorithm (FTEQ) is proposed, which takes the short-term and long-term spatial and temporal similarities between sensors and environment into considerations. An imprecise and missing data correction algorithm based on Kalman filter is proposed to correct fault sensing data, and a score rank algorithm also is proposed to assign each sensor an appropriate value to reflect the importance of sensors. FTEQ performs self-evaluation and cooperative evaluation schemes with its trustful r neighbor nodes to filter fault data query with the importance of sensor. Simulation results prove that FTEQ performs extremely well in terms of faulty detection rate and data query cost.
1. Introduction
The advances microprocessor and wireless techniques have enabled the deployment of large-scale sensor networks, where thousands of cheap and small sensors are spread over a vast field for applications [1]. An important application of WSNs is to monitor, detect, and report the occurrences of events of interest, such as forest fire, environment temperature, chemical spills, network health, [1, 2]. Due to the strict resource limitations (e.g., battery power, bandwidth, etc.) of sensor nodes and the nature of some events, it is not feasible to collect all sensor measurements and compute event boundaries in a centralized manner. Several previous works [3, 4] proposed declarative SQL-like query which enable users to acquire the information about the network through issuing queries to the sink. Due to the characteristics of wireless sensor networks, sensors are usually deployed in a noneasily accessible or harsh environment and sensors are prone to failure and these faulty sensors are likely to report arbitrary data very different from the true environmental phenomenon and the faulty data of sensors are very common, which greatly influences the accuracy of data query. In order to overcome the faulty data query problem, Clouqueur et al. [5] sought algorithms to collaboratively detect the presence of a target in a region. Each sensor obtains the target energy (or local decision) from all other sensors in the region, drops extreme values if faulty sensors exist, computes the average, and then compares it with a predetermined threshold for final decision. However, it assumes that faulty measurements are either much larger or much smaller than normal measurements. In [6], the performances of sensors were considered to enhance the classical majority voting (CMV). Although a number of algorithms have been proposed to provide secure discrete event detection under adversarial environments [7–9]. However, this approach cannot be applied to a large-scale event directly, since it is neither feasible nor necessary for all the nodes in the event region to report its detection back to the sink due to the stringent resource constraints in WSNs.
Motivated by the above reasons, an efficient fault-tolerant event query algorithm called FTEQ is proposed to solve the faulty data query problem. We first give the system model and formulate the similarity of sensor behaviors among sensors in terms of both spatial and temporal behaviors of sensors to model the relationships among sensors. Then a rank algorithm is proposed to assign each sensor inappropriate value to reflect the importance of sensor. Based on the rank algorithm, FTEQ performs different schemes to filter fault data query.
The rest of this paper is organized as follows. System model and a rank algorithm and FTEQ algorithm to solve the faulty data query problem are given in Section 2. Performance studies are conducted in Section 3. This paper concludes with Section 4.
2. Proposed Algorithm
2.1. System Model and Temporal Similarity
Assume that each sensor is well positioned and is aware of its own location. Generally speaking, sensors have its valid sensing data readings range. Sensing data not fallen into the range are clearly viewed as faulty readings. Both faulty readings and noise readings are considered to be filtered out so as to improve the data accuracy of query results. In addition, once sensors are identified as faulty sensors that frequently report arbitrary readings, these sensors will not be inquired any more. To truly reflect the similarity of sensor behaviors, the similarity of sensors should be considered the reading behaviors of sensors.
The sensing data reading behavior of sensor consists of a series of sensing readings within a sliding window

Note that the width of the sliding window is set to


Note that sensors are required to periodically sense data. Consequently, the reading behaviors of sensors may vary with time. The sensing readings collected recently should be more important than those occurred long time ago. The temporal similarity of environments sensed by two sensors

In essence, the temporal similarity will be calculated with a fixed period. Assume that each time we calculate the temporal similarity is referred to as one round. The long-term temporal similarity of

A query event will trigger the sensor reading behaviors, along with the time while the event occurred. Denote the set of related sensors as Q, and let

The durations of temporal correlation n-graph are used as timing features for further analysis. We make a natural assumption that the n-graph, with duration y,

We have to deduce

2.2. Spatial Similarity
Sensor j is spatial correlation with sensor i if

The long-term temporal similarity of

Thus, the problem that we study in this paper can be formally defined as follows. Given a set of sensors, the collection of the spatial correlation of all the sensors, and a prespecified error threshold θ, the fault event filter problem is to select a set of r-nodes R to judge the query event, such that for each sensor i, there is at least an r-node
2.3. Data Correction and Importance Rank
In order to correct the imprecise and missing sensed data of sensor nodes in harsh environment, the original sensed data

The measurement state is modeled as a vector and the measure at time t is denoted

The correction procedure can be divided into three phases, namely, initialization, prediction and correction. We use

Let the initial measurement of a given sensed data be

The initial state estimate

The next step is to predict the sate and the error covariance at time point 1 using

Then we execute the correction step to optimize the data quality. It is divided into three substeps. The first step is to compute the Kalman gain by applying:

The second step is to update the estimated state using the measurement

The final step is to update the error covariance by:

This procedure is repeatedly executed to compute the state estimates for the following time points. The estimated location at time t is thus
The missing sensed data can be filled up simply by the predication of Kalman filter

Given a spatio-temporal correlation network
We suppose that for an event query q from a sensor

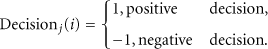
When a sensor submits an event query, each of the returned data is also mapped to a weighting vector by temporal similarity:

The computation of rank value requires several iterations to determine the steady-state probability for each sensor. Specifically,
2.4. Fault-Tolerant Event Query Algorithm
The proposed FTEQ algorithm consists of two phases: self-evaluation phase and cooperative evaluation phase. In self-evaluation phase, each sensor verifies whether the current reading of a sensor is unusual or not. Once the reading of a sensor goes through the self-evaluation phase, this sensor can directly report the reading. Otherwise, the sensor has to consult with the neighbors to further verify whether the current reading is faulty or caused by an interesting event. If the readings are determined as faulty readings, these faulty readings will be filtered out. Those sensor generated faulty readings will not get involved in negotiation since these sensors are likely to bias the negotiation for other sensors.
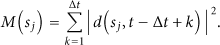
After collecting all the votes from the neighbors,

If the weights of the positive votes are more than the weight of the negative votes,
3. Experimental and Simulation Results
3.1. Simulation Setup
The well-known simulation tool NS2 [10] is used to validate the proposed scheme. The simulation model consists of the environmental model, the faulty model, and the query model. The simulated sensor network is deployed in a
To show the performance of the proposed FTEQ algorithm, we implemented the classical majority voting algorithm (denoted as CMV).
3.2. Experimental Results
In the first scenario, we examine the impact of the number of iterations of calculating rank value, reading behavior length of time window, and reading behavior length of time window on the proposed FTEQ algorithm.
Figure 1 shows the impact of the number of iterations of calculating rank value on faulty detection and convergence rates. The faulty rate is set to 0.5 to show the trend in the faulty detection rate and convergence rate. In Figure 1 when the number of iterations increases, the faulty detection rate increases. The reason is that when the number of iterations for calculating rank value is 0, rank value of each sensor is 1. In this situation, the proposed FTEQ is just like a general weighted voting. After three iterations for calculating rank value, we can find that rank value is convergence and thus the faulty detection rate and the false positive rate are also stable. The convergence rates for all sensors are averaged as experimental result. Figure 1 shows that rank value will converge fast in a few iterations. Explicitly, the convergence rate drastically decreases after three iterations of calculation. Therefore, after three iterations of calculating rank value, almost all sensors' rank values are stable.

Impact of number of iterations on faulty detection rate and convergence rate.
The impact of reading behavior length of time window on faulty detection rate is shown in Figure 2. When the length of the reading behavior is too long or too short, the performance of filtering faulty reading will not be good. It is intuitive that when

Impact of the length of reading behavior.
Figure 3 shows the impact of the number of neighbors. We deployed a large number of sensors to increase the average number of neighbors of each sensor. In order to increase the number of neighbors, we increase the density of the deployment of sensors. Note that the more neighbors a sensor has the better performance a voting scheme is. The reason is that more neighbors will increase the number of spatio-temporal correlation nodes. For a negotiating-based scheme, if the probability that a sensor makes a wrong decision is low, the probability that the majority of neighbors make wrong decisions is much lower.

Impact of the number of neighbors.
In the second scenario, we compare the faulty detection rates, query processing cost, and energy consumption of the two algorithms.
Figure 4 shows that the proposed FTEQ can filter out about 87% faulty readings while CMV can only filter about 40% faulty readings. Intuitively, the faulty detection rate will be high in a low faulty sensor rate and will decrease when the faulty sensor rate increase. However, since faulty readings in FTEQ are biased normal readings, it is hard to identified faulty readings for CMV. Therefore, when the faulty sensor rate is low, the faulty detection rate is around 40%. When the faulty sensor rate increases, although almost all sensors are faulty, a faulty sensor can still be identified as faulty by its faulty neighbors due to dissimilar readings. Thus, the faulty detection rates are the same with various faulty sensor rates.

Faulty detection rate of two algorithms.
Figure 5 shows the data query processing cost of two algorithms, with the number of sensors varying from 200 to 1000. The event data set follows the uniform distribution. We investigate the number of messages exchanges among sensors. As shown in Figure 5, we can see that the results reveal the FTEQ being more scalable than CMV. With the number of sensors increasing, the number of messages for FTEQ increases slowly from 62 to 137. For CMV, the number of messages increases obviously and greatly from 89 to 521. The error between two algorithm increases greatly. This demonstrates that the proposed FTEQ can effectively filter faulty data query to accurate answer user queries while guaranteeing that data is accurate, which greatly decreases query processing cost.

Query processing cost of two algorithms.
In Figure 6, we compare the energy consumption of FTEQ and CMV. The initial energy capacity of each sensor is set to be equal to the simulated cost of 500 message transmissions. We repeat the experiment 10 times and present the average values. In each run, we let the sensors operate for 100 time-units. Algorithm FTEQ is executed every 100 time-units to select new r-nodes to detect data query event. The error threshold is 0.5°C. In FTEQ algorithm, for each query, a selected r-node reports its readings to the sink if some sensors in its spatio-temporal correlation within the query window. In CMV scheme, all the sensors within a query window report their readings to the sink. We account total remaining energy for FTEQ and CMV scheme every 100 time-units. As can be seen in Figure 6, the total remaining energy of sensors in CMV scheme is smaller than that of FTEQ. With the simulation time increasing, the total remaining energy of CMV decreases obviously, from 150200 to 3000. While for FTEQ, the total remaining energy decreases slowly. This proves that the proposed FTEQ saves energy effectively.
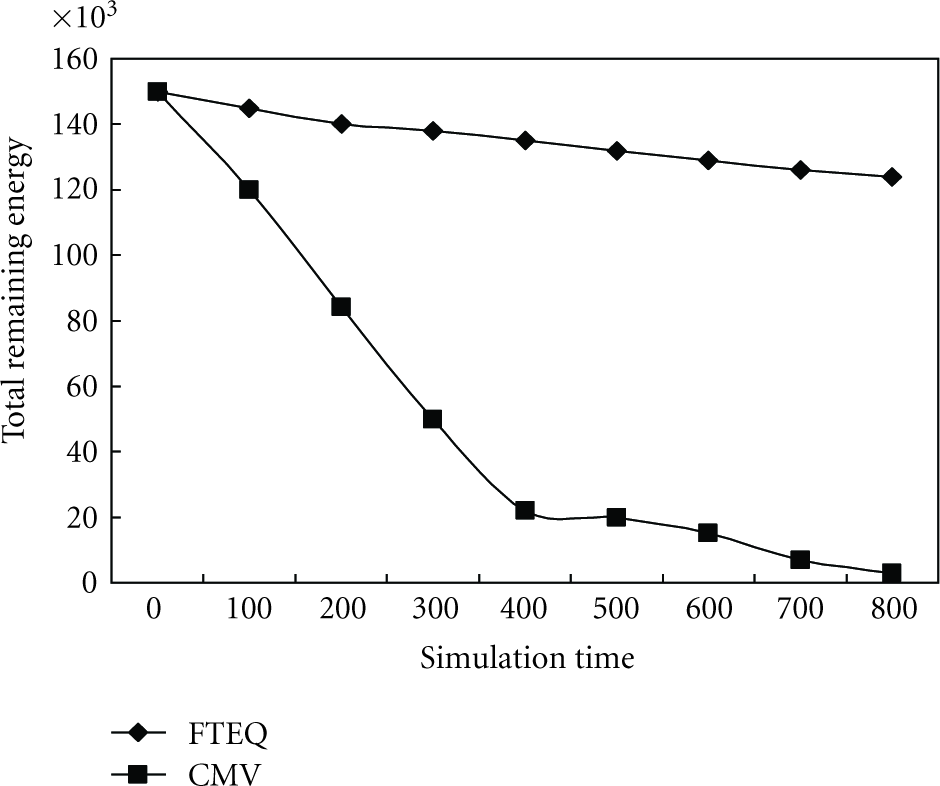
Average available energy of different algorithms over time.
4. Conclusions and Future Work
In this paper, we have considered the important problem of faulty-tolerant event data query in distributed WSNs so as to improve the date accuracy. The challenge problem is to distinguish between faulty readings and unusual readings caused by environments. In order to overcome the problem, we first formulated the similarity of sensor behaviors among sensors in term of both spatial and temporal behaviors of sensors, which also takes short- and long-terms spatio-temporal correlation into consideration. Then sensor nodes adopt Kalman filter to correct the imprecise and missing original sensed data in harsh environment. Based on the spatio-temporal correlation, we calculate score value to assign each sensor appropriate value to reflect the importance of sensor. FTEQ performs self-evaluation and cooperative evaluation schemes to filter fault data query. Detailed simulation results and comparisons with exited algorithms prove that the performance of FTEQ is much better in terms of faulty detection rate, data query cost, and energy consumption. The future work should be done on the issues of query moving objects and track objects.
Footnotes
Acknowledgments
This work is supported by the National Natural Science Foundation of China (no. 60902053) and the Natural Science Foundation of Hubei Province (no. 2008CDB339). The authors are grateful for the anonymous reviewers who made constructive comments and improvements.