
Abstract
This paper investigated, using experimental method, the suitability of acoustic emission (AE) technique for the condition monitoring of diesel engine valve faults. The clearance fault was adjusted experimentally in an exhaust valve and successfully detected and diagnosed in a Ford FSD 425 four-cylinder, four-stroke, in-line OHV, direct injection diesel engine. The effect of faulty exhaust valve clearance on engine performance was monitored and the difference between the healthy and faulty engine was observed from the recorded AE signals. The measured results from this technique show that using only time domain and frequency domain analysis of acoustic emission signals can give a superior measure of engine condition. This concludes that acoustic emission is a powerful and reliable method of detection and diagnosis of the faults in diesel engines and this is considered to be a unique approach to condition monitoring of valve performance.
1. Introduction
Diesel engine is the power source of many machines. It generates the necessary drive power to overcome the resistance loads by burning fuel and converting the energy content of the inlet mixture to mechanical motions. Incipient faults not only degrade the performance of the engine itself but also bring significant economical losses to the user. To reduce the negative influences to minimum, many monitoring methods have been studied in the last two decades. However, faults in diesel engines are sometimes difficult to diagnose using conventional techniques such as vibration, temperature, and airborne acoustic. Vibration monitoring gives only limited information about engine conditions. It often requires many accelerometers and different measurement positions to achieve a general estimation of the engine condition. Another disadvantage is that the vibration signals are contaminated by noise and need effective signal processing to get useful information [1]. Problems are also encountered due to the nonstationary characteristics of the vibration signals encountered in the engine [2]. The advantages of airborne acoustic signals can give more information about the engine. However, since acoustic signals are easily contaminated by noise, it is often more difficult to extract useful condition monitoring information [3].
Therefore, to find more effective and reliable monitoring methods, this paper investigates the potential of AE technique to monitor the condition of diesel engines. AE signals encountered on diesel engines are the stress waves travelling on the surface of the engine. Mechanical events that generate AE include impacts and crack formation; in addition, fluid and gas flows also generated AE [4].
Neill et al. [5] and Fog [6] have shown that AE has the great advantage over pressure and vibration measurements because the signal-to-noise ratio (SNR) of AE is much higher, and hence AE monitoring is usually more effective in real industrial settings.
The higher SNR of AE signal is because of the fact that the distance damping of the stress waves increases with frequency. Since AE frequency is much higher than vibrations, AE signals are unlikely influenced by the noises from longer distance. Thus, for AE measurement, the distance between sensor and source should be reduced as much as possible. This will mean that the AE signals are far more localised, for example, appearing virtually only from the source where they are generated. It also means, however, that differential damping of different sources is crucial in sensor location considerations due to material interfaces along the signal path [7]. Of course, it is necessary to ensure good signal conductivity from the surface to the sensor and high vacuum grease should be used as a coupling.
A diesel engine has many intake and exhaust valves. Closing and opening of these valves are achieved by a camshaft and a valve spring operating in precise synchronisation. Noise and vibration from the valves, which are one of the AE sources in a diesel engine, arise from two sources of distinctly different origin and character, namely,
impact noise, which is the noise generated by the colliding of various surfaces, in particular those of the valve and valve seat, and of the rocker arm with push rod or valve stem; valve impact is considered to be the predominant source of valve noise;
aerodynamic noise, which is the noise created by the gas passing between the valves and their seating and gas flow over the valve face.
Valve impact plays a significant role in the AE of diesel engines. The valve impacts on the valve seat on valve closure, and the degree of impact depends on the valve closing velocity, which is controlled by the dynamic behaviour of the valve train, particularly the force exerted on the valve by the valve spring. The valve is loaded by a spring and the cylinder pressure, which varies periodically during engine operation. The bending of the valve cone results in a sliding motion, improper contact, and valve/seat interface wear, which affects engine performance.
2. Exhaust Valve Mechanism
To better understand the exhaust valve operation, refer to the Ford engine specification and see Figure 1 which shows the exhaust valve opens at 51° before BDC and closes 13° after TDC, and that the healthy engine exhaust valve clearance is 0.38 mm [8]. Changing these angles even slightly significantly affects the maximum cylinder pressure, and the rate of change of pressure, so the major effect of such a change will be on the power stroke around the BDC.

Exhaust valve opening and closing angles (Healthy).
3. Exhaust Valve Angles and Clearance Variation
The experiment was carried out for valve clearances of 0 to 0.7 mm in 0.1 mm steps, and the valve was then monitored to identify the opening and closing angles of the crankshaft using an angular scale.
The exhaust valve opening angle was found by turning the crankshaft manually. It occurred at 40° before BDC, and at 51° before BDC with 0.38 mm clearance—a full 11° later than for normal conditions. The closing of the exhaust valve was found to be at 7° after TDC and at 13° after TDC with 0.38 mm clearance—6° earlier than normal. This change in opening and closing angles was obtained by averaging the readings for each 0.1 mm valve clearance increase as shown in Figure 2.

Effect of a valve clearance increase of 0.1 mm on opening and closing angles.
4. Experimental Study
4.1. Test Rig
This paper used a 2.5-litre, Ford FSD 425, four-cylinder, four-stroke in-line OHV, direct-injection compression ignition diesel engine as the source of acoustic emission data as seen in Figure 2. The injection and/or combustion sequence is as listed in Table 1. The data in the table was obtained from the engine service manual [8].
Specifications of the test engine.

4.2. Measurements Setup
The experiment employed the PAC WD2030 sensor with a frequency range from 100 to 1000 kHz (channel 1) and the D9241A sensor with operating frequency range from 20 kHz to 180 kHz (channel 2). The outputs of AE sensors were amplified using PAC 2/4/5 preamplifier and sampled using PAC PCI 2 data acquisition board. The filter of PAC PCI 2 was set from 100 kHz to 1 MHz and the sampling frequency was 2 MHz for each test AE raw signal was recorded continuously for 3 seconds. Acoustic emission sensor has been used for the acquisition of the acoustic emission signal.
The AE sensor was mounted on the front and rear side of the cylinder head of the engine to collect the AE signals generated during the operation of engine. To get good signal conductivity, vacuum grease was used to couple the AE sensor with the measurement surface.
5. Results and Discussions
5.1. Analysis in the Angular Domain
The fault introduced was to increase the valve clearance in the exhaust valve of cylinder one by 0.5 mm (positive) and 0.8 mm (positive). Data was collected for both faults, but this description is limited to the consequences of introducing the second fault (0.8 mm) because the first fault has no significant effect. The measured AE signal from the engine was displayed in the angular domain.
In the angular domain, the analysis can clearly correlate AE transient events to the operation of engine. Figure 4 presents the AE waveforms corresponding to the seeded fault when the engine was tested at 1000 rpm with three different loads (0, 30, and 60 Nm). In addition, the reference AE signal corresponding to the healthy condition on the cylinder head is shown in Figure 3 in blue colour in order to compare with the faulty AE signals presented in red colour. Every signal contains 40000 samples covering one cycle (2 crankshaft rotations).

Photograph of test rig in situ.
Angle-domain AE signal from sensor one at speed 1000 rpm and different loads.

From Figure 4 no significant change in signal from the faulty cylinder can be seen at sensor one, because the sensor is positioned relatively far from the cylinder. Furthermore, this simulated fault has no influence on the other healthy cylinders.
Figure 5 shows that there is no significant difference in the AE signals around TDC for the faulty condition compared with the healthy one. The introduction of the fault appears to have no significant influence on the AE signal from the other cylinders. However, if the AE amplitudes are examined more closely, a relative decrease of amplitude for the faulty condition can be seen. This is because the AE wave propagation through the engine cylinder head will attenuate a little whilst passing along a transmission path from the AE sources to the position of the sensor and this small increase of attenuation originates from the increase in valve clearance.
Angle-domain AE signal from sensor two at speed 1000 rpm and different loads.

On increasing the engine speed from 1000 rpm to 2000 rpm with different loads we again see, Figure 5, that there is slightly difference in amplitudes of the faulty and healthy signals from the faulty cylinder for sensor one, because this sensor is positioned relatively far from the faulty cylinder, as previously mentioned. The AE level is slightly higher in the healthy condition than that in the faulty condition, which is clear in this figure.
In Figure 6 the AE signal for sensor two shows a significant difference in the peak levels for the healthy and faulty conditions. This is because the position of sensor two is close to the faulty first cylinder, and the exhaust valve opening event is clear for both healthy and faulty conditions. The figure shows a difference in the AE signal amplitudes for the exhaust valve opening event with and without the fault; it also shows a clear difference in the time of occurrence at which the exhaust valve opens due to exhaust valve timing differences. Opening occurs later, and closing occurs earlier, for the faulty exhaust valve. The faulty valve opens at 5° before BDC (46° later than for the healthy condition) and closes at 12° before TDC (25° earlier than for healthy condition).
AE at sensor one with engine speed of 2000 rpm and three different loads.

A later exhaust valve opening reduces power output because of the increased volume of exhaust gases that must be discharged from the cylinder. This means that there are greater pumping losses incurred in evacuating the exhaust gases from the cylinder; these pumping losses happen before the piston reverses at the end of exhaust stroke.
Early exhaust valve closing leads to a shorter valve overlap period and also reduces the volumetric efficiency significantly because the exhaust gases occupy space that could be used for fresh mixture. This leads to reduced engine power output, which is undesirable. This is why the cylinder pressure with a faulty exhaust valve is higher than that with a healthy valve.
In Figure 7 if the AE amplitudes are examined closely, the decrease in amplitude in the faulty condition in comparison with the healthy condition is more distinct than that in Figure 6. This means that the power output of the engine is reduced, especially in the faulty cylinder, and the other cylinders will try to compensate for this power reduction by increasing their power output because the engine is working as one system; for this reason the AE signal is slightly decreased under faulty conditions.
AE at sensor two with engine speed of 2000 rpm and three different loads.

The main sources of AE in diesel engine in the valve opening and closing are as follows: the colliding surface of the valves and seats which induced the impact and the degree of impact depends on the valve closing velocity, and the bending of the valve cone resulting in a sliding motion, improper contact, and valve/seat interface wear, which affects engine performance as seen in Figure 8.
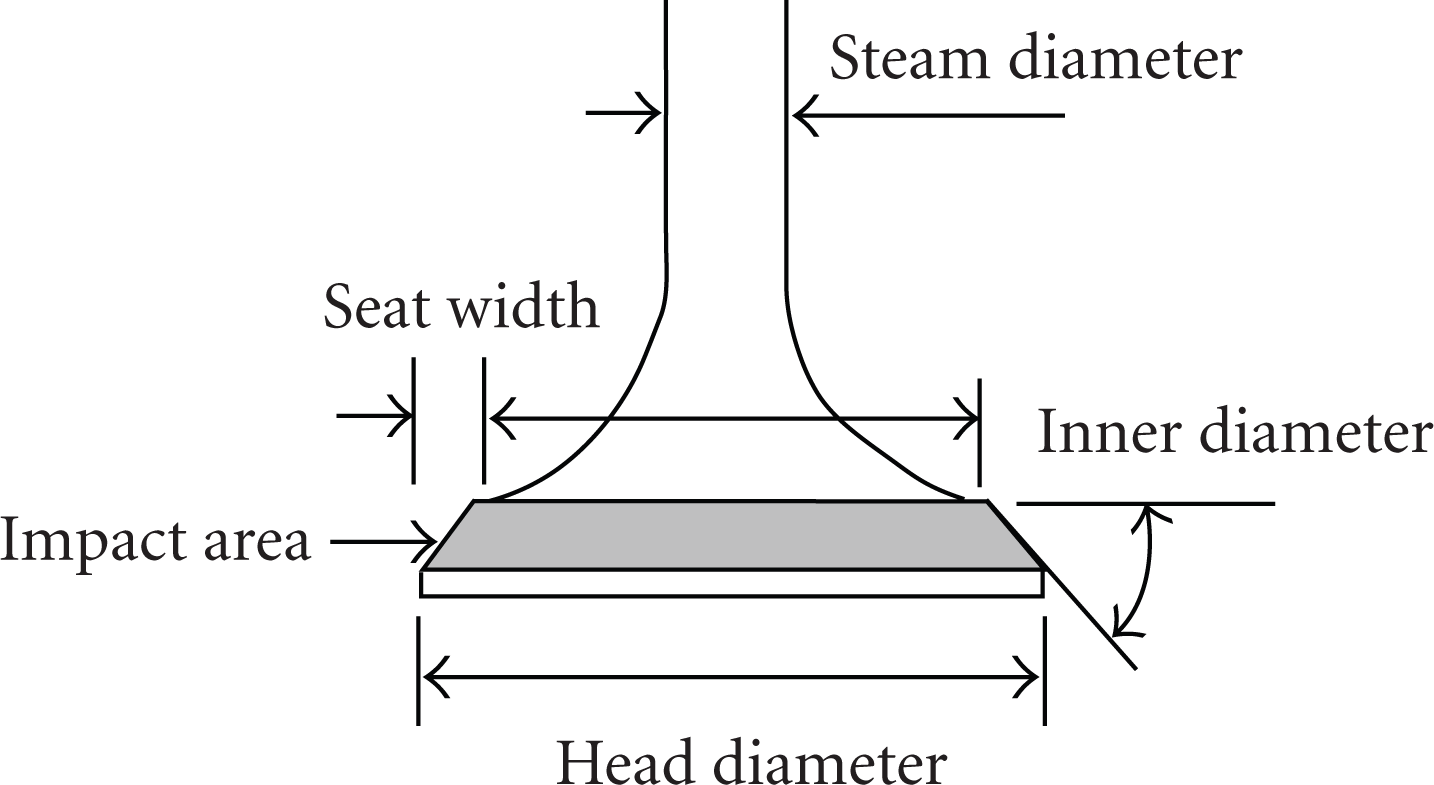
Valve impact area.
The most significant gas flow restriction in diesel engine is the flow through the intake and exhaust valves. The gas passing between the valve and their seating and gas flow over the valve face is one of AE sources (aerodynamic).
The important AE source also in cylinder head is fluid flow through the injector. The AE signal which is generated from the turbulent or cavitational flow through the orifice can be detected by AE instrumentation.
Turbulence generated in a diesel engine is anisotropic. The gas flow processes into, through, and out of a diesel engine are all unsteady—that is, the pressure, temperature, and gas particle velocities vary with time. Both large-scale turbulence and small-scale turbulence have a drastic result on combustion, flow-mixing, and heat-transfer in an engine [9]. The major source of energy for turbulent velocity fluctuations is shear in the mean flow, for example, jets [10], but the velocity gradient at the wall in the boundary layer produces large vortices which are unstable inside the chamber and eventually break down into additional turbulent motion. The fluid flow through the orifice of the injector is associated with four components.
5.2. Analysis in the Frequency Domain
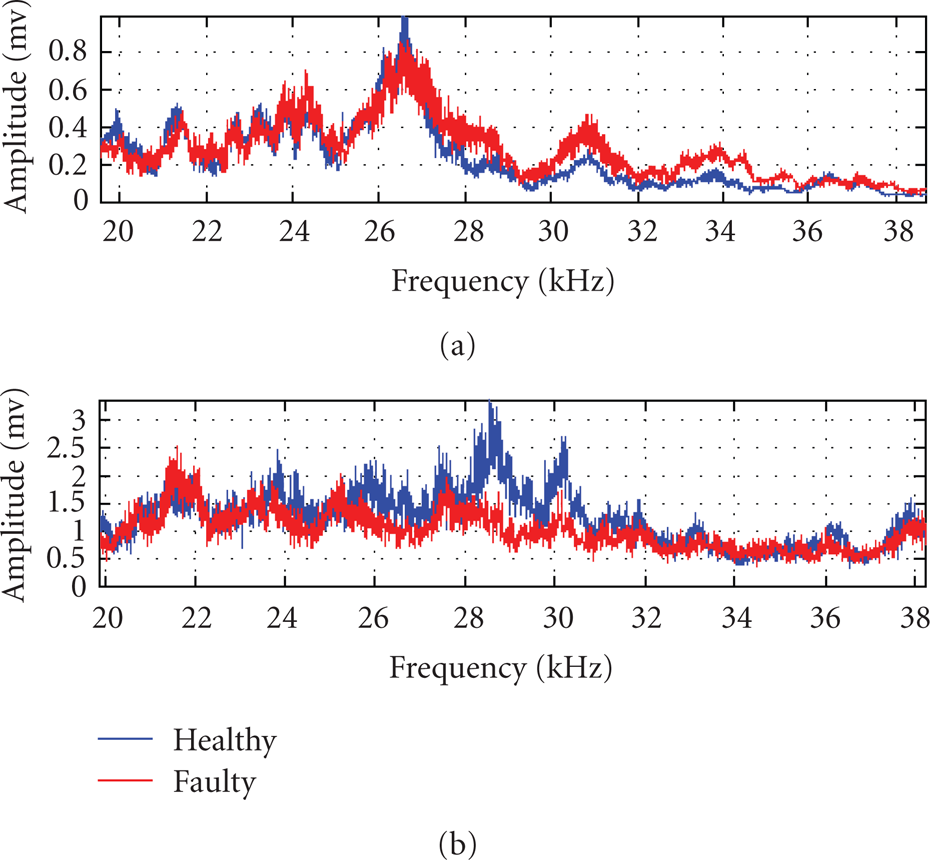
Figures 9, 10, and 11 show the frequency analyses of the AE signals resulting from valve impacts and gas flow over the valve face, which tends to generate pulses with frequencies in the range from 22 kHz to 38 kHz, approximately. In each case the signals from both sensors are presented for an engine speed of 1000 rpm, with both healthy and faulty valves. The load was varied, from 0 Nm to 30 Nm, to 60 Nm. Comparison of the spectrum for healthy and faulty conditions shows that the AE signals decrease for a faulty exhaust valve, especially when the engine speed is increased as shown in Figures 12, 13, and 14.
Frequency domain analysis of signals from (a) sensor one and (b) sensor two for healthy and faulty exhaust valve with engine speed of 1000 rpm and zero load.

Frequency domain analysis of signals from (a) sensor one and (b) sensor two for healthy and faulty exhaust valve with engine speed of 1000 rpm and load of 30 Nm.

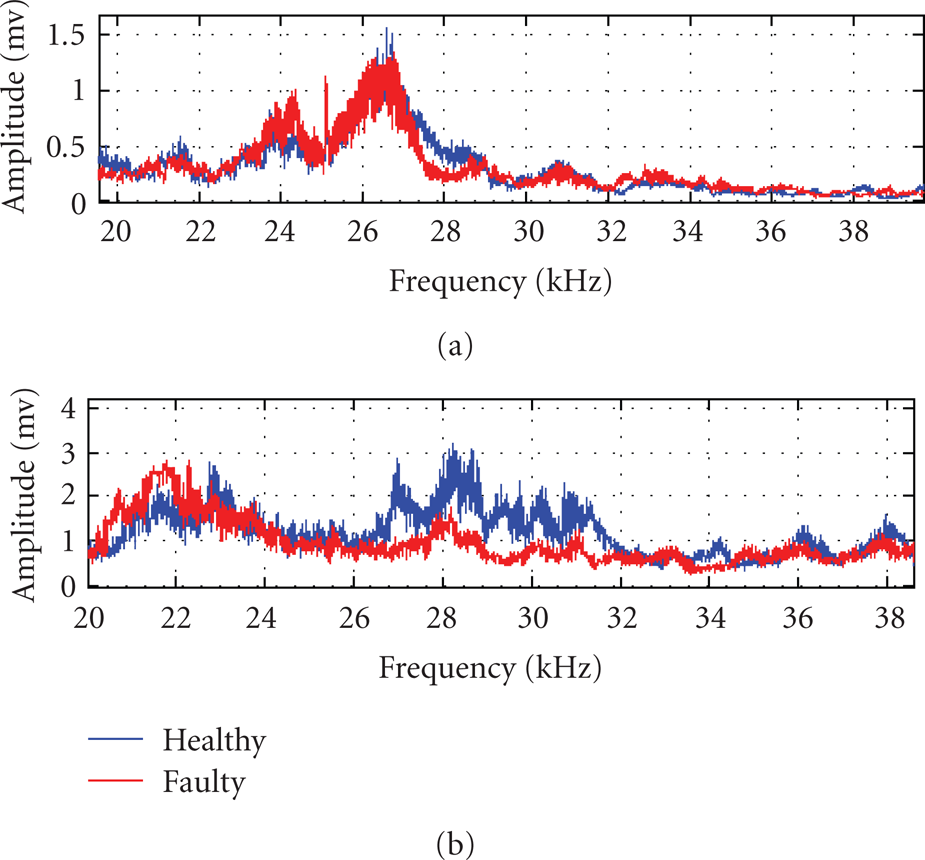
Frequency domain analysis of signals from (a) sensor one and (b) sensor two for healthy and faulty exhaust valve with engine speed of 1000 rpm and load of 60 Nm.

Frequency domain analysis of signals from (a) sensor one and (b) sensor two for healthy and faulty exhaust valve with engine speed of 2000 rpm with no load.

Frequency domain analysis of signals from (a) sensor one and (b) sensor two for healthy and faulty exhaust valve with engine speed of 2000 rpm and load of 30 Nm.
Frequency domain analysis of signals from sensors one and two for healthy and faulty exhaust valve with engine speed of 2000 rpm and load of 60 Nm.
Figures 12, 13, and 14 show the frequency spectrum of the AE signal at an engine speed of 2000 rpm at loads of 0 nm, 30 Nm, and 60 Nm, respectively, with healthy and faulty exhaust valve. The AE spectrum for a healthy condition has much greater amplitude than that for 1000 rpm. This is because of the greater valve speed and the greater speed at which the exhaust gas is discharged. Table 2 shows the frequencies at which the peak signals occur for both sensors with an engine speed of either 1000 or 2000 rpm and three loads.
Frequencies at which peak amplitudes occur for healthy and faulty exhaust valves.

When the valve clearance increases, the valve will open late and close early, and this causes the impact of the valve on its seat and impact of the rocker arm with push rod or valve stem to decrease. Also the volume of gas flow over the valve face will decrease since the valve duration will be smaller than under healthy condition.
The reason for this effect is connected with the fact that the faulty cylinder produces less power than the other cylinders. Diesel engines produce power in a sequence of controlled explosions; these explosions produce powerful pulses of energy. The AE spectrum of such a pulse is a series of AE spectral lines. These spectral lines will be at integer multiples of the firing rate of each piston, and as a given piston fires every 720°, the basic spectral line will be at half the engine rotational speed.
It is obvious that if all the pistons produce nearly identical combustion pulses, then the effect of small faults will be small. This means that the first faulty cylinder produces less power than the rest, which will show itself in the amplitudes of the spectral lines.
One of the advantages of the diesel engine is a high volumetric efficiency which ensures a high operating efficiency, and the biggest factor affecting the volumetric efficiency is the valve timing, specifically the valve overlap angle. A high volumetric efficiency affects torque, power, and fuel consumption favourably. If we increase the valve clearance of one cylinder the volumetric efficiency of that cylinder decreases, then the pumping losses increase and the power produced by the faulty cylinder decreases.
The spectrum of the measured AE signal for an increased exhaust valve clearance confirms that the level of the signal is an important indicator of the presence of an exhaust valve clearance fault. The spectrum of the signal, in terms of its frequency content, its amplitude, and the sharpness of the peak, will be an indicator of the severity of the fault.
6. Conclusions
The acoustic emission signal measured on the cylinder head is shown to be effective for the detection of exhaust valve faults. The analysis in the angular domain provides a straightforward method to identify the malfunction of the exhaust valves. It was found that the main AE transients were generated by the combustion in each cylinder and the faults of exhaust valve can be reflected in these main AE transients through their influence on the combustions.
AE is an extremely powerful condition monitoring tool and the change of AE signal can clearly indicate the presence of fault in engine. In this paper the AE events associated with exhaust valve opening were clearly observed and the difference between healthy and faulty valves was shown.
The dominant AE events in the four-stroke diesel engine cylinder head are associated with the injector and fluid excitation. Valve events (exhaust valve opening), mechanical impacts, and gas flow excitation over the valve face are thought to be the main sources in the AE signal.
The valve opening and closing times and durations of AE signal are confirmed by the crank angles at which the valve opens and closes, for the exhaust valves for the healthy condition. A healthy and faulty valve condition shows different amplitude levels.
Further research work will be conducted to extract more features from the angular and angular-frequency results. The engine faults may then be identified using these features.