
Abstract
A combined experimental and analytical investigation of single proton exchange membrane (PEM) fuel cells, during cold start, has been conducted. The temperature influence on the performance of a single PEM fuel cell and the cold start failure of the PEM fuel cell was evaluated experimentally to determine the failure mechanisms and performance. The voltage, current, and power characteristics were investigated as a function of the load, the hydrogen fuel flow rate, and the cell temperature. The characteristics of cold start for a single PEM fuel cell were analyzed, and the various failure mechanisms were explored and characterized. In an effort to better understand the operational behavior and failure modes, a numerical simulation was also developed. The results of this analysis were then compared with the previously obtained experimental results and confirmed the accuracy of the failure mechanisms identified.
1. Introduction
Since the energy crisis of the early 70s, U.S. dependence on imported petroleum has remained one of the most pressing national security issues. Moreover, the fossil fuels consumption has brought about a number of social problems, as well, such as air quality deterioration, greenhouse gas emissions, and concentrated fossil fuel energy infrastructure. Hydrogen and fuel cell technologies emerged as one of the most favorable solutions to diversify energy resources and to solve the social problems along with other renewable energy explorations. Much research and developments have been carried out to advance hydrogen and fuel cell technologies, which could reduce the cost and enhance the efficiency and performance. Those efforts have successfully accelerated the advancement of hydrogen generation and storage, fuel cell applications, and related infrastructure. The Proton Exchange Membrane (PEM) fuel cells have been recognized as an outstanding candidate to be employed in the portable applications, such as automobile engines, to reduce fossil fuel demand and air pollution. The first use of a fuel cell system in space was in the Gemini program in August 21, 1962. More recently, successful applications of PEM fuel cells in automobiles have been reported in the past several years, and it promises to be a huge market in the next decades to offer clean energy for people [1]. Most hydrogen cars are currently only available in demonstration models or in a lease construction in limited numbers and are not yet ready for general public use [2]. Honda Inc. has leased its PEM fuel cells cars for the Japanese government and the U.S. government since 2008 and Nissan Inc. started testing a new fuel cell vehicle in Japan in 2009 [3, 4]. Despite the exciting advantages of the PEM fuel cells, there is a thermal issue on the PEM fuel cells working temperature range. Generally, when the temperature drops below freezing, not only will the performance of the fuel cells be severely reduced but also it is difficult to start up PEM fuel cells, as well, due to the temperature requirement for the liquid phase water in the Membrane Electrode Assembly (MEA) and Gas Diffusion Layers (GDLs).
The chemical reaction behind the fuel cell operation is surprisingly simple. The PEM fuel cells consume hydrogen and oxygen (from the air) to produce electricity with by-products of water and waste heat. The chemical reaction between hydrogen and oxygen is shown below.

The above equation indicates that for every two moles of hydrogen combining with one mole of oxygen, 571.6 KJ of energy is generated. Converting this to a more common unit of watts, a perfectly efficient fuel cell would deliver 7.94 W of heating power if it consumed hydrogen at a mass rate of 0.1 mol/h which would be 0.333 cc/s for the experiments under the standard conditions. When a large amount of hydrogen was consumed, waste heat would accumulate and the temperature would rise beyond the limit of the fuel cell working range. This raised temperature needs thermal management to keep the fuel cell temperature within the working range. Along with waste heat, water is another main issue of PEM fuel cells.
Since the heat and water management is critically important to the optimization of the steady state performance of PEM fuel cells and the cold start of subfreezing environmental temperature, many experiments have been conducted to study the water and temperature effects on the PEM fuel cells working and starting at a subfreezing temperature. [1–8]. These PEM fuel cell experiments or simulations were subjected to a series of freeze/thaw cycles to understand how the freeze/thaw cycles affected the inner components of the fuel cells as well as their performance. Hishinuma et al. [5] discussed the performance of a PEM fuel cell at the working temperature from
Based on the previous literature results, an experimental study has been conducted to study the PEM fuel cell performance and start-up behavior at the temperature above and below freezing. The temperature distribution within the fuel cell was monitored with a number of strategically placed thermocouples that were placed in the gas flow channel of the fuel cell and positioned in direct contact with the membrane electrode assembly (MEA). The information about temperature distribution could affect a better understanding how MEA temperature affects the fuel cell performance. Additionally, the flow rates of the two gasses used by the fuel cell—hydrogen and air—were measured as they entered the fuel cell and that data recorded. Current and voltage produced by the fuel cell were recorded, thus allowing the power output of the fuel cell to be calculated. The data collected along with other, gained through experiments, enabled the knowledge of PEM fuel cell performance in a harsh environment to assist commercialization of PEM fuel cell automobiles operating at subfreezing temperatures.
2. Experimental Facility
The in-house constructed PEM fuel cells were a double parallel gas flow channel design and a combination parallel/serpentine gas flow design, both shown in Figure 1. The white portions of the figures are channels of 0.32 cm (1/8 inch) wide and 0.24 cm (3/32 inch) deep, machined out of graphite plates. The black portions are the untouched graphite surface, which made direct contact with the MEA after the fuel cell was assembled. The two dots on each design are the gas fuel inlet and outlet. During our experimental tests, it was discovered that there was no difference between those two different gas channel designs in terms of PEM fuel cell performance under the same conditions.
Sketch of Channel configurations.

The single PEM fuel cells consisted of a commercial MEA with GDL (Nafion base), two monoplar plates of graphite, two thin nickel metallic sheets as the electrodes, and two polycarbonate supporting plates. The machined double parallel design of Figure 2 and the exploded view of the PEM fuel cell assembly of Figures 3(a) and 3(b) are shown hereinafter.
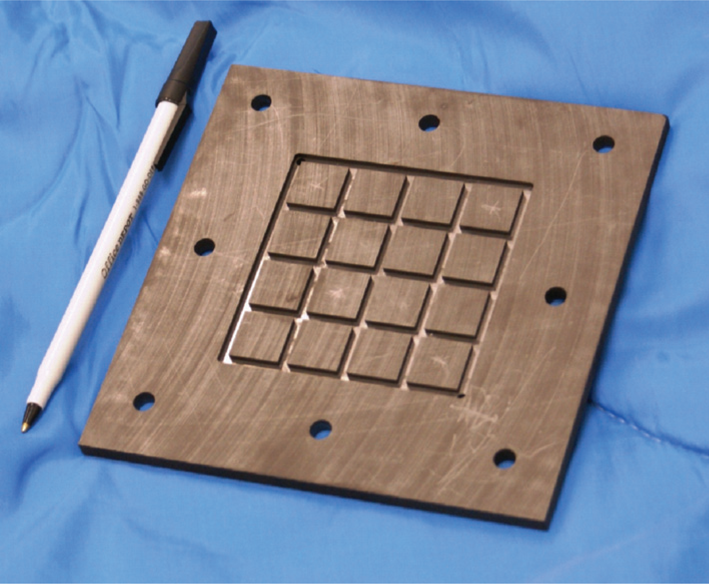
Double parallel design graphite plate.
Exploded view of the PEM fuel cell assembly of both gas channel designs.

With the development of single PEM fuel cells, an environmental chamber test station was built to control the single fuel cell operating temperature with a pair of cryostat baths. This test station enables the research on the PEM single fuel cells performance in a temperature range of
In the experiments, hydrogen and mixed gas (air, 21% oxygen) were forced through the groove on the graphite plate with flow valves. The gas humidification was controlled with conventional bubble humidifiers. The current and voltage were controlled with various electronic resistance loads. All data were collected through a data logger (a 40-channel thermocouple amplifier HP 34970A data acquisition system at a DAQ rate of 100 fps).
The experimental procedure is thefollowing: first, the in-house made single cell PEM fuel cell was tested at room temperature, 25°C. The power output, current, and voltage were tested against various hydrogen flow rates and electric resistance loads. Then, the single cell PEM fuel cell was put into the environmental chamber for an ambient temperature change from room temperature, 25°C, to subfreezing temperature,
3. Results of the Initial Single Fuel Cell Experiments at Room Temperature
The results from the initial ambient room temperature tests are shown in Figure 4. In these tests, experiments were conducted by varying flow rates of hydrogen while monitoring the voltage and the current changes, due to the different hydrogen flow rates to find out the effects of hydrogen flow rate on the in-house built single PEM fuel cell performance. A 3 Ω resistance load was applied as the load in the tests. The fuel cell was oriented vertically. The air flow rate was approximate 36 cc/min. It was shown in Figure 4 that the hydrogen flow rate changing from 10 cc/min to 30 cc/min had no influence on the current, while the potential did experience a rise at the flow rate between 10 cc/min and 20 cc/min. Based on those test results, it was decided to use the hydrogen flow rate around 10–20 cc/min as the optimal flow rate, because the results seemed to indicate that the fuel cell could get the best performance at that flow rate range.

The performance of fuel cell (Voltage, current, and power) versus hydrogen flow rate.
In order to ensure the conclusion that there was no influence of hydrogen flow rate on the performance of single PEM fuel cells, it has been tried in experiments with higher flow rates. Figure 5 shows the performance of the fuel cell over time using flow rates of hydrogen between 114 and 260 cc/min. A flow rate of air at 360 cc/min was used for these tests. The two gas fuels were connected in a count-flow orientation and a 3 Ω load was used, as well.
The high hydrogen flow rate tests.

As shown in Figure 5, there was no change in the performance of the fuel cell even though the hydrogen flow rate had been dramatically increased from the previous highest rate of 32 cc/min to 260 cc/min. Thus, the flow rates of hydrogen flowing around 10–20 cc/min have been adopted for the remaining tests.
Additional tests have been carried out to find the best performance of the single PEM fuel cells by changing the load to the fuel cells, as shown in Figure 6. The tests were conducted at ambient room temperature. Still, the two gas fuels were connected in a count-flow orientation. The flow rate of hydrogen was 20 cc/min and the flow rate of air was 260 cc/min. It was found that with increases of the potential, the current would decrease and the power output would decrease in spite of the increase of potential. The results demonstrated that a high current would be desirable in the future cold start tests at subfreezing temperatures to get the maximal heating effect.
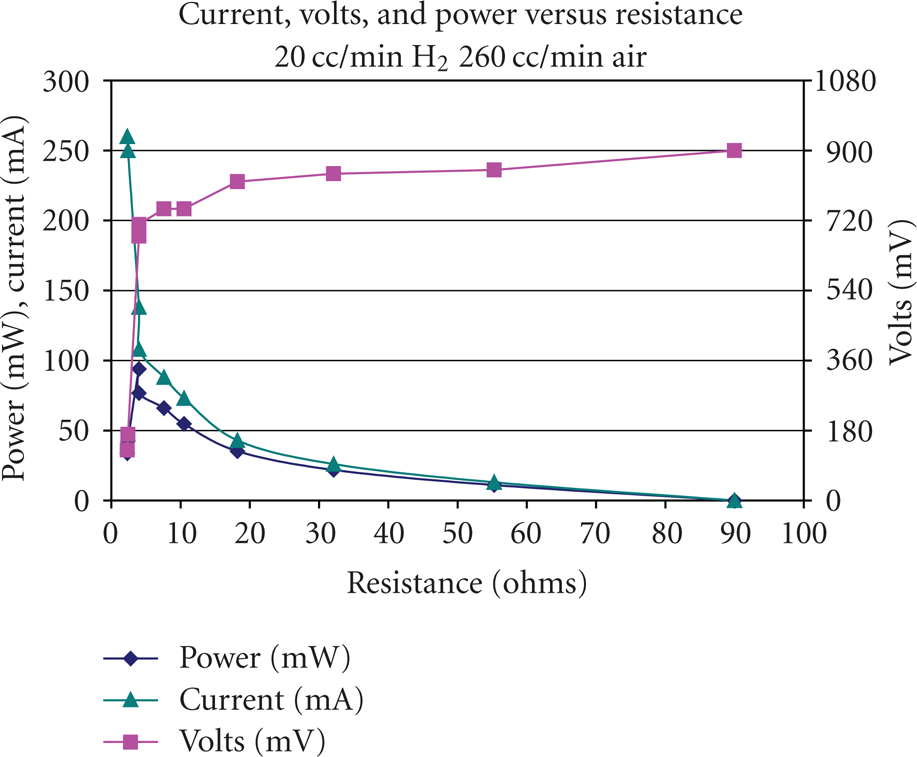
The performance of fuel cell versus the load at hydrogen flow rate of 20 cc/min.
4. Experimental Results of the Single Fuel Cell in an Environmental Chamber above
C
After the ambient temperature tests were finished, subfreezing temperature tests were carried out in the environmental chamber. The first test focused on the ambient temperature above 0°C. A hydrogen flow rate of 20 cc/min and an air flow rate of approximately 260 cc/min were employed. A 46 Ω resistance was used as a load. The results of the test are shown in Figures 7 and 8.
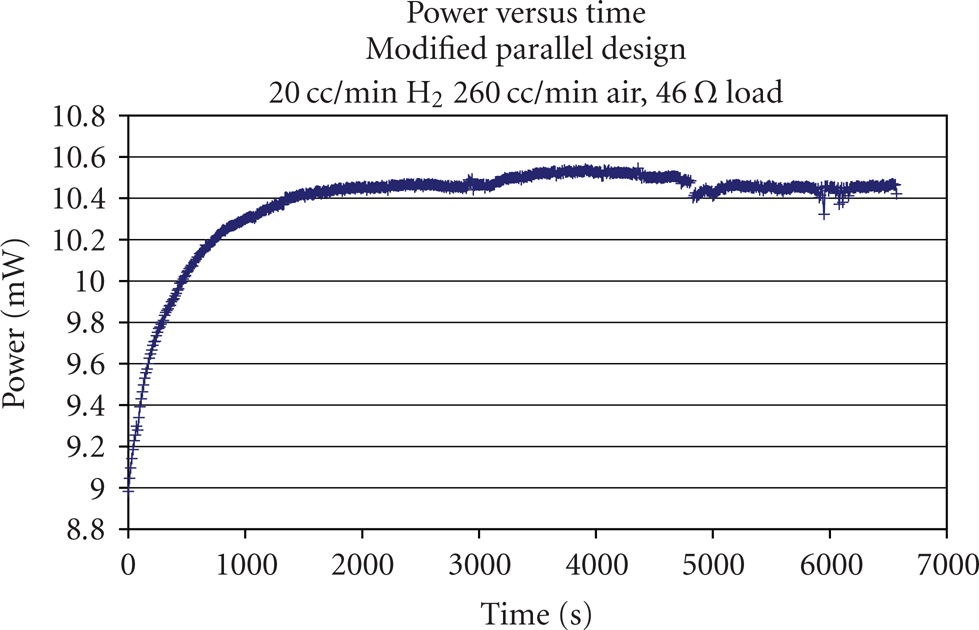
The power of fuel cell vs. time at the fuel cell temperature decreasing from 25°C to 10°C.

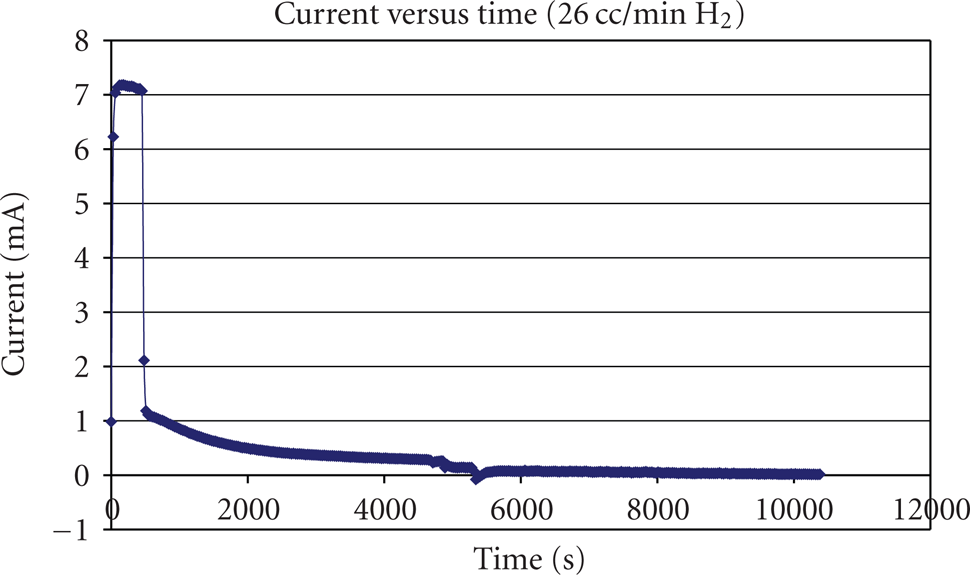
The current of fuel cell vs. time at fuel cell temperature decreasing from 25°C to 10°C.
It was found that when the ambient temperature was set to be 0°C, the temperature of the MEA in the single PEM fuel cell would decrease from 22°C to 12°C in a time period of 6000 seconds. However, even with a load of 46 Ohms to generate a small desired power output, the single PEM fuel cell still could successfully start up at this 0°C environment and was able to keep the power output at a stable value after the fuel cell started up. This result means that enough heat was generated by the fuel cell reaction to keep the water produced, from freezing in the gas channel and in the gas diffusion layer. The reaction and proton diffusion were not affected by the 0°C environmental temperature in the testing time period.
The current change after the cold start at 0°C was presented in Figure 8. It was clearly shown that the current quickly rose to the stable value and kept the value in the test time period. No deterioration of current value has been observed.
For the next subfreezing temperature test, the same fuel cell was tested again under the same conditions as before except that the ambient temperature was set to

The current versus time at temperature of
As a result, the experimental tests on the single PEM fuel cell demonstrated that the performance and startup of single PEM fuel cell had not been affected by the ambient temperature above
5. The Cold Start and Performance of a Single PEM Fuel Cell at
C
The evolution of the current and power output of the single PEM fuel cell at a load of 46 Ohms is presented in Figures 10 and 11. Once the electric circuit was connected, both the single PEM fuel cell current and power output quickly rose to their maximums of 7 mA and 11 mW first and stayed at the neighborhoods for a few minutes. Then both the current and power output quickly dropped to the values of 1 mA and 1 mW. Finally, both slowly decayed to zero in the last 10000 seconds. Due to fact that the membrane was dry before the test, water produced would be absorbed by the membrane, which enabled further chemical reaction. After a few minutes, too much water had been generated, while there was not enough heat to maintain the water in the liquid phase at the temperature of
The evolution of current versus time at the temperature of
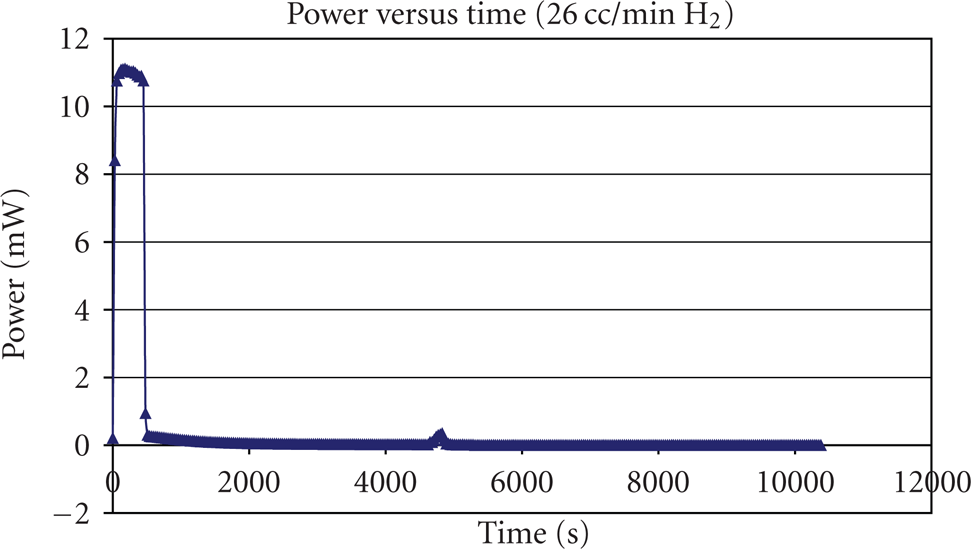
The evolution of power output versus time at the temperature of
The reasons for the failure of startup would be first; once the single PEM fuel cell started, water and heat would be the by-product along with the electrical current and power output, and the heat generated during the first several-minute chemical reaction was not enough to stop the water produced from freezing in the gas diffusion layer and on the catalyst layer. Once the ice started to cover the reactive area of the membrane and blocked the absorption and diffusion of gas molecules, the current and power output dropped and then decayed to zero. The reason that the current and power output kept at their maximums for a few minutes was due to the fact that at a low current, only a small amount of water was produced, and it needed a relatively long time period to accumulate enough water to cover the cathode catalyst active area; once the enough water had been produced and frozen to ice, the single PEM fuel cell started to fail.
Next, a small load of 3 Ohms was employed to study the cold start of a single PEM fuel cell at a relatively large initial power output. As shown in Figures 12 and 13, the current increased to a maximum of 8 mA quickly, as did the power output. Then, instead of staying in the region of their maximum of their maximum value for a few minutes, both started to drop immediately. This decrease took a relatively long time period for both current and power output compared to the first

The current versus time of the cold start of a single PEM Fuel cell at
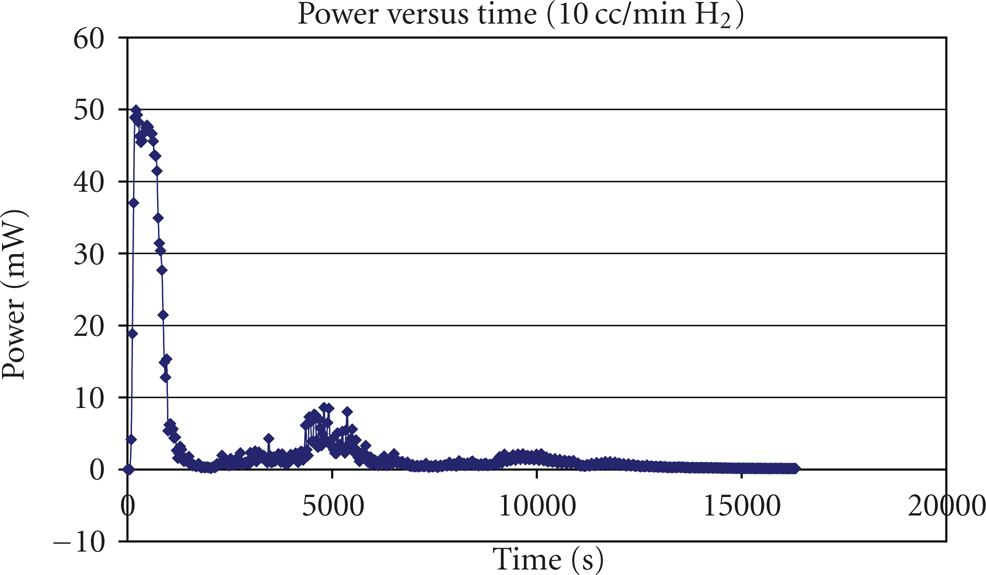
The power output versus time of the cold start of a single PEM Fuel cell at
The difference between the previous cold start at
The reasons for the differences are, first, even though care has been taken to keep the membrane equally dry for both tests, there was still plenty of residual water in the membrane in the second test. This is illustrated by the fact that the current and power output did not stay around at the maximums. Second, along with the higher power output, the single PEM fuel cell was able to produce much more heat in the second test than that in the first test. The icing process of residual water in the second test was much slower than that in the first test, as evidenced by a gradual decrease of both current and power output. Third, the fuel cell would try to restart if the icing was reduced. Since the air flow was not stopped after the cold start failure, the air would blow the water molecules with it out of the single PEM fuel cell. Once the protonic conductivity re-established, the single PEM fuel cell would have a secondary maximum on both current and power output, which was the sign of fuel cell restart. However, due the same reason that water produced in the chemical reaction would freeze soon at the temperature of
6. Model Description and Assumptions
In order to understand the inner working mechanism of PEM Fuel cells, numerical computational simulation efforts have been devoted to gain insight of the heat/mass transfer, gas/liquid flow, electrochemical kinetics, and power density [11–14]. Ferng et al. [11] employed a two-phase multicomponent flow model and a simplified electrochemical reaction equation to study PEMFC performance under the influence of operating temperature and pressure and low characteristics within the cell. The simulation results have been compared with experimental data, which illustrated the increase in cell performance at elevated temperature. Siegel et al. [12] adopted a two-dimensional model, which includes the transport of liquid water within the porous electrodes as well as the transport of gaseous species, protons, energy, and water dissolved in the ion conducting polymer. Electrochemical kinetics are modeled with standard rate equations adapted to an agglomerate catalyst layer structure. Some of the physical properties used in constructing the model are determined experimentally. Zhang et al. [13] applied the Powell algorithm to find the optimum values of multiple parameters while optimizing the potential of the electrolyte phase at the membrane/cathode interface at a typical value of the cell voltage.
The current simulation domain consisted of two gas diffusion layers and one sandwiched active catalyst layer, as shown in Figure 14. The active catalyst layer was 100 microns thick and 2000 microns long, while the gas diffusion layers were 250 microns thick and 2000 microns long with a center deformation of 100 microns deep and 500 microns long due to the pressure of graphite plate gas channel assembling. The hydrogen moved from the bottom entrance up to the top exit, while the air entered through the top opening and exited at the bottom opening. The protons were generated at anode side and migrated to the cathode side. Water was generated due to the chemical reaction on the cathode side. Water was experiencing a migration with proton from the anode side to the cathode side and a concentration-osmotic diffusion from cathode to the anode. The gas fuels and water transportation inside the porous layers were treated as continuous phases in homogeneous porous media with uniform morphological properties. The pressure and flows inside the porous media were controlled by Darcy's law and Maxwel-Stefan mass transport model [14]. The current density in the active layer was calculated by solving the diffusion equation and the Butler-Volmer electrode kinetic equation under constant electric and ionic potentials. The simulation was conducted with Comsol 3.4 package [15].

The sketch of the PEM fuel cell domain.
A conductive media DC application mode describes the potential distributions in the three subdomains using the following equations:

Here
The charge-transfer current density expression is described using the Butler-Volmer electrochemical kinetic expression, as a boundary condition. For the electrolyte potential equation, this results in a condition where the inward normal ionic current densities at the anode and cathode boundaries, i a and i c , are specified according to the equation:
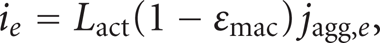
where the index e stands for “a” (anode) or “c” (cathode). Further, Lact is the active layer's thickness (m), its porosity εmac (the macroscopic porosity), and
The agglomerate model describes the current density in an active layer consisting of agglomerates of ionic conductor material and electrically conducting particles covered partially with catalyst. The local current density can be expressed analytically by solving a combination of the diffusion equation and the Butler-Volmer electrode kinetic equation for an agglomerate with constant electric and ionic potentials. The resulting equations for the current density in the anode and cathode are

where, again, the index e stands for “a” (anode) or “c” (cathode), and
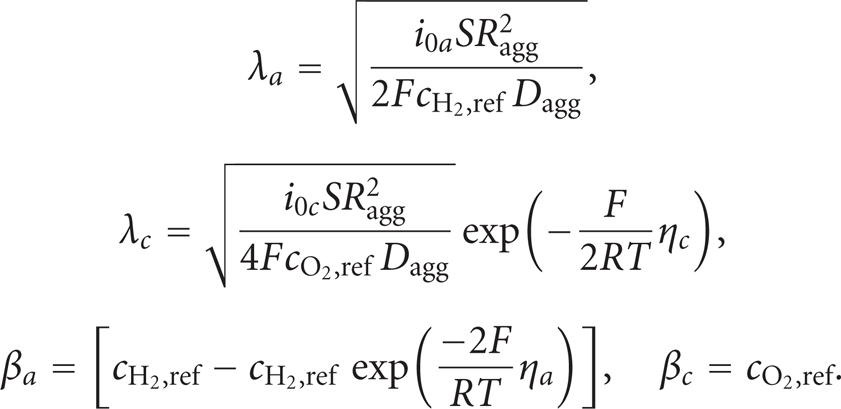
In these equations, Dagg is the agglomerate gas diffusivity (m2/s), Ragg is the agglomerate radius (m), η
e
is a “charge transfer” number (“a” for the anode and “c” for the cathode), S is the specific area of the catalyst inside the agglomerate (1/m), and F is Faraday's constant (C/mol). Furthermore,

where Eeq (V) denotes the equilibrium voltage.
The anodic and cathodic reference states were equal to the molar fractions at the inlet channels of the anode and cathode, respectively, at 1 atm. The dissolved hydrogen and oxygen concentrations at the surface of the agglomerates are related to the molar fractions of the respective species in the gas phase through Henry's law:

where K is Henry's constant (
For the electric potential, the electrode boundary conditions are identical, setting the boundary normal current density but using the opposite sign. In addition, the potential difference between the cathode and anode current collectors corresponds to the total cell voltage. Choose the potential at the anode current collector as the reference level by setting it to zero. Then the total cell voltage serves as the boundary condition at the cathode current collector:

To model the gas flows in the gas backings, the Darcy's Law application mode has been used. The gas velocity is given by the continuity equation according to

where ρ is the mixture density of the gas phase (kg/m3) and u denotes the gas velocity (m/s). The flow velocity in porous media is determined by the gradient of pressure, the viscosity of the fluid, and the structure of the porous media according to Darcy's law:
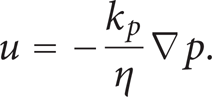
Here k
p
denotes the electrode's permeability (m2), η represents the gas viscosity (
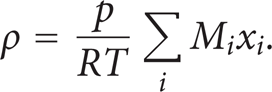
In this equation, R denotes the gas constant (J/(mol·K)), T is the temperature (K), M is the molar mass (kg/mol), and x is the mole fraction.
At the electrode boundary for the anode and cathode, the gas velocity is calculated from the total mass flow given by the electrochemical reaction rate according to
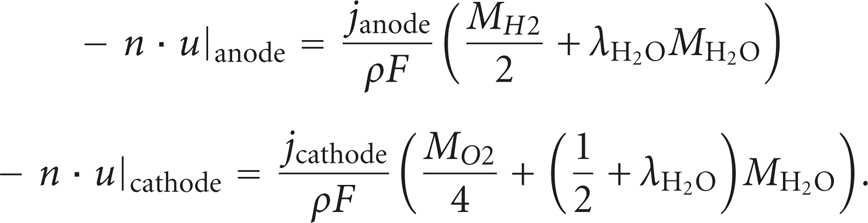
Combined with these boundary conditions, Darcy's law determines the gas flow velocity and preserves the total mass conservation in the anode and cathode gas backing.
For the mass transport in the porous layer, the Maxwell-Stefan Mass Transport model takes into account two species in the anode— H2 and H2O —and three at the cathode— O2, H2O, and N2. The model uses one instance of the Maxwell-Stefan Diffusion and Convection application mode for each electrode. Maxwell-Stefan multicomponent diffusion is governed by the equations

which the software solves for the mass fractions, w i . This particular PEM fuel cell model assumes that the temperature-driven diffusion is insignificant and sets the source term, R, to zero. For the cathode gas, with three species (oxygen = 1, water = 2, nitrogen = 3), the mass transport is described by the following three equations together with Darcy's law, describing the flow rate:

Here p is the pressure (Pa), T is the temperature (K), and
Finally, the feed-gas mass fractions are specified at the inlets. At the outlets, convective flux boundary conditions are applied, meaning that the flux is convection dominated. At the electrode-membrane boundary, the mass fluxes of hydrogen in the cathode, and of oxygen and water in the cathode, are determined by the electrochemical reaction rate:

7. Simulation Results on the Single PEM Fuel Cells at the Temperature above and below
C
For the simulation of cold startup at the temperature of

The current density on the active layer. The arrows are the flow velocity of each gas fuel (hydrogen and Oxygen) at
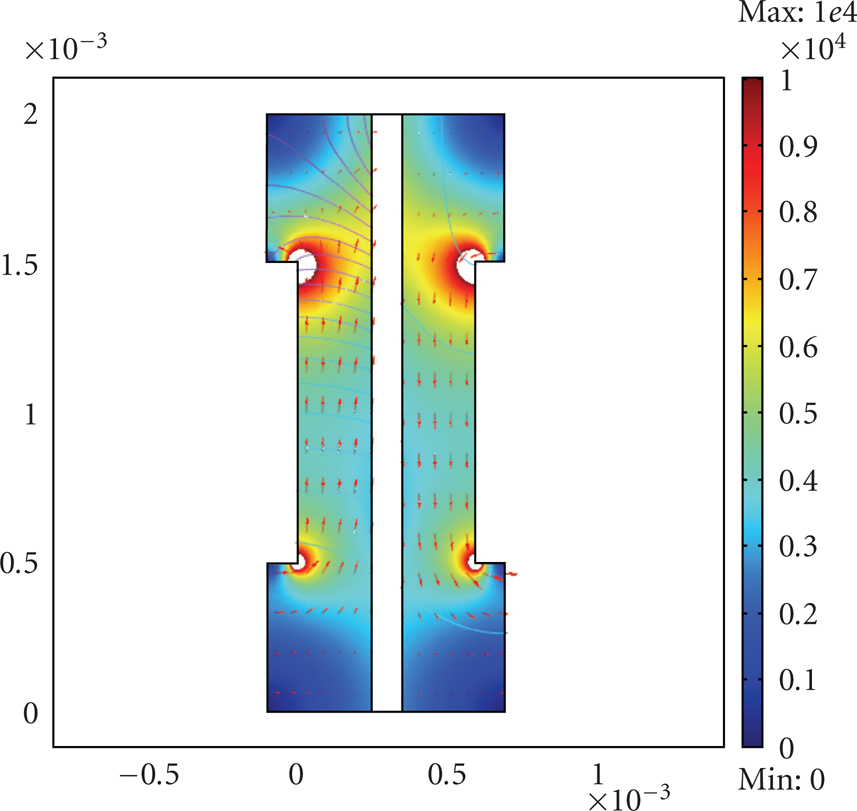
The current density in the anode and cathode layers. The arrows are the flow velocity of each gas fuel (hydrogen and Oxygen) at
The simulation results at the temperature of

The current density on the active layer. The arrows are the flow velocity of each gas fuel (hydrogen and Oxygen) at
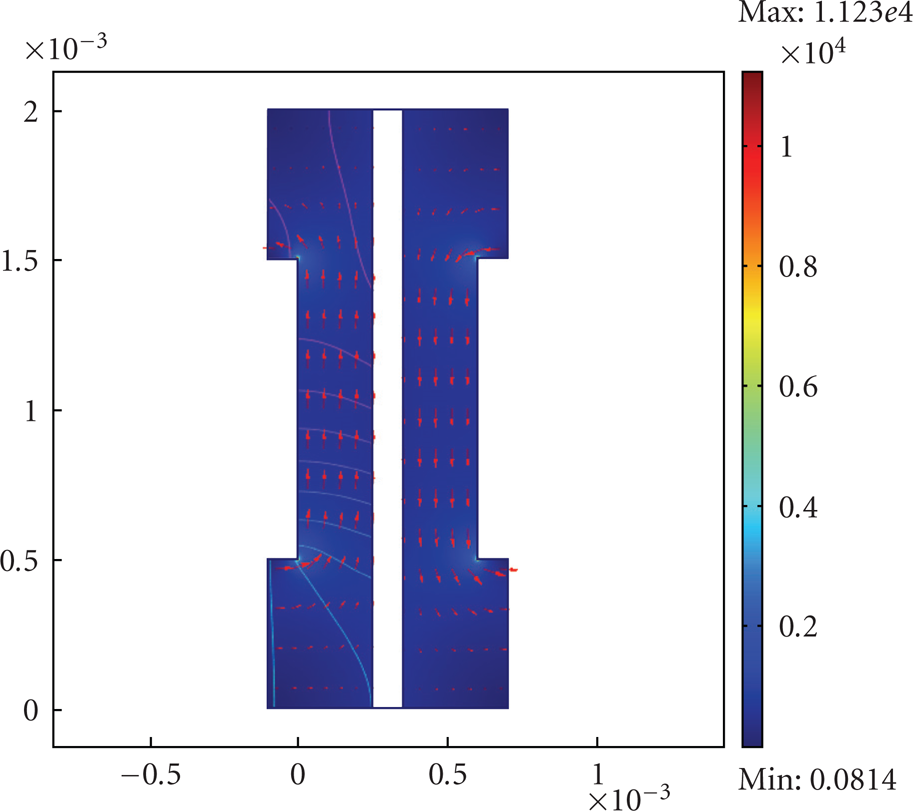
The current density in the anode and cathode layers. The arrows are the flow velocity of each gas fuel (hydrogen and Oxygen) at
The simulation results echoed the experimental conclusion that, at the temperature above
8. Conclusions
A series of experiments on the cold start behavior of single PEM fuel cells has been conducted, and the results of current and power output against time and temperature have been presented. From the basic investigation of single PEM fuel cells under different hydrogen flow rate and different load, cold starts of single PEM fuel cells at temperatures above and below
Footnotes
Acknowledgment
The authors would like to acknowledge the financial support from The University of Toledo through the startup funding and the 2008 fall senior design group.