
Abstract
We study the problem of water transport in the ionomer-phase of catalyst coated membranes (CCMs) for proton exchange membrane fuel cells (PEMFCs), where microscopic-scale phenomena at the distributed interfaces between structural components control the water management. Existing models for water transport in CCMs describe the transport in systems which consist exclusively of an ionomer-phase. Interfacial water fluxes across distributed interfaces representing various mechanisms of water transfer between ionomer and catalyst layer pores are not captured properly in these models. Here we develop a continuum model for water transport in CCMs using the method of volume averaging. Water is exchanged between ionomer and the catalyst layer pores by electro-osmotic discharge (EOD) through the three-phase boundary (TPB) regions and by sorption and desorption across the ionomer-pore interfaces. While the former mechanism does not affect directly the water content in the ionomer-phase, it represents an effective mechanism for water transfer during fuel cell operation and controls directly the water saturation in the catalyst pores.
1. Introduction
Catalyst layers for proton exchange membrane fuel cells (PEMFCs) are heterogeneous porous structures consisting of interpenetrating phases for the transport of electrical charges, electroactive gaseous species, and water. During fuel cell operation, water is transferred between the catalyst layer pores and ionomer by parallel mechanisms. These phenomena control the water management and must be captured in models for water transport in the catalyst layer components. The macroscopic equation for water transport in catalyst coated membranes (CCMs) has been frequently derived for use in computational fluid dynamics (CFDs) simulations, by performing a water flux balance over a control volume representing 100% ionomer-phase. The resulting equation is thus valid solely for the water transport in proton exchange membranes (PEMs) and does not capture the interfacial transport phenomena at subgrid scale which are specific for catalyst layers. The consequence is that some of the mechanisms for water transfer between ionomer and catalyst layer pores have not been conceptualized and quantified until recently. Moreover, there seems to have been a lack of consensus in the interpretation of the macroscopic equation for water transport in CCMs. The reader is referred to [1, Section 7] of the critical overview of CFD multiphase models for PEMFCs [1]. In the previous modeling works, interfacial transport phenomena across the ionomer boundaries have been interpreted as mechanisms of water transport along the ionomer-phase, or vice versa. This had a strong impact on the prediction of the water content in the ionomer-phase of CCMs and on the liquid saturation in the diffusion media. The misinterpretation of the effect that various terms have on the prediction of water accumulation in ionomer may be attributed in part to the lack in the literature of a formal derivation of a continuum model for water transport in CCMs.
An objective of this paper is to present a continuum model for water transport in the ionomer-phase of catalyst layers for PEMFCs, starting from the point equations for conservation of charge and for water concentration in ionomer-phase. Another objective is to emphasize various mechanisms of water transfer between the ionomer-phase and its surroundings, some of which have not been conceptualized and quantified until recently [2–4]. Another objective is to identify those mechanisms that affect water accumulation in the ionomer-phase of the catalyst layer.
The study of water transport in the ionomer-phase of catalyst layers for PEMFCs requires the consideration of a hierarchy of length scales over which significant changes in the parameters related to structure, processes, and operating conditions occur. Figure 1 illustrates the hierarchical structure of the catalyst layer system representative of PEMFCs and some of its characteristic length scales are suggested.

Hierarchical structure for catalyst layer system.
Level I represents a CCM consisting of a PEM impermeable to gases and two catalyst layers bounded on each of its sides. The characteristic length scale associated with this level is the catalyst layer thickness (∼10μm), which is the distance over which significant changes in current density, water content, and concentrations of electroactive species occur. This is the macroscale at which the fuel cell operation is modeled and the parameters associated with this level, such as current density, water concentration, or water flux represent macroscopic,averaged quantities.
Level II evokes that catalyst layers are porous structures with a random composite morphology, consisting of a mixture of carbon-supported Platinum (C/Pt) and solid ionomer. They provide continuous paths for the protonated complexes to reach the catalyst sites through the ionomer network, for the electroactive species through the porous network and for the electrons through the C/Pt matrix. Level II defines the microscale at which the principal microstructural features of the catalyst layer morphology are described. The C/Pt matrix consists of carbon grains (20–40 nm) which form agglomerates of 200–400 nm size. Their porous structure is characterized by a bi-modal pore size distribution, with primary pores of 20–40 nm inside the agglomerates and secondary pores of 40–400 nm between the agglomerates. The size of the catalyst particles dispersed on the carbon grains is ∼2–5 nm. Ionomer, due to its molecular size, cannot penetrate the intra-agglomerates, but exist only in the interagglomerate space [5]. Since the electrochemical reactions take place at the three-phase boundary between the gas pores, ionomer and catalyst sites, only the Pt particles in the interagglomerate pores are electrochemically active. During the catalyst fabrication process, the ionomer organizes itself into clusters with diameters of a few hundred nm [6, 7]. The length scale associated with this level is a representative configuration length such as diameter of the C/Pt agglomerate or diameter of the ionomer cluster.
Level III illustrates the ionomer details at nanometer scale. The most widely investigated solid ionomers, the perfluorinated sulfonic acid polymers (e.g., Nafion) are heterogeneous media. They consist of a hydrophobic polytetrafluoroethylene framework with pendant side chains ending in sulfonic acid groups
The nanometer-size regions at the interface between ionomer, C/Pt and catalyst layer pores filled with electroactive gaseous species are referred to as three-phase boundary (TPB) regions. These are electrochemically active regions where the hydrogen oxidation reaction (HOR) or the oxygen reduction reaction (ORR) takes place. These regions are dynamic and their behavior depends on the hydration state of the ionomer. At the interface, the
At the nanometer-scale level, proton transfer is interpreted as a combination of proton transport in bulk-like water and interfacial interactions with the
The distribution of excess protons relative to the immobile
In their motion generated by the vehicle mechanism, excess protons carry the water molecules in their solvation shells as well as other water molecules due to viscous interactions, generating a water transport mechanism called electro-osmotic drag. The electro-osmotic drag coefficient ndragis defined as the ratio of the water flux
Whereas at nanometer scale (Level III) the ionomer represents a heterogeneous system with the characteristic length of only a few nanometers, the average size of the ionomer clusters (∼100 nm) is large enough so that at the microscale (Level II) the ionomer-phase may be considered homogeneous. The consequence of this assumption is that one may prescribe microscopic, point equations for the transport of protons and water in the ionomer-phase. This is considered a trivial practice when modeling transport phenomena in PEM systems consisting of 100% ionomer-phase, in which case the microscale (Level II) and macro scale (Level I) are indistinguishable. In the case of catalyst layers, the microscopic point equations governing the transport in the ionomer-phase at micro scale (Level II) must be solved along with the boundary conditions describing various mechanisms of water and proton transport across ionomer-TPB and ionomer-catalyst layer pore interfaces. However, this direct analysis is impractical due to the complex morphology of the catalyst. The practical solution is to apply the method of volume averaging [13–18] for the derivation of continuum transport equations that are valid anywhere in the catalyst layer. These transport equations, called volume-averaged equations, may be solved at the macro scale (Level I) and allow the consideration of the catalyst layer as a macro-homogeneous domain. The volume-averaged equations retain the information regarding interfacial transport across ionomer-phase boundaries.
In the following sections we will present the local, microscopic equations governing proton and water transport in ionomer-phase (Level II) along with their boundary conditions and we will derive the volume-averaged equations for conservation of charge and water transport in catalyst layers (Level I). The scope of this analysis is to emphasize various mechanisms of water transfer between the ionomer-phase and its surroundings, some of which have not been conceptualized and quantified until very recently. For this analysis we consider the following assumptions.
At the micro scale (Level II) the ionomer-phase is considered a homogeneous medium for the transport of water and proton-bearing complexes.
The TPB regions are envisioned as surfaces of discontinuity between the ionomer-phase and electrically conductive solid phase (C/Pt), rather than lines of discontinuity between ionomer, C/Pt and catalyst layer pores filled with electroactive species. Indeed, the diffusion coefficient of oxygen is sufficiently large, so that oxygen can diffuse efficiently through the ionomer towards the Pt sites up to ∼200 nm [19] (compared to ∼1 nm interface thickness) and the reaction rate is not controlled by mass transport limitations in the Nafion coating. Furthermore, this interface is considered immaterial and therefore unable of accumulating mass and charge, namely,
Protons may enter and exit the ionomer-phase only when they cross the TPB regions (ionomer/electrically-conductive solid interfaces, labeled is) as they participate in electrochemical reactions. In order to satisfy ionomer-phase electroneutrality, protonated complexes do not leave the ionomer across the interfaces with the liquid water in the catalyst layer pores and thus are unable to migrate towards the Pt sites in the intra-agglomerate space. The liquid water layer ∼1-2 nm thick adjacent to the ionomer-phase and containing protonated complexes is assimilated to the hydrophilic domains and is considered to be integral part of the ionomer. Therefore, the proton flux across the ionomer-fluid interfaces, labeled if, is zero,
The C/Pt agglomerates are fixed solid structures. Their interface with the ionomer is fixed once the ionomer has been hydrated and the velocity of this interface is zero,
2. Microscopic Equations for Conservation of Charge and Water Transport in the Ionomer-Phase
The catalyst layer system under consideration is a porous mixture with a solid matrix consisting of an electrically conductive phase-s (carbon-supported Pt) and a proton-conductive phase-i (ionomer) available for protons and water transport. The primary and secondary pores of the C/Pt are filled with gaseous electroactive species and liquid water. For the derivation of the governing equations for the concentration of protons and water in ionomer we will be focusing on the transport phenomena in the ionomer and will not make distinction between the fluid phases-f in the primary and secondary pores of the carbon-supported Pt.
2.1. Microscopic Equation for Conservation of Charge in Ionomer-Phase
The microscopic equation which governs the proton transport in ionomer-phase (equation for conservation of charge) can be expressed as

in which the second subscript i indicates that the variables are related to the ionomer phase. At the TPB regions (is-interface), the boundary condition associated with (1) is

in which

which states that the proton flux between the ionomer and the TPB region is balanced by the rate of proton production at anode during HOR or the rate proton consumption at cathode during ORR.
2.2. Microscopic Equation for Water Transport in Ionomer-Phase
The microscopic equation that governs the water transport in ionomer is

The local velocity of water may be decomposed into an average hydrodynamic fluid velocity and a diffusion velocity

such that the total water flux
Considering that TPB regions do not accumulate mass and the velocity of the TPB regions is zero (second and fourth assumptions) and considering the water flux within the TPB region to be constant, the boundary condition associated to (2) at the TPB regions reduces to the following form:

which states that the water entering the TPB region from the ionomer-phase and the water produced in the ORR exits the TPB region into the catalyst layer pores (Figure 2).

Water fluxes between the TPB regions (is-Interface), ionomer (i), and catalyst layer pores (f).
Unlike protons, water may be transferred by sorption or desorption across the if-interfaces between the ionomer and the catalyst layer pores. At these interfaces, the boundary condition associated to (2) is

3. Volume-Averaged Equations for Conservation of Charge and Water Transport in CCMs
The volume-averaged transport equations are obtained by application of the averaging theorems to the local, microscopic transport equations. An averaging control volume (Figure 3) has volume Vol fixed in space and time surrounded by an enveloping surface of area A. Its size

Averaging volume.
The ionomer-phase within the averaging control volume has volume
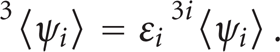
The following averaging theorems that relate the averages of the space and time derivatives of property ψ i to the space and time derivatives of the average of ψ i have been proposed [13, 14]


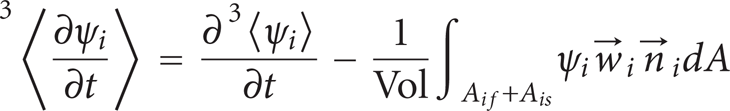
in which

3.1. Volume-Averaged Equation for Conservation of Charge in CCMs
Application of the averaging theorems (5b) and (5c) to the microscopic transport equation (1) yields the volume-averaged equation for conservation of charge

We note first that

The proton flux across the ionomer/solid electrically conductive phase (C/Pt) interface A i,s .

in which
The volume-averaged equation for conservation of charge (8) states that:
“The change in proton flux across a control volume (averaging volume) is equal to the total interfacial flux of protons across the TPBs distributed in the control volume, when protons engage in electrochemical reactions”.
The total interfacial flux of protons across the TPBs within the averaging volume
Considering the boundary condition (B.C.1a) we can write

where the operator
The volume-averaged equation for conservation of charge can now be written as

which states that:
“The change in proton flux across a control volume (averaging volume) is equal to the volumetric rate of proton production during HOR or proton consumption during ORR”.
Multiplying (8) by the Faraday constant we obtain the equation for current density

in which

3.2. Volume-Averaged Equation for Water Transport in the Ionomer-Phase of CCMs
Application of the averaging theorems (5b) and (5c) to the microscopic equation for water transport in ionomer (2) and using relations (4) and (6) yield the volume-averaged equation for water transport in CCM

in which the total water flux was written as the sum between an electro-osmotic drag flux and a diffusion flux (Section 2.2).
The electro-osmotic drag coefficient is obtained experimentally [20] by measuring the current density (total proton flux) and the water flux throughout a PEM

Using (8), (11), and (14), the second term in (13) may be further written as

The term
The second term,
The third term in (13) represents water transport by diffusion and is equal to
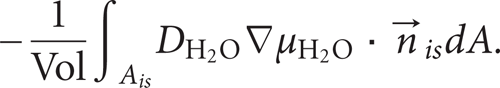
The last term in (13) representing the fluxes of water across the interface with the fluids in the catalyst layer pores and across the TPB regions may be deconvolved as

The first term in the RHS represents the water exchanged between ionomer and catalyst layer pores by sorption and desorption. The second term in the RHS represents the water exchanged between ionomer and TPB regions by diffusion at nonequilibrium and is equal to
The last term represents the volumetric rate at which water molecules in the solvation shells of the protonated complexes are dragged in or out of the ionomer when they cross the TPB as they participate in the HOR or ORR. This transfer mechanism was called “electro-osmotic discharge” (EOD) [1]. Using (14) and (11), this term is equal to

and therefore it cancels with the first term in the RHS of (15). Indeed, the water that would accumulate in the ionomer-phase of a control volume at cathode as a result of the difference between the incoming and outgoing electro-osmotic drag fluxes is removed from the ionomer by electro-osmotic discharge.
Inserting expressions (15)–(18) in (13) and considering the relation between molar concentration of water in ionomer and water content

The integral terms in (19) which are subgrid-scale phenomena represent distributed sources or sinks for water in ionomer that are zero in a PEM. If water does not accumulate in the TPB regions, it will be at equilibrium with the adjacent water in ionomer and the last term in (19) is zero. The volume-averaged equation for water transport in the ionomer-phase of CCMs may be finally written as

where for the sake of simple notations the averaging symbols were dropped.
In PEMs,

In this case, the term standing for EOD is zero, since in PEMs
4. Calculations
Equations (12) and (20) for current density and water content in CCM were solved along with the volume averaged-equations for the conservation of mass, species, and momentum in the PEMFC components using ANSYS-CFX 4.4 software. The 3-dimensional computational domain consisting of an anode channel, anode gas diffusion layer (GDL), CCM, cathode GDL, and cathode channel is illustrated in Figure 5. It extends from the channel inlets to channel outlets and from the symmetry plane along the channels to the symmetry plane between two adjacent channels.
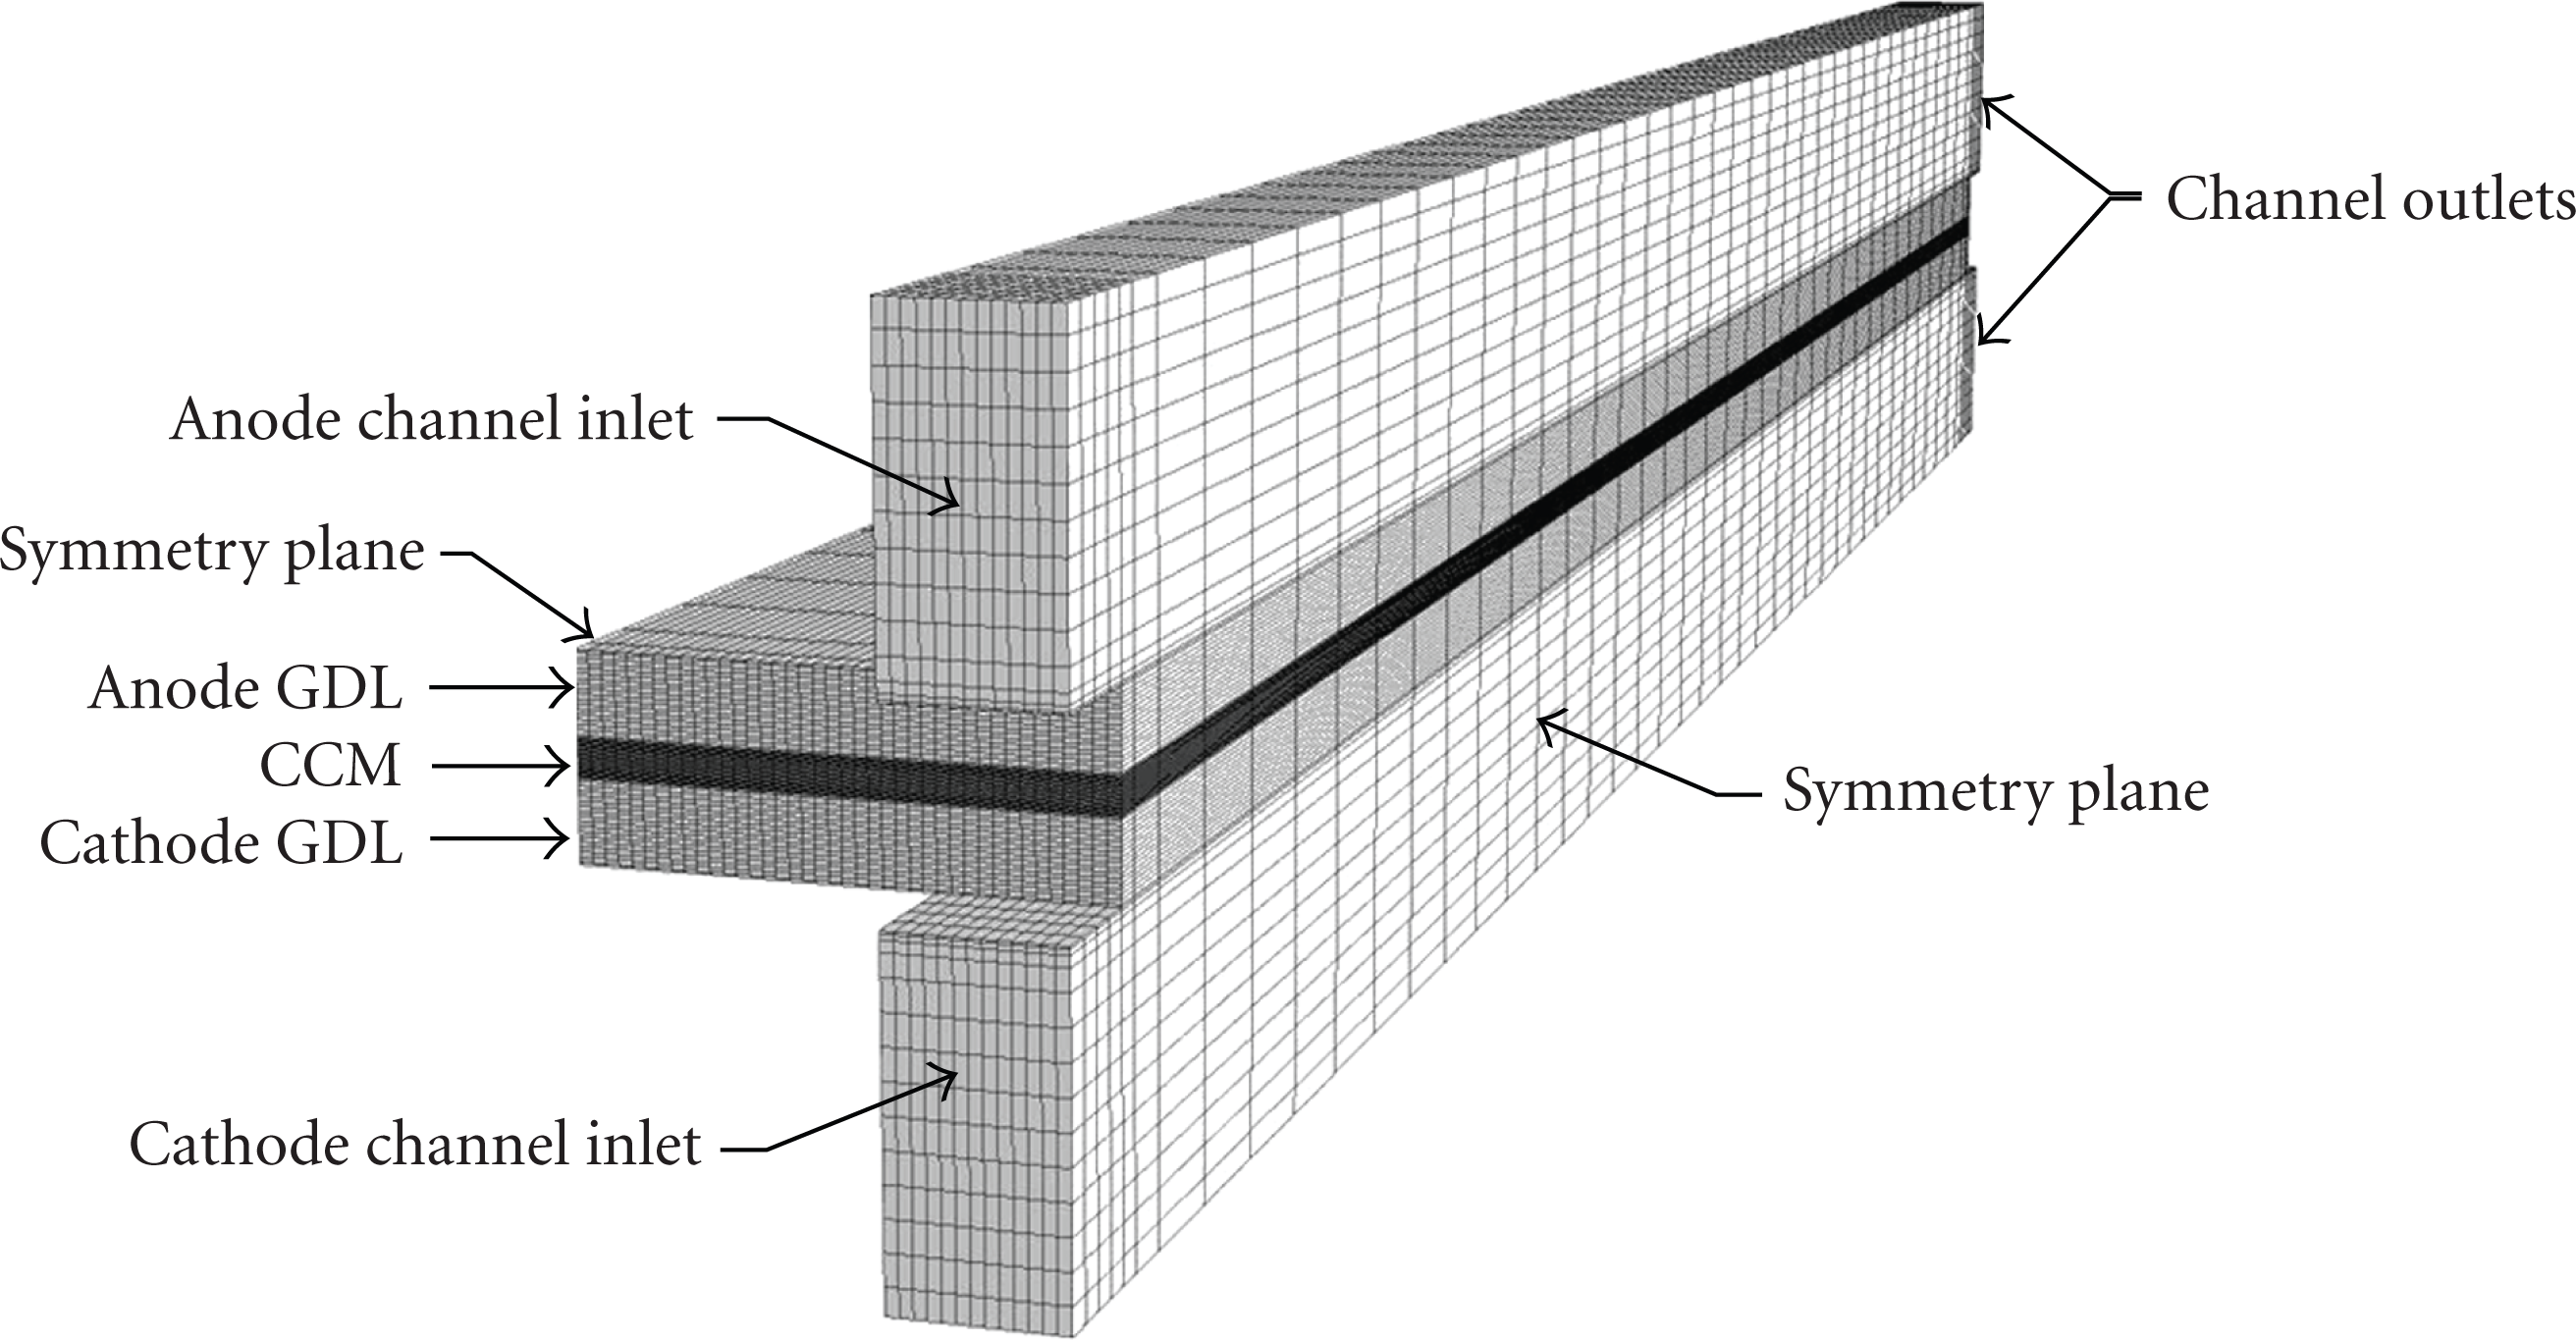
Computational domain and mesh.
The transport equations of the isothermal, single-phase model are presented in Appendix A, where for the sake of simple notations the averaging symbols were dropped. The reader may turn to [1] for a detailed presentation of the transport equations and their constitutive relations. The model considers that hydrogen and air enter the channels fully saturated. In the anode flow field, hydrogen is consumed in the HOR (A.17) and (C.27) and water is exchanged between the catalyst layer pores and ionomer by EOD (water leaves the pores) and by sorption/desorption at nonequilibrium equation (A.18), (C.28), and (C.30). In the cathode flow field, oxygen is consumed in the ORR (A.15) and (C.26) and water is produced in the ORR and is exchanged between the catalyst layer pores and ionomer by EOD (water enters the pores) and by sorption/desorption at nonequilibrium equations (A.16), (C.25), (C.28), and (C.29).
Figure 6 illustrates the current density distribution in the membrane for the case of an operating (average) current density of 0.46 A/cm2 and a cell voltage of 0.7 V. As hydrogen and oxygen are consumed, their concentrations decrease along the channels. Since the rates of HOR and ORR depend on their concentrations (C.33) and (C.34), the current density distribution follows the distributions of hydrogen and oxygen, being higher above the channel inlets and lower above the land in the vicinity of the outlets.

Current density distribution in the membrane for an operating current density of 0.46 A/cm2 and cell voltage of 0.7 V.
In Figure 7 are shown the current density profiles along two lines crossing the CCM situated in the regions marked 1 and 2 in Figure 6. Current density increases at anode (protons are produced in the HOR), is constant in the membrane, and decreases at cathode (protons are consumed in the ORR). The current density increases in region 1, and decreases in region 2 when the operating current increases. This is due to a decreasing oxygen and hydrogen concentrations in region 2 when the operating current increases. The slight increase in current density at the cathode-membrane interface indicates the increase in proton flux as the ionomer fraction reduces from 100% in membrane to 30% in catalyst layer.

Current density profiles along two lines crossing the CCM and situated in the regions marked 1 and 2 in Figure 6; operating conditions: (i) 0.46 A/cm2 and 0.7 V, (ii) 0.81 A/cm2 and 0.6 V, (iii) 1.1 A/cm2 and 0.5 V.
Figures 8 and 9 show the water content profiles across the CCM, along the lines marked 1 and 2 in Figure 6. In catalyst layers, the water in the ionomer-phase equilibrates with the water vapor at its local activity a and/or the liquid water present in the catalyst layer pores according to isopiestic curves such as the one for Nafion 117 equation (C.44) [21]. Supersaturated conditions are encountered at cathode and the ionomer-phase is surrounded by a liquid water film. At cathode, the water content in the ionomer-phase is therefore constant at any operating regime

Water content profiles across the CCM (along line 1) for three operating regimes.

Water content profiles across the CCM (along line 2) for three operating regimes.
Figures 10 and 11 depict the water flux profiles in the ionomer-phase across the CCM along lines 1 and 2. The electro-osmotic drag flux
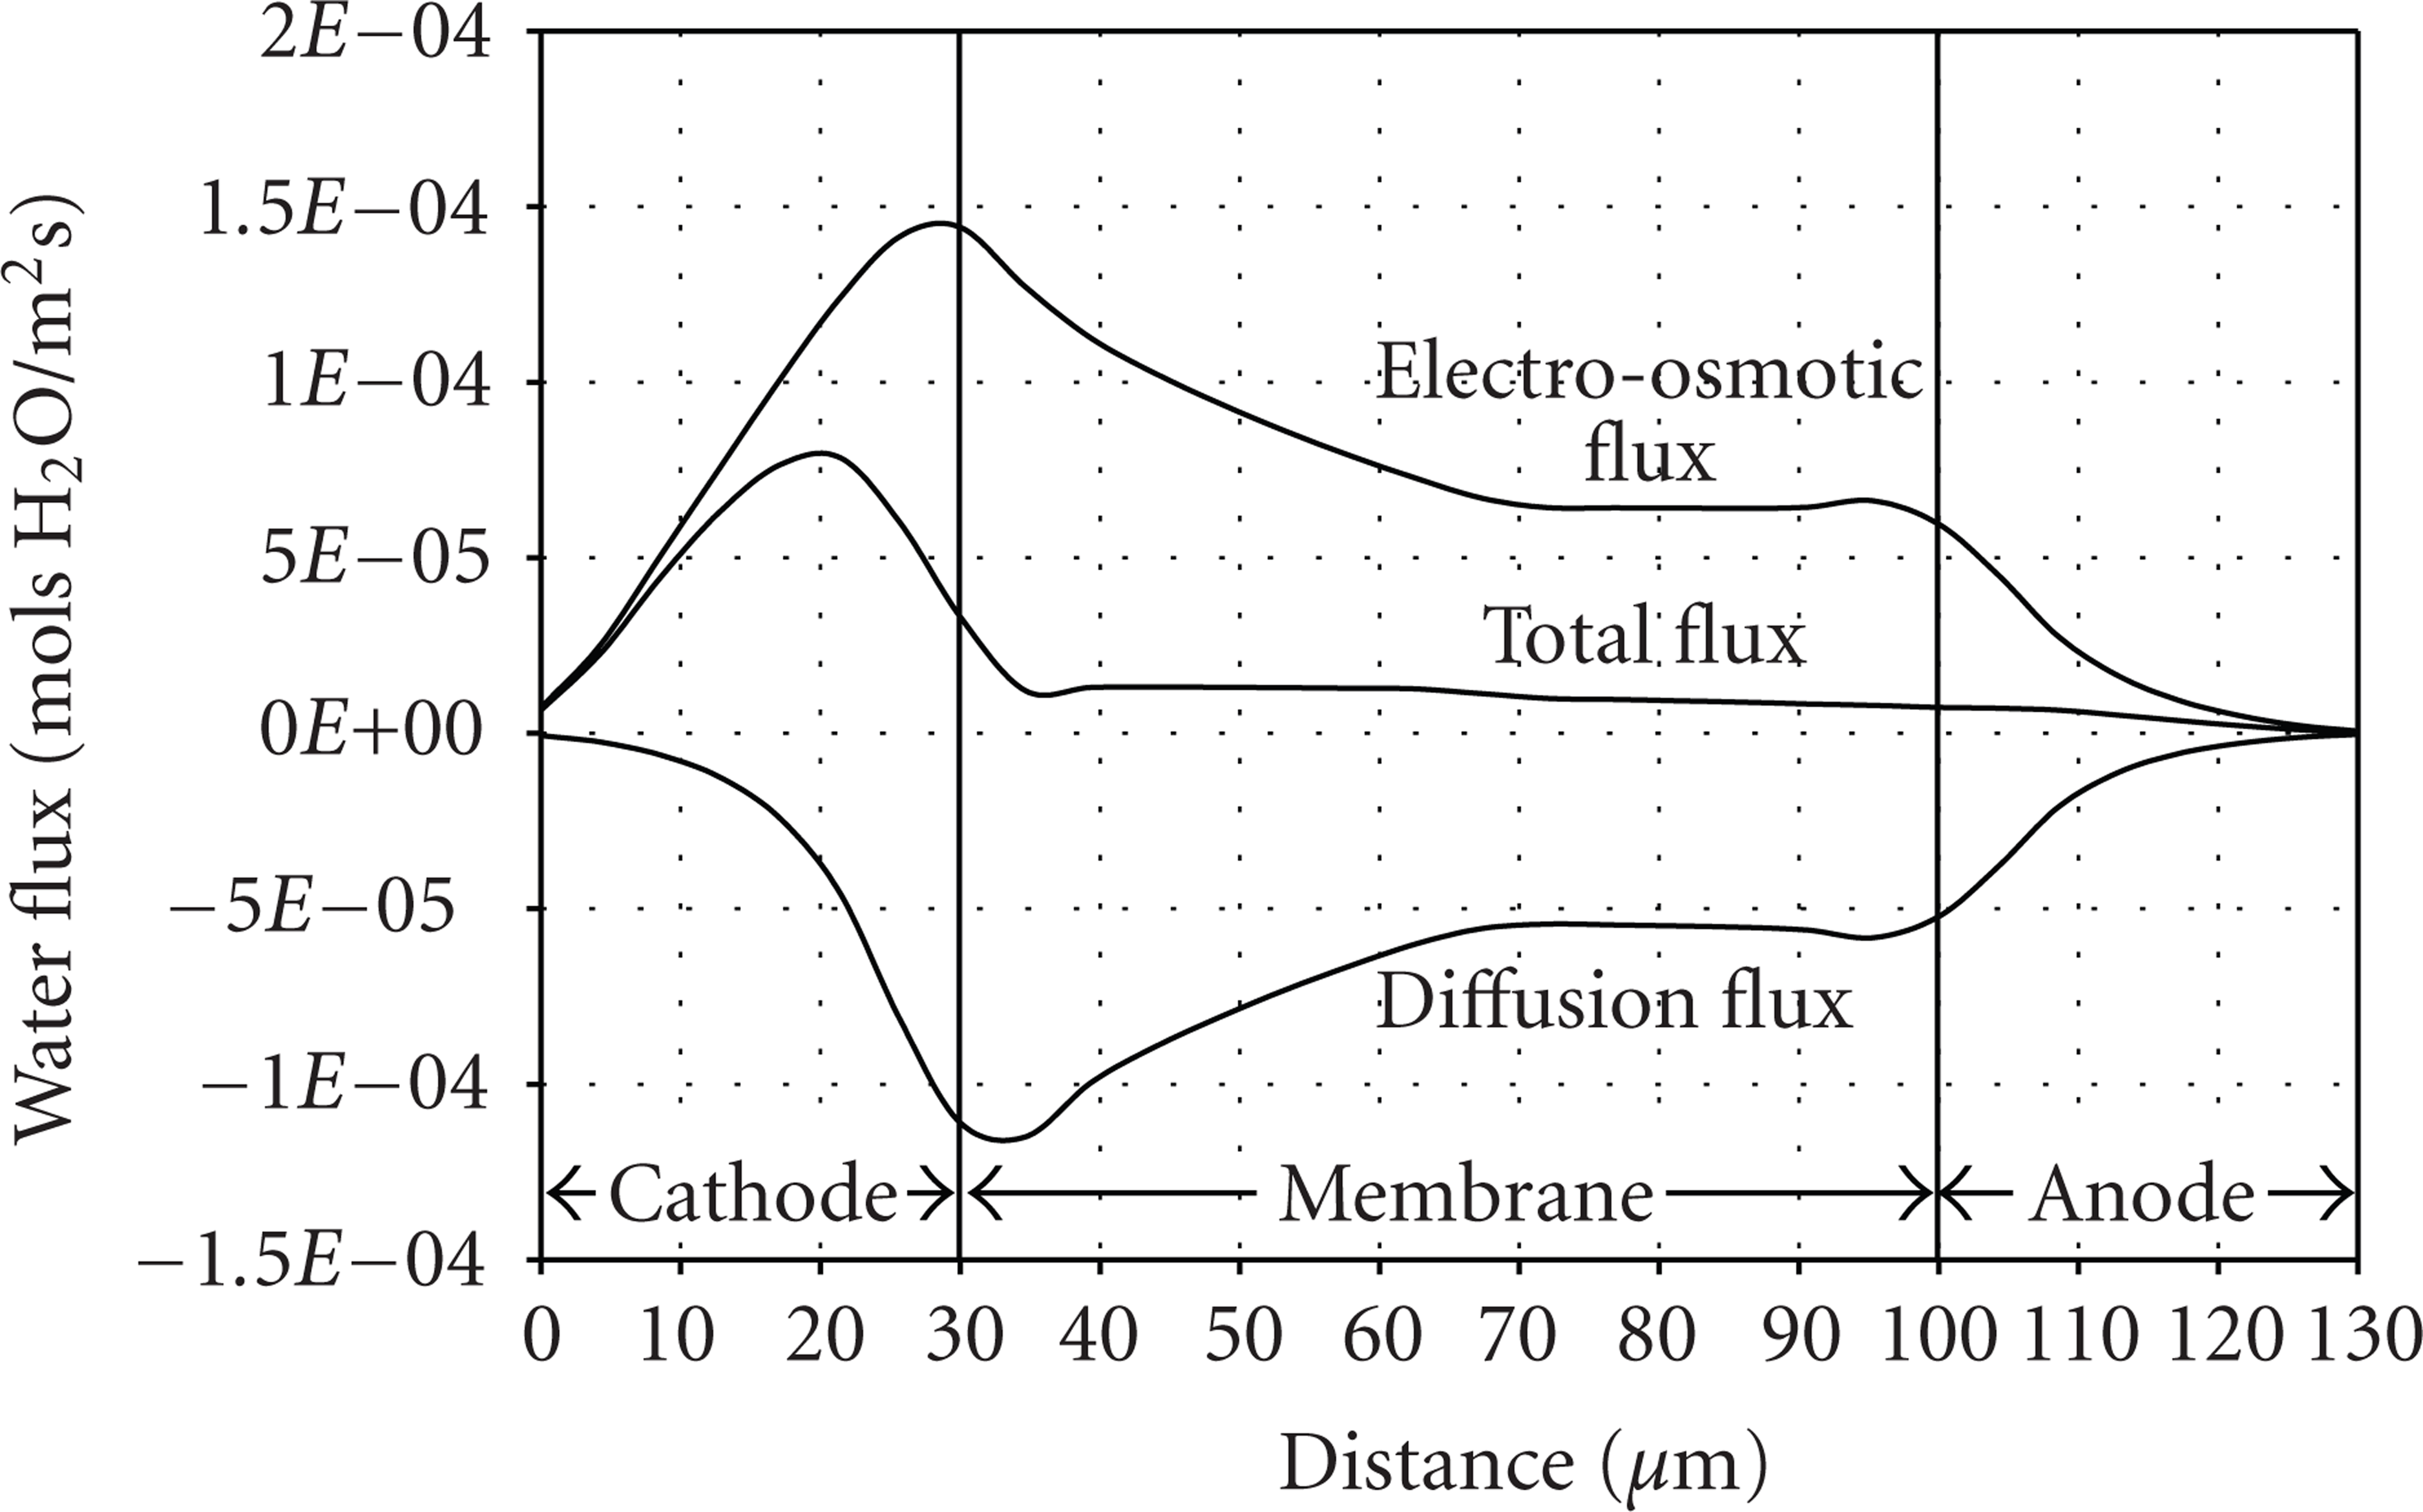
Water flux profiles across the CCM (along line 1) for an operating current of 0.64 A/cm2.

Water flux profiles across the CCM (along line 2) for an operating current of 0.64 A/cm2.
Figure 12 illustrates the water vapor distribution in the anode catalyst layer at the interface with membrane. Water mass fraction decreases downstream as water is transported from anode to cathode, but increases towards the channel outlets (region 2), where water is transported across the CCM in the opposite direction.
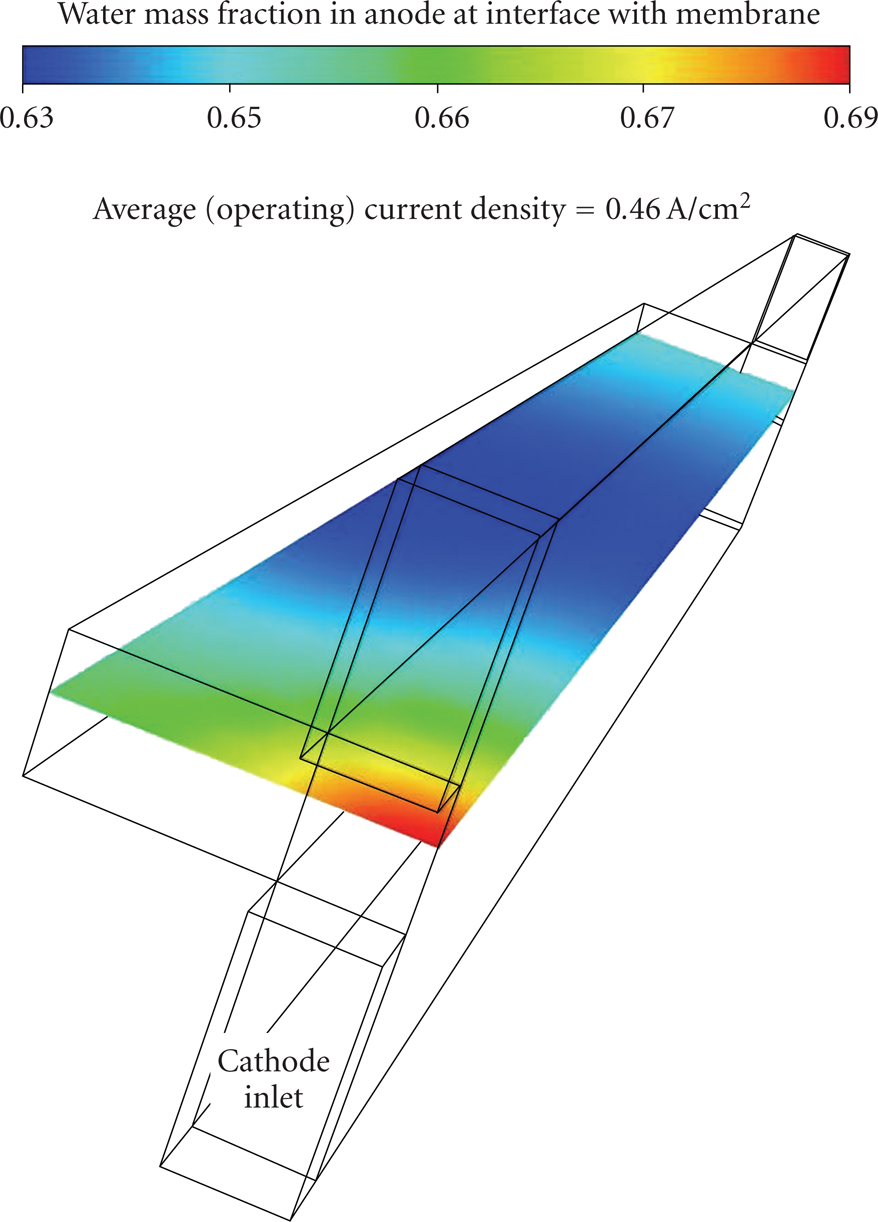
Water vapor distribution in the anode catalyst layer at the interface with membrane an operating current of 0.64 A/cm2.
5. Conclusions
We derive a continuum model for water transport in the ionomer-phase of CCMs for PEMFCs using the method of volume averaging. Water accumulates in the ionomer-phase of CCMs as a result of
“stripping off” the water molecules in the peripheral solvation shells of the protonated complexes when the hydrodynamic motion of the latter occurs along a gradient of water content (along a gradient of hydrophilic domain sizes), and expressed by
the difference between the incoming and outgoing water diffusive fluxes, expressed by
exchanges by sorption and desorption between the ionomer-phase distributed in catalyst layers and the catalyst layer pores,
A second mechanism of water transfer between the ionomer-phase and the TPB regions distributed in the catalyst layers, referred to as electro-osmotic discharge and expressed by
To our best knowledge, the previous models for water transport in CCMs have been exclusively derived for use in CFD analysis intuitively, or by performing a balance of water fluxes across a control volume consisting of 100% ionomer-phase. These equations are therefore valid solely in PEMs and cannot capture correctly the mechanisms of water transfer between the ionomer-phase and the catalyst pores or the mechanisms that affect water accumulation in the ionomer-phase.
Footnotes
Appendix Group
Nomenclature
Greek Symbols
Subscripts
Superscripts
Acknowledgment
This material was prepared with the financial support of the U.S. Department of Energy under Award no. DE-PS36-07G097012.