
Abstract
The purpose of this paper is to determine the optimal cutting conditions for surface roughness in a turning process. This process is performed in the final assembly department at a manufacturing company that supplies fluid dynamic bearing (FDB) spindle motors for hard disk drives (HDDs). The workpieces used were the sleeves of FDB motors made of ferritic stainless steel, grade AISI 12L14. The optimized settings of key machining factors, depth of cut, spindle speed, and feed rate on the surface roughness of the sleeve were determined using the response surface methodology (RSM). The results indicate that the surface roughness is minimized when the depth of cut is set to the lowest level, while the spindle speed and feed rate are set to the highest levels. Even though the results from this paper are process specific, the methodology deployed can be readily applied to different turning processes.
1. Introduction
Hard disk drives (HDDs) are magnetic discs used to store data in most computer systems, and they are rotated by the spindle motors to read-write data. The standard technology for spindle motor is fluid dynamic bearing (FDB) [1]. The crucial part of the FDB is the spindle motor sleeve which contains fluid to reduce the stress between the rotating shaft and sleeve. The turning process is utilized to manufacture the FDB sleeve, and the surface roughness of sleeve is known to affect the quality of the sleeve. Since the surface quality depends on many factors including feed rate, depth of cut, and spindle speed, the surface roughness will be minimized if the relationship between turning process parameters and the surface quality is fully recognized [2].
2. Literature Review
Among the most basic operations performed by machine tools are drilling, milling, grinding, and turning or lathing. The turning process is a machining method that removes material from the surface using a rotating cutting tool that moves to a workpiece. The surface quality, which is measured in terms of surface roughness, is utilized to evaluate the performance of the turning operation. The surface roughness is known to be significantly affected by different cutting parameters, that is, the depth of cut, spindle speed, and feed rate [3]. Therefore, the surface roughness will be optimized if the appropriate cutting conditions are selected. Statistical prediction methods, such as the response surface methodology (RSM), are frequently utilized to model the surface roughness, so that the desired levels of machining parameters are achieved. There are numerous works reporting the success of implementing RSM to predict surface roughness. Among these works, Sahin and Motorcu [4] utilized RSM to construct a surface roughness model for the turning process of AISI 1040 mild steel coated with TiN. Three machining parameters, depth of cut, cutting speed and feed rate, were included in the predicted model, and the selected design of RSM for this study was the central composite design (CCD). Noordin et al. [5] conducted an experiment on the turning process of AISI 1045 steel. The effects of cutting speed, feed rate and side cutting angle on the multipleresponses (tangential force and surface roughness) were investigated using the CCD, and the second order regression model was built to predict these two responses. Singh and Rao [6] conducted an experiment to determine the effects of cutting conditions and tool geometry on the surface roughness in the finish hard turning of the bearing steel (AISI 52100). Mixed ceramic inserts made up of aluminium oxide and titanium carbonitride (SNGA), having different nose radius and different effective rake angles, were used as the cutting tools. Mathematical models for the surface roughness were developed by using the response surface methodology. The response surface methodology was also integrated with different techniques, such as the genetic algorithm (GA) by Oktem et al. [7], to optimize the cutting conditions for the purpose of minimizing the surface roughness. The study focused on the milling process of aluminum 7075-T6 used in mold manufacturing.
Other experimental design approaches commonly utilized for modeling responses are the Taguchi technique and factorial design. Davim [8] studied the influence of velocity, feed rate, and depth of cut on the surface roughness using Taguchi design. The material used in this turning process was free machining steel, 9SMnPb28k (DIN). The model for predicting the surface roughness was developed in order to optimize the cutting conditions. Arbizu and Luis Perez [9] used a 23 factorial design to construct a first-order model to predict the surface roughness in a turning process of workpieces following ISO 4287 norm based on spindle speed, feed rate, and cutting depth.
According to the literature, the RSM has proven to be practical and effective for use, so it was utilized in this study to quantify the effect of the machining factors on the surface roughness of the FDB sleeve. The next section provides detailed information regarding the methodology used and the background of turning process.
3. Methodology
The response surface methodology (RSM) is a combination of statistical and mathematical techniques to analyze, model, and optimize processes. The purpose of this method is to establish the unknown relationship between the independent variables (input factors) and the process responses. Surface experiments are performed to fit either a first order model (linear function) or a second-order model to the observations [10]. The efficiency of the response surface analysis is significantly influenced by selecting the proper choice of experimental designs. Box-Behnken and central composite design (CCD) are the most popular class of designs to fit response surfaces. The CCD deploys a

where

Central composite design (CCD) for three factors.

Box-Behnken design for three factors.
4. Process Background
In the experiment, the test pieces were the sleeves of fluid dynamic bearing (FDB) spindle motors, and each piece was 65 mm in diameter and 58 mm in length (Figure 3). They were made of free-cutting stainless steel, grade AISI 12L14, and their chemical composition was 20% Cr and 2% Mo. Turning processes were performed on a two-axis CNC lathe, which had a maximum spindle speed of 15000 rpm. This machine was equipped with five inserts and operated under wet cutting conditions. The focused cutting area was the end cut operation of the FDB sleeves performed by insert A due to the cost concern of the manufacturer. The tool material for the inserts was uncoated carbide, KYOCERA PW30, and the surface roughness is evaluated using an ACCRETECH-TOKYO SEIMITSU model SURFCOM 1400D with accuracy of 50 nm.
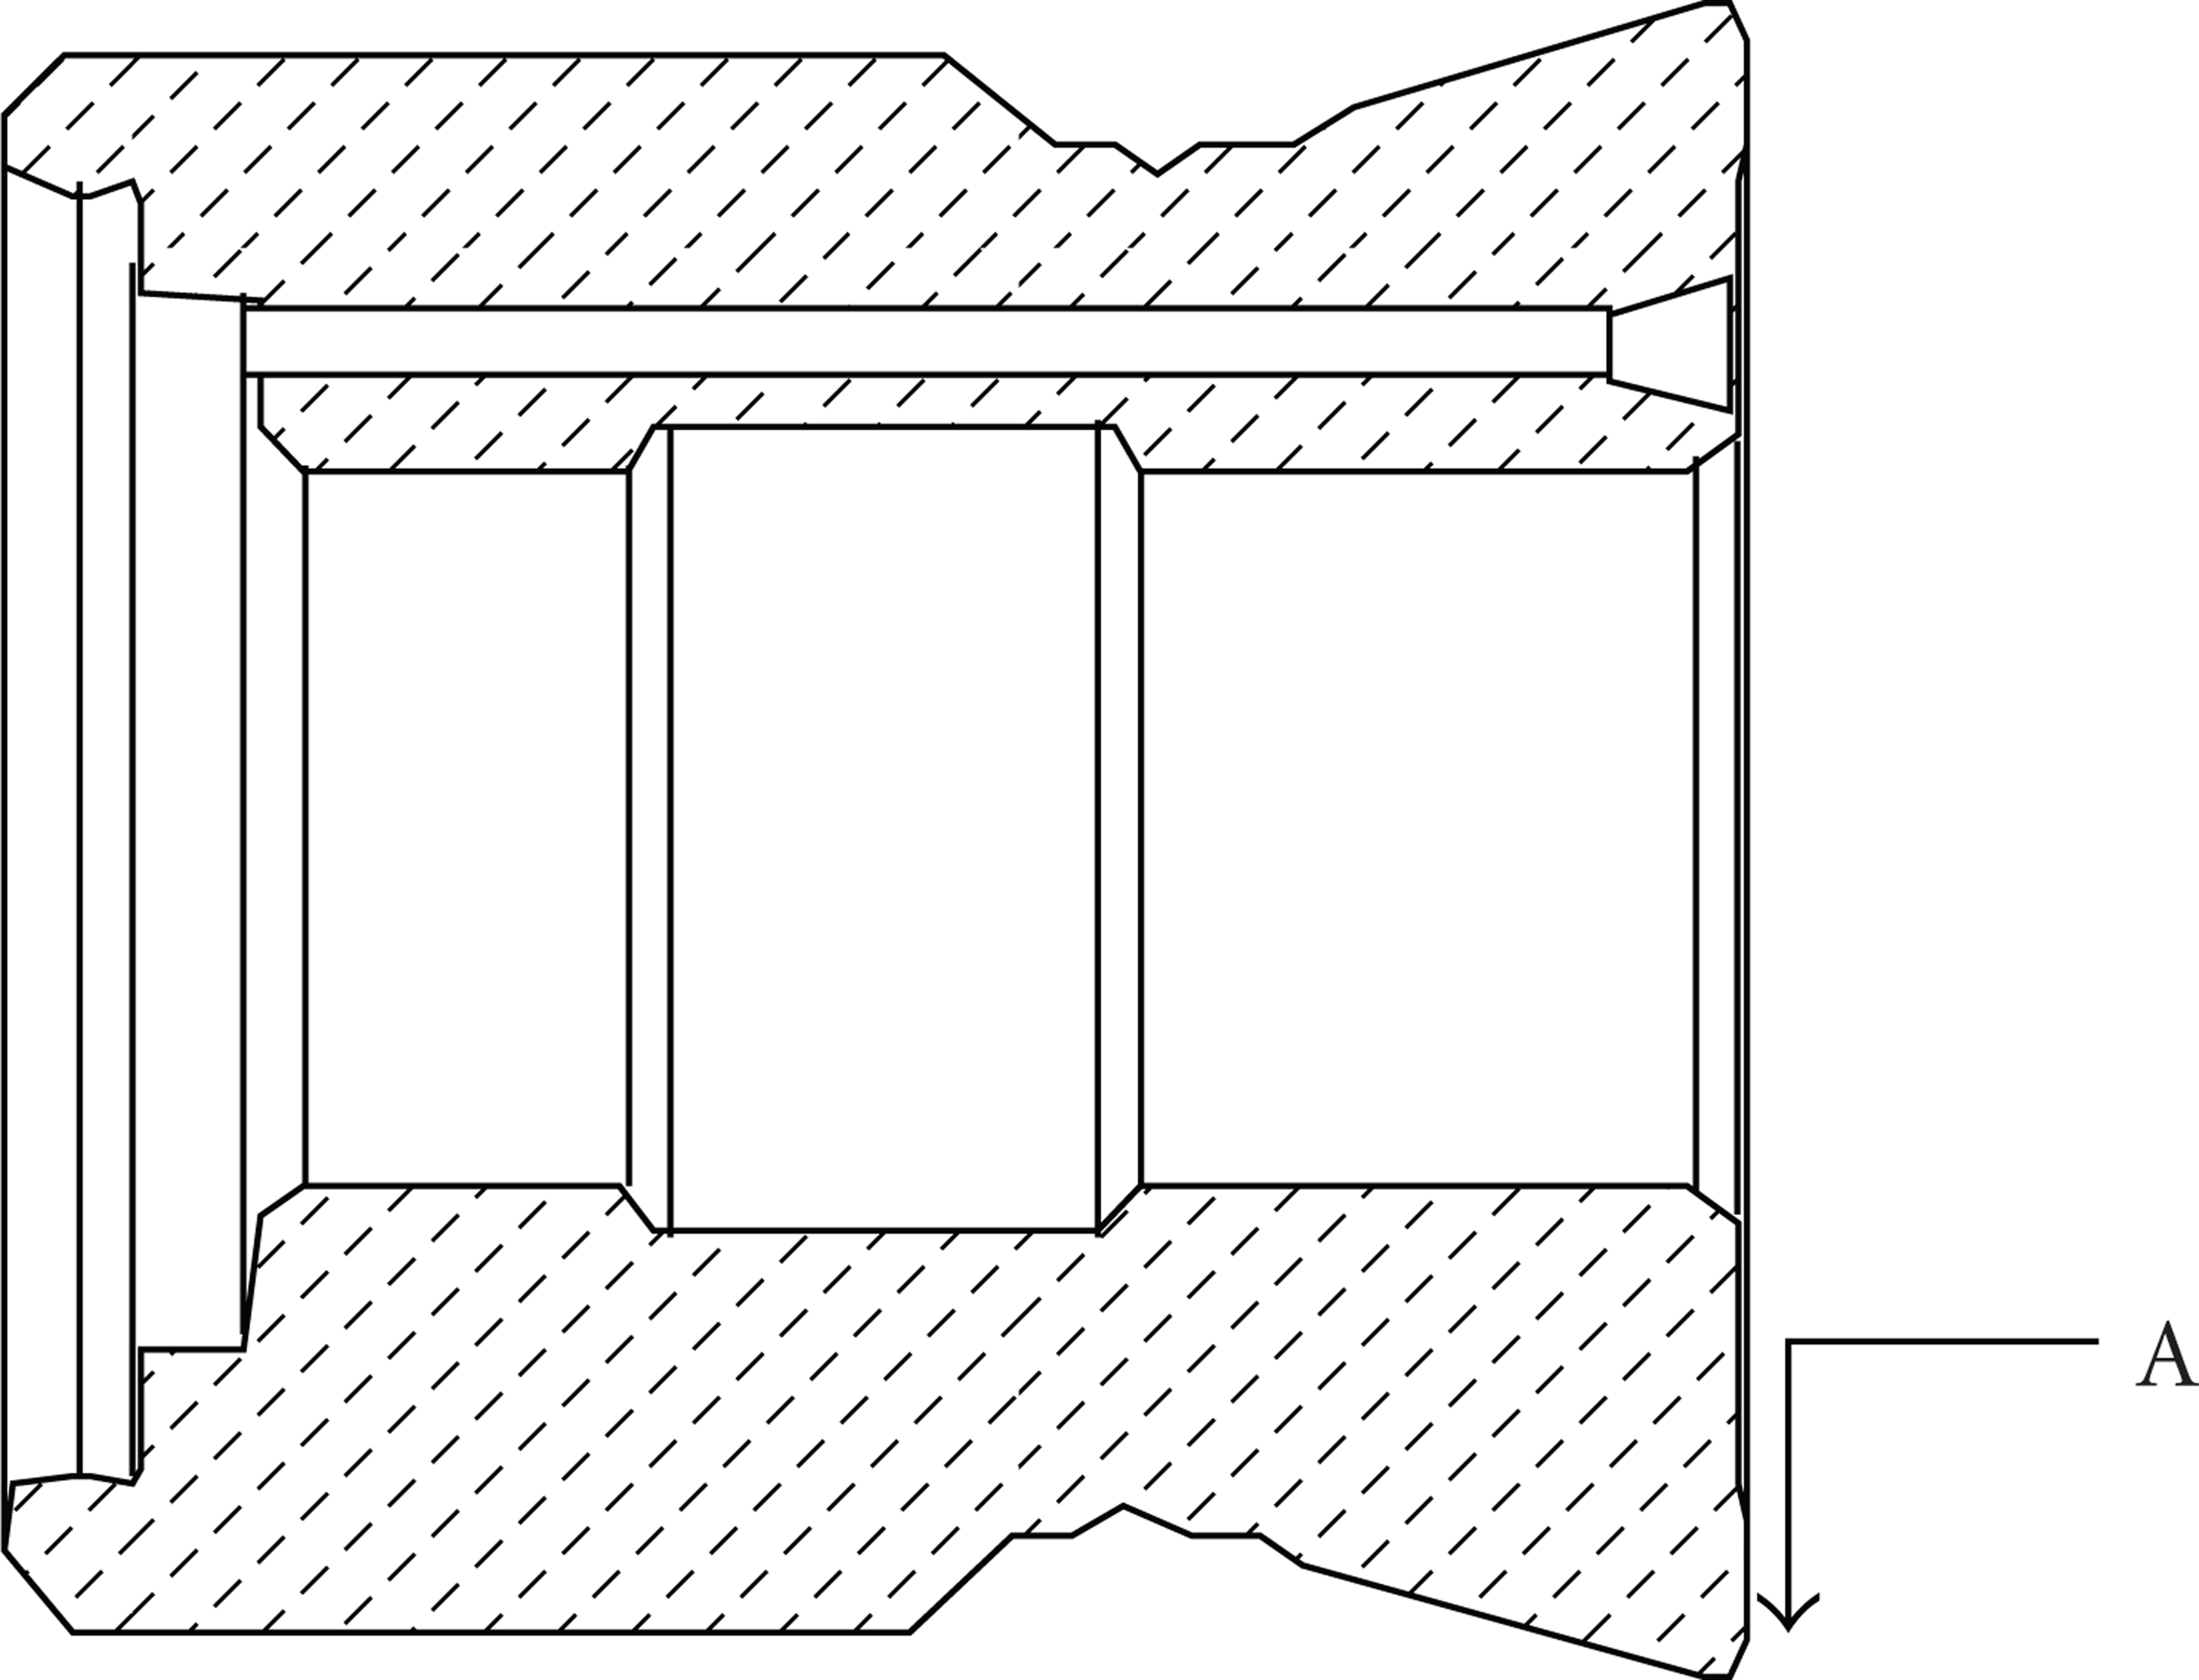
FDB sleeve and the focused toolpath.
5. Experimental Design
In accordance with the literature, the factors selected for this experiment were depth of cut, spindle speed, and feed rate, while the response is surface roughness expressed in terms of the average surface roughness (R a ). According to (2), R a is the average deviation of the profile from the centerline along the sampling length (L):

where x is the profile direction and Y is the ordinate of the profile curve [2]. Each factor was set to the low (−1), medium (0) and high (1) levels shown in Table 1.
Input factors and their levels.

In this case, since the Box-Behnken design requires 12 design points plus 5 center runs, the corresponding design matrix and the responses are shown in Table 2.
Design matrix for surface roughness (R a ).

6. Experimental Analysis
The response surface method was performed using a design of experiment package, Design Expert Version 7.1.6, to analyze the effects of the selected factors on the surface roughness.
As shown in Table 3, the analysis of variance (ANOVA) was determined to summarize the significant tests of each other. Results from the ANOVA table showed that all three factors, depth of cut (A), spindle speed (B), and feed rate (C), were statistically significant, since their P-values were very small (<.05). According to the P-values, the feed rate (C) contributed the highest effect on the surface roughness, followed by spindle speed (B) and depth of cut (A), in that order. The ANOVA also pointed out that the quadratic effect was useful to incorporate into the model since the second-order term A2 was highly significant, with a P-value at only 0022. Moreover, because the lack of fit test was insignificant (>.05), the model was adequate. The predicted equation (3) for surface roughness in terms of these factors was

After the regression model was constructed, model adequacy checking was performed in order to examine the fitted model and verify that the regression assumptions were not violated.
ANOVA for surface roughness.

Two types of model diagnostics, the normal probability plot and residual plot, were used for verification in this part of the analysis. According to Figures 4 and 5, the normal probability plot and the residuals versus the fitted values signified that there was no violation of the normality assumption. Since the normal probability plot followed a straight line pattern, the residual was normally distributed. As long as the residual versus the fitted values show no unusual pattern and no outliers, the independence and constant variance assumptions still hold in this case.
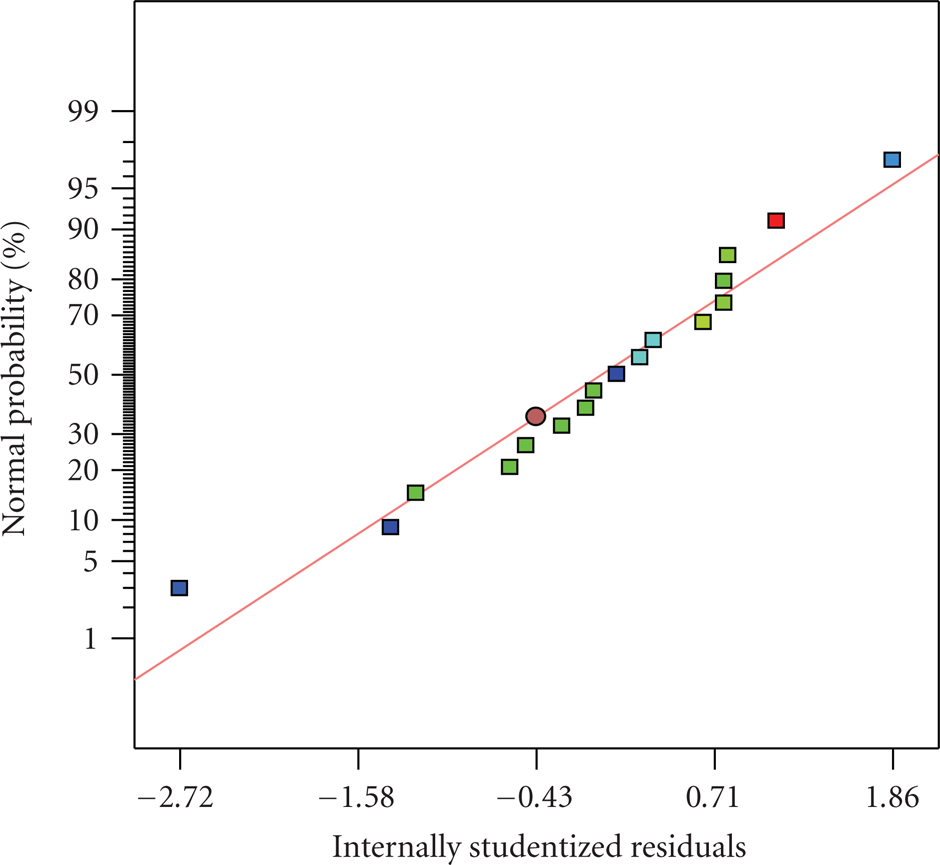
Normal probability plot of the residuals.

Residual versus predicted plot.
As shown in Figure 6, when the effect of spindle speed and feed rate were averaged (spindle speed = 6500 rpm, feed rate = 0.005 mm/rev), the average R a at the low level depth of cut (0.01 mm) was significantly lower than that at the high level (0.02 mm). It was interesting to note that the relationship between depth of cut and surface roughness in this process was nonlinear, since there was a curvature appearing in the graph. However, the main effect plots for spindle speed and feed rate had a negative effect; that is, increasing these two factors lessened the surface roughness (Figures 7 and 8). The main effect plot of feed rate (Figure 8) indicated that the surface quality was sensitive to feed rate, since the surface roughness was significantly lower when the feed rate was set to the high level (0.008 mm/rev). It was interesting to notice that increasing the feed rate (from 0.002 to 0.008 mm/rev) could lead to better surface roughness. This was the unexpected result since the feed rates had negative effect on surface roughness. Therefore, more experiments at different conditions were conducted to remove controversy. The result (Figure 9) illustrated that the surface roughness was gradually increasing by increasing feed rate from 0.008 to 0.026 mm/rev. This confirmed that the obtained results were only valid for the ranges where each factor was tested.

R a versus depth of cut.

R a versus spindle speed.
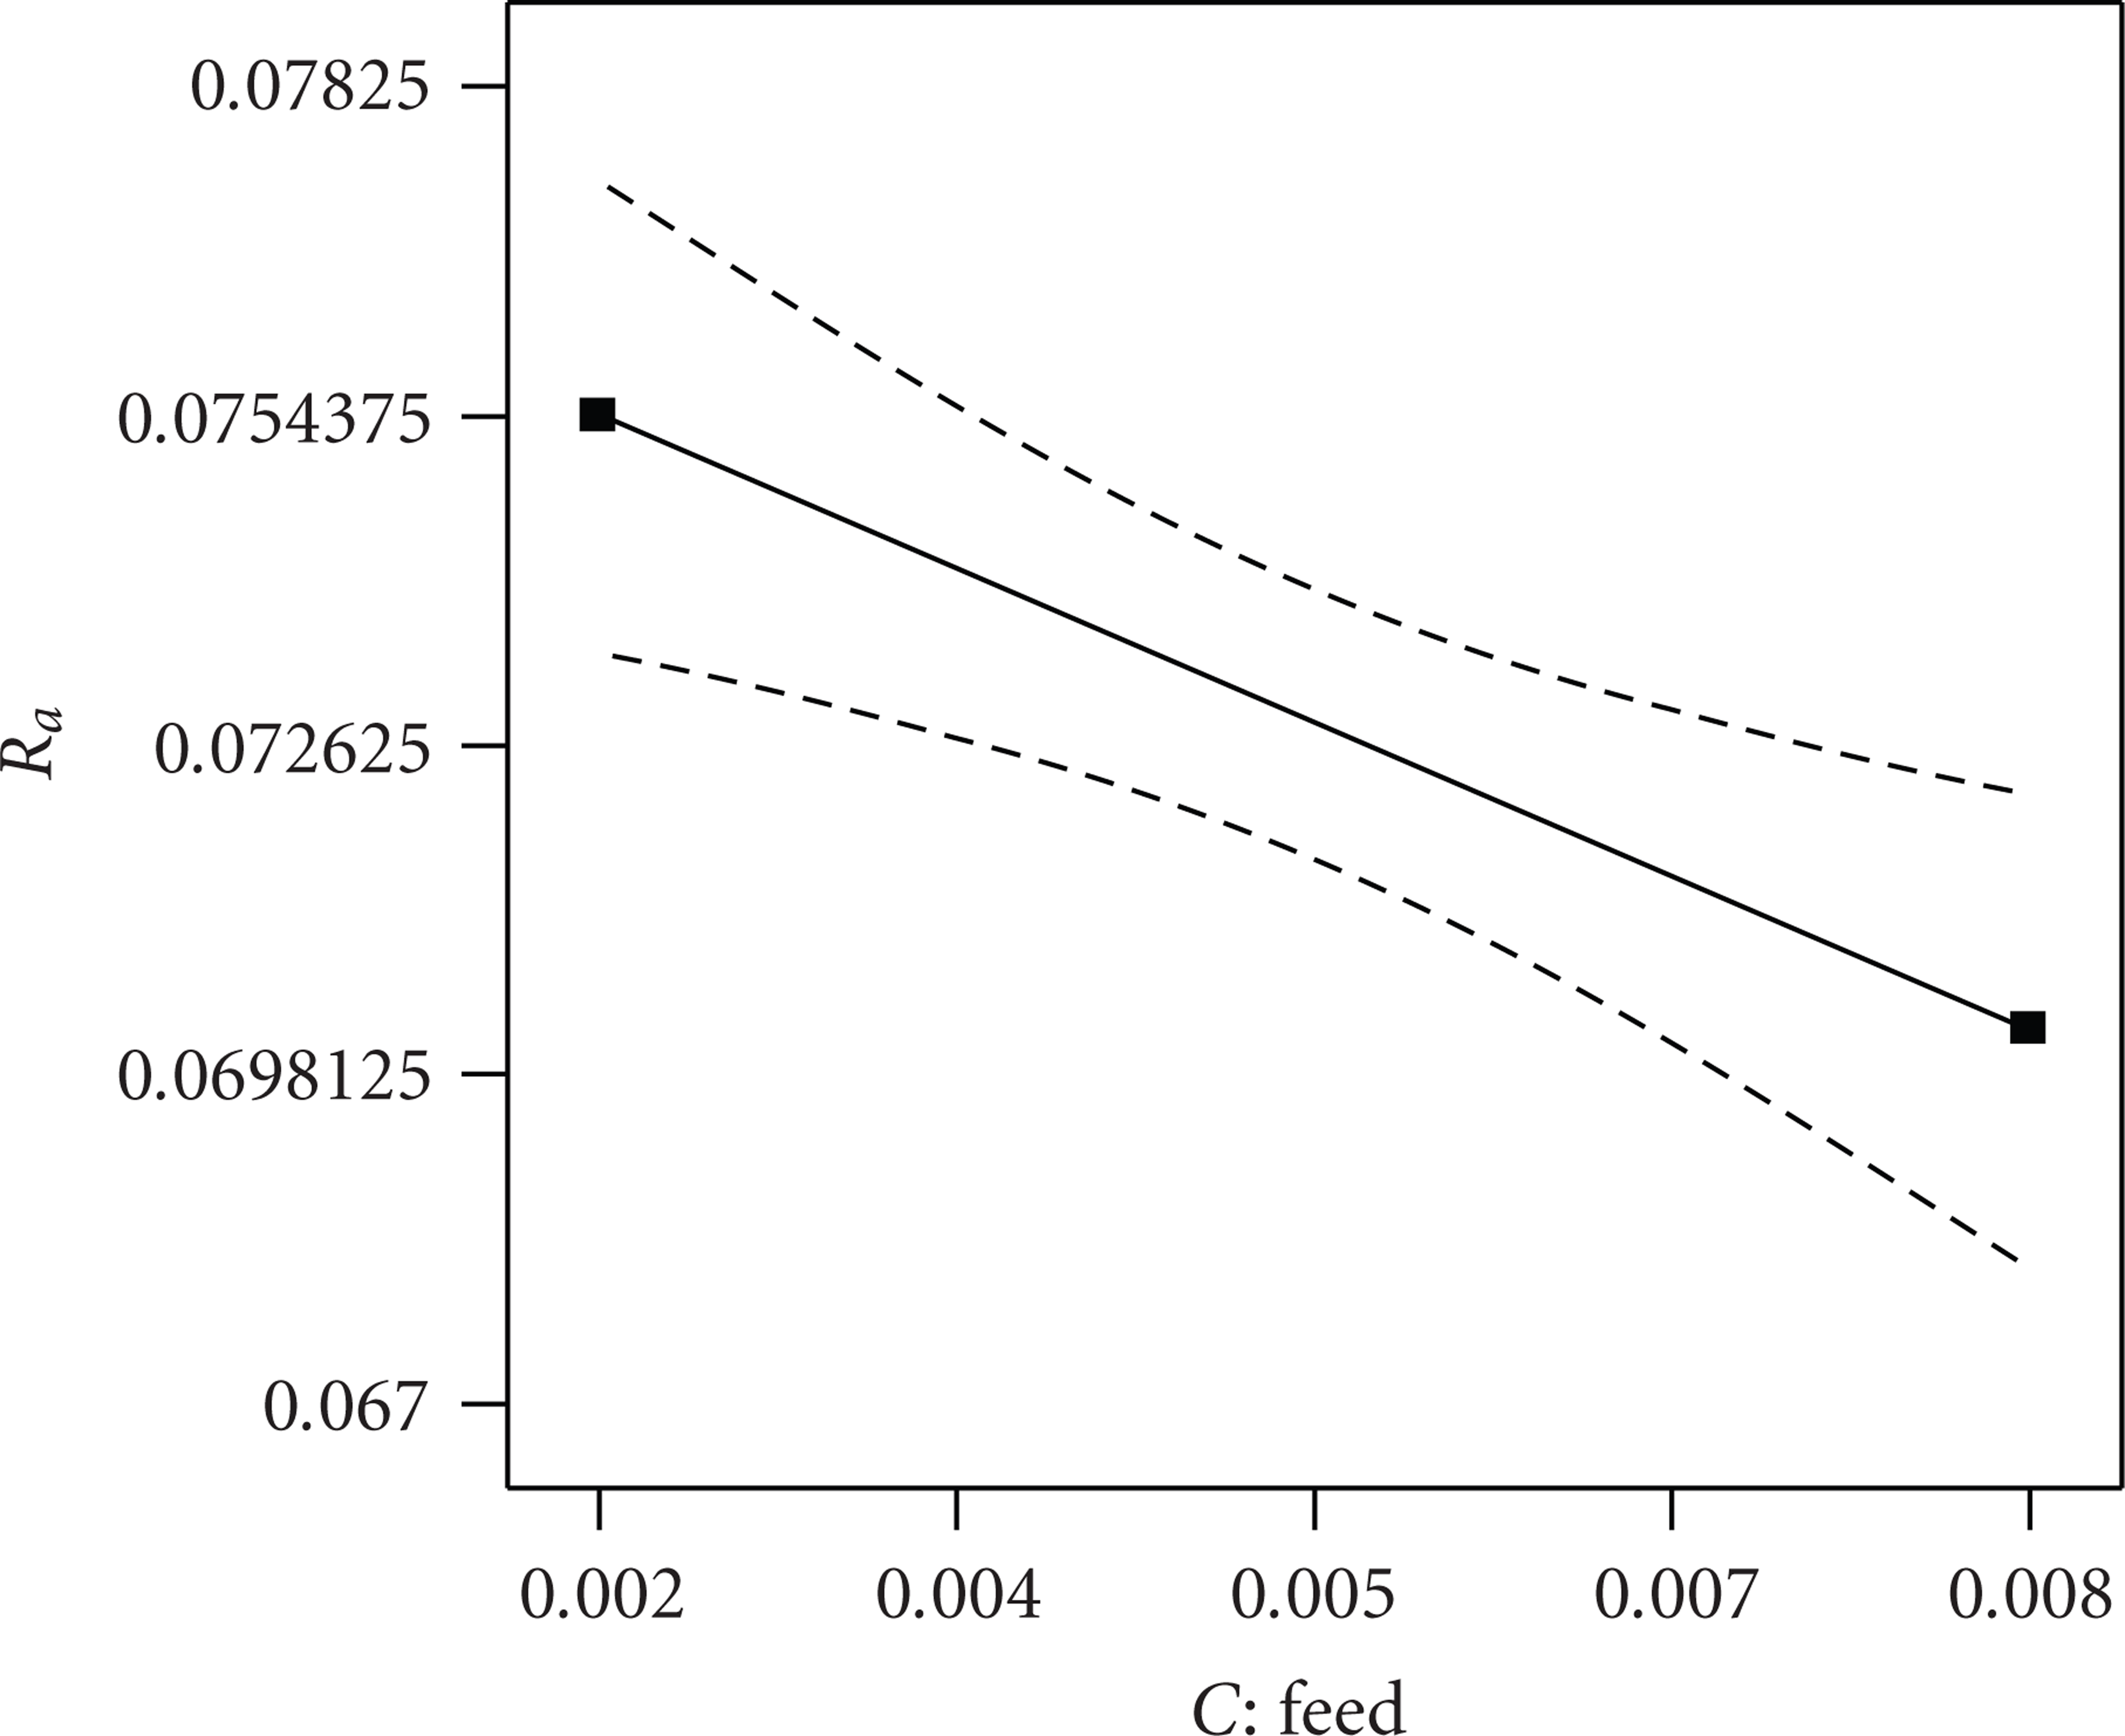
R a versus feed rate (0.002–0.008 mm/rev).
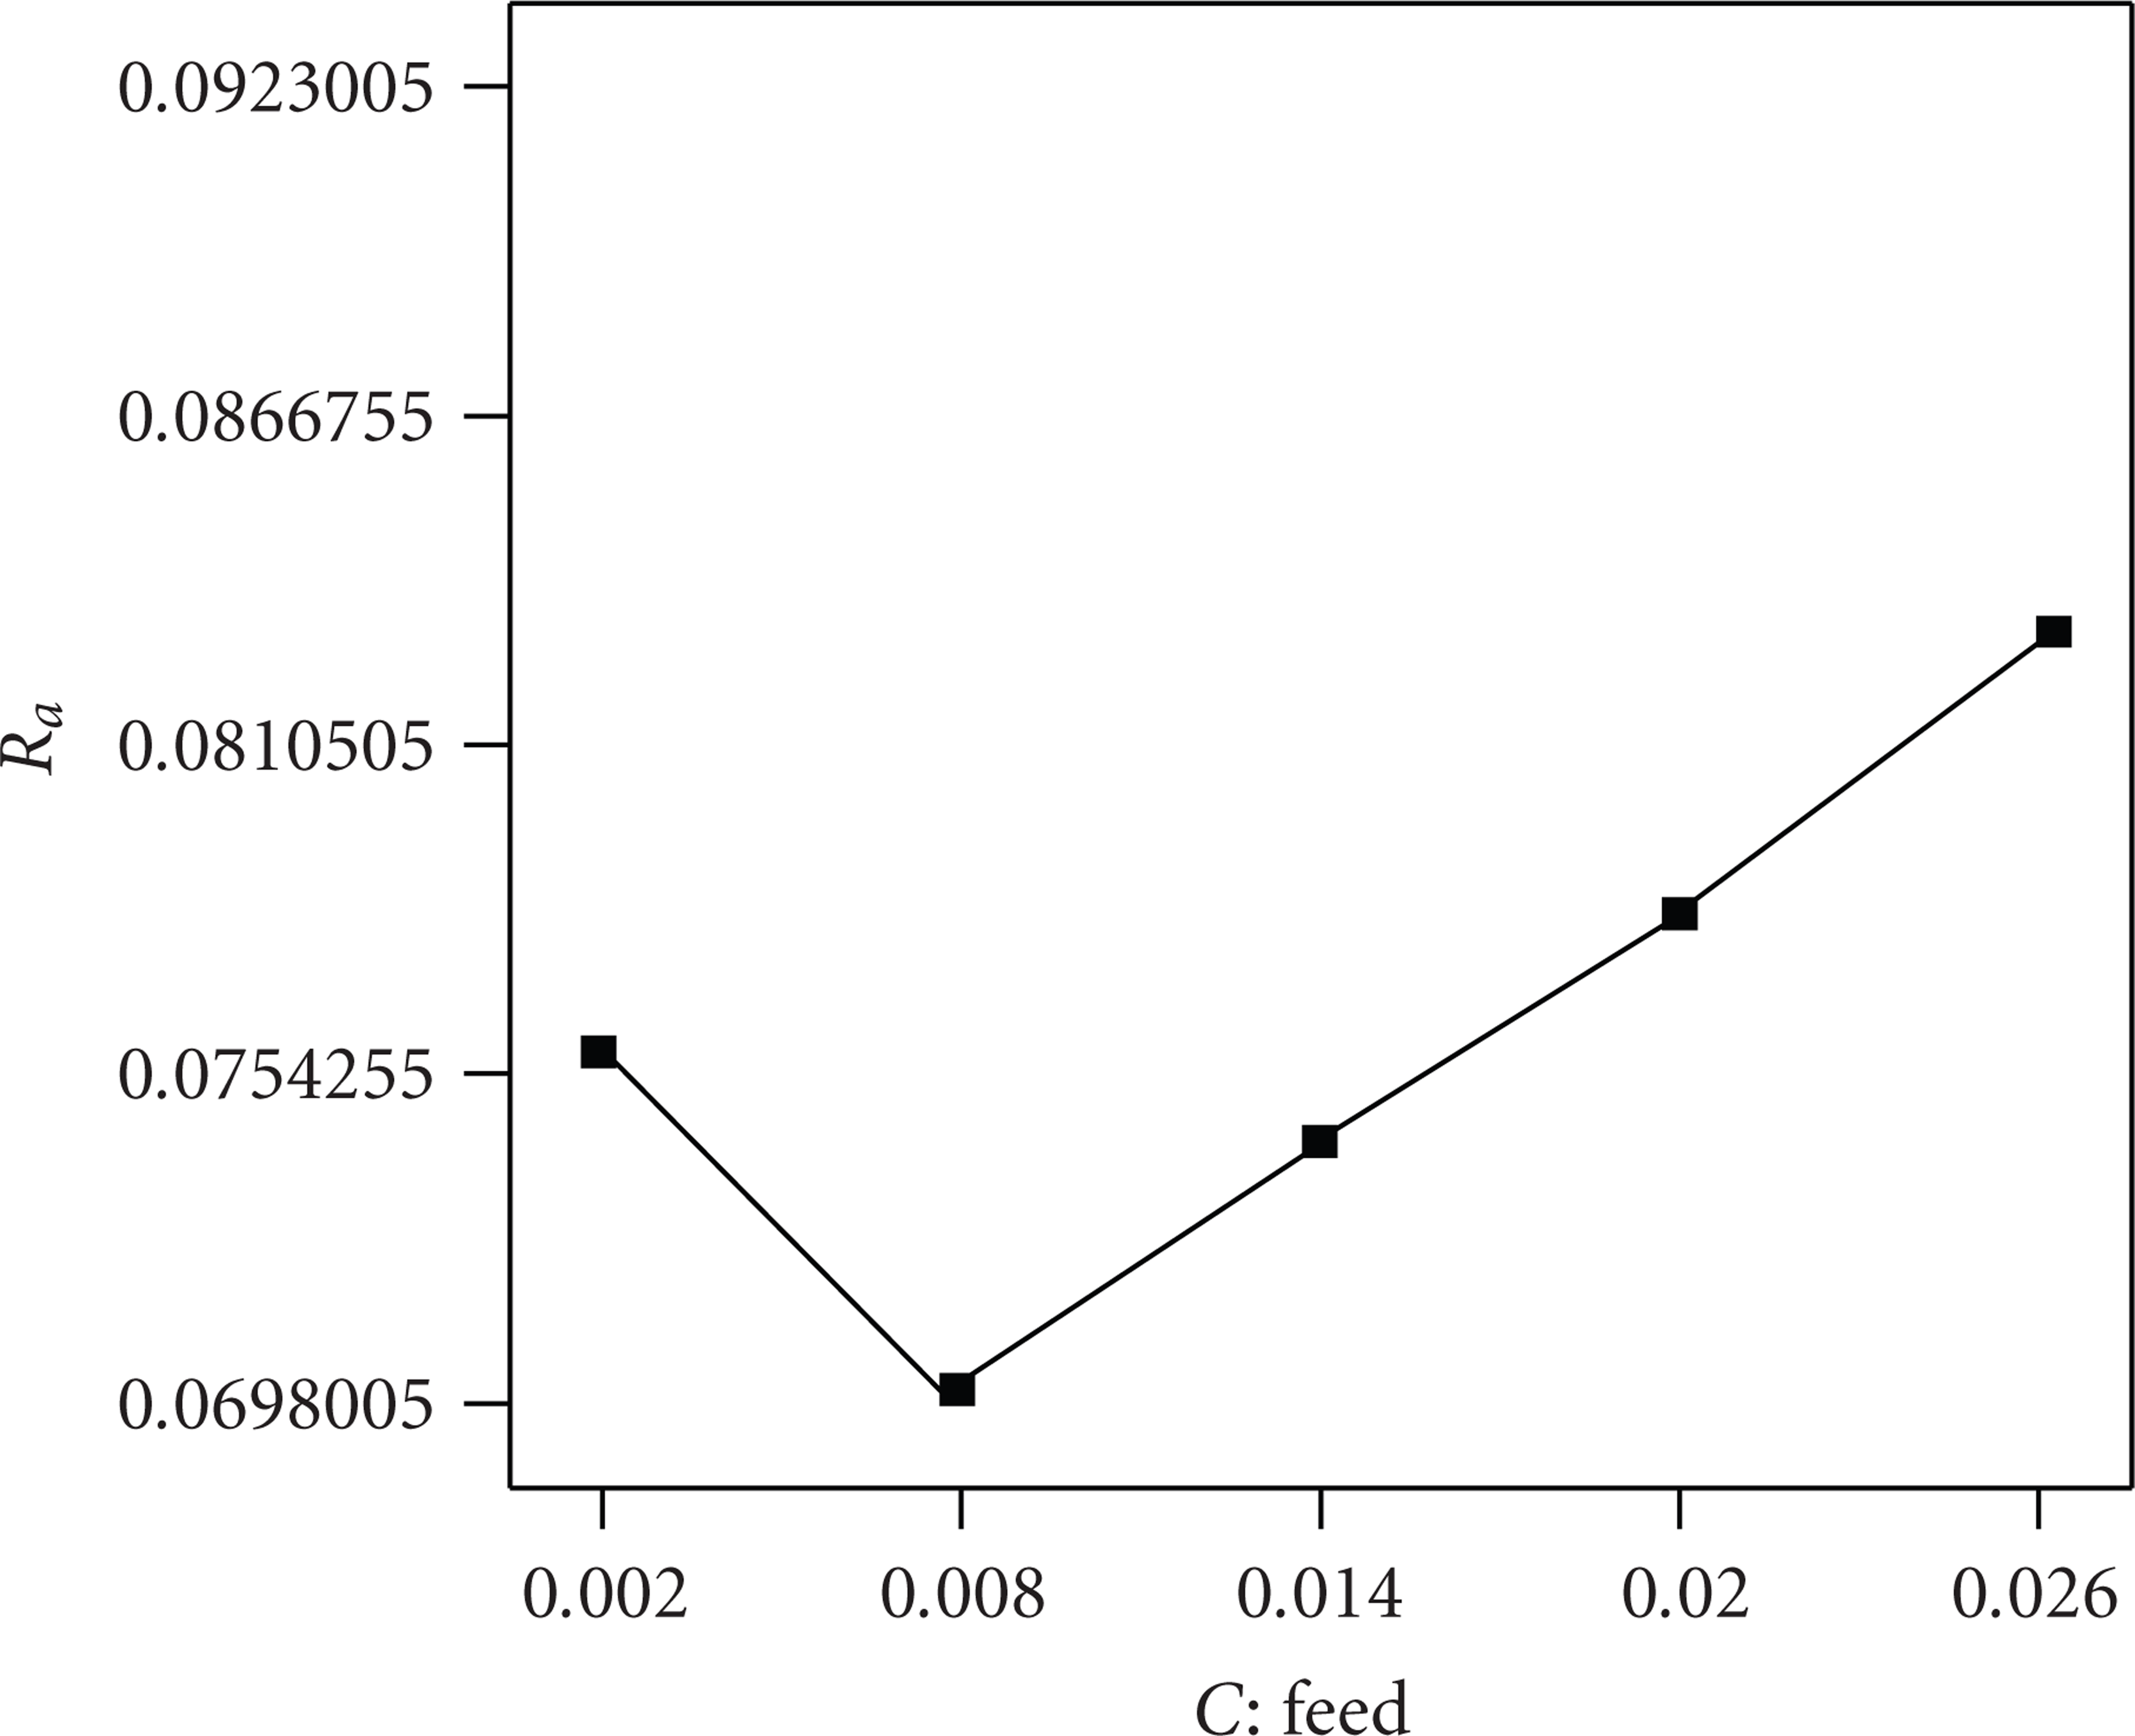
R a versus feed rate (0.002–0.026 mm/rev).
In conclusion, the main effect plots of the three factors showed that the spindle speed and feed rate should be set to the high levels (8000 rpm and 0.008 mm/rev, resp.). However, the depth of cut should be set at the low level (0.01 mm) in order to keep the surface roughness at the lowest value. This conclusion was confirmed by the cube plot in Figure 10, where the lowest surface roughness was achieved (average R a = 0.06484 μm) when the cutting conditions were set to the above conditions.

Cube plot for surface roughness.
7. Confirmation Tests
Forty sleeves of FDB motors were sampled and tested under the recommended cutting conditions (depth of cut = 0.01 mm, spindle speed = 8000 rpm, and feed rate = 0.008 mm/rev) in order to validate the predicted equation for the surface roughness. Table 4 shows that the observed average (R a = 0.06444 μm) is within the 95 percent confidence interval of the predicted value (0.0643 μm, 0.0653 μm). Therefore, there is no significant difference between the predicted average and the observed average.
Results of the validation experiment.

8. Industrial Implementation
The most important contribution of this research is the determination of the best conditions for manufacturing the sleeves of FDB motors, which lead to significant reduction in the surface roughness. Before solving the optimization problem, the cutting conditions were set by the manufacturer, as shown in Table 5. However, after the response surface method was implemented, the optimum cutting conditions were introduced, and the average surface roughness was reduced from 0.07416 μm to 0.06444 μm, or about 13% compared to the initial cutting condition.
Results of the implementation.

9. Conclusions
The aim of this research was to optimize the turning process of the FDB sleeve in HDDs. The effects of the depth of cut, spindle speed, and feed rate on surface roughness were quantified using the Box-Behnken design, which is one of the most commonly used RSM techniques. The ANOVA results demonstrate that the feed rate is the most significant factor that affects the response variable. The graphical method was also employed to indicate the range of the controllable factors at which the minimization of surface roughness is achieved. Moreover, the second-order response surface model for the surface roughness was derived, and it indicates that the depth of cut provides the quadratic effect. With model validation, the quadratic model developed proved to be accurate and has the capability to predict the value of the response within the limits of the factors investigated. After the model was implemented to improve the cutting conditions, the surface roughness was significantly reduced by about 13%.