
Abstract
Numerical investigation of the combustion of syngas fuel mixture in gas turbine can combustor is presented in this paper. The objective is to understand the impact of the variability in the alternative fuel composition and heating value on combustion performance and emissions. The gas turbine can combustor is designed to burn the fuel efficiently, reduce the emissions, and lower the wall temperature. Syngas mixtures with different fuel compositions are produced through different coal and biomass gasification process technologies. The composition of the fuel burned in can combustor was changed from natural gas (methane) to syngas fuel with hydrogen to carbon monoxide (H2/CO) volume ratio ranging from 0.63 to 2.36. The mathematical models used for syngas fuel combustion consist of the k-ε model for turbulent flow, mixture fractions/PDF model for nonpremixed gas combustion, and P-1 radiation model. The effect of syngas fuel composition and lower heating value on the flame shape, gas temperature, mass of carbon dioxide (CO2) and nitrogen oxides (NO x ) per unit of energy generation is presented in this paper. The results obtained in this study show the change in gas turbine can combustor performance with the same power generation when natural gas or methane fuel is replaced by syngas fuels.
1. Introduction
Over the past decades domestic and imported oil was used for transportation, and domestic coal and natural gas have been used as the primary fuels for power generation systems. Today the emission regulations for power plant have become more stringent. The concern today with the combustion of fossil fuels is the new emission regulations for power plant with regards to carbon dioxides (CO2) and nitrogen oxides (
Gas turbines are designed primarily to be fueled with natural gas (consisting primarily of methane), and supplying them with syngas (fuel gas from biomass, coal, and waste gasification) presents certain challenges that must be addressed. How can we burn efficiently syngas fuel with different chemical compositions and heating values in gas turbine combustors designed for natural gas? In order to meet these challenges, we need to understand the physical and chemical processes of syngas combustion. Information regarding syngas flame shape, flame speed, gas temperatures and pollutant emissions such as
The challenges of fuel diversity while maintaining superior environmental performance of gas turbine engines were addressed by Rahm et al. [6]. They reviewed the combustion design flexibility that allows the use of a broad spectrum of gas and liquid fuel including emerging synthetic choices. Gases include ultra-low heating value process gas, syngas, ultrahigh hydrogen, or higher heating capability fuels. The integration of heavy-duty gas turbine technology with synthetic fuel gas processes using lowvalue feed stocks in global power generation marketplace was covered by Brdar and Jones [7]. In their paper they summarized the experience gained from several syngas projects and lessons learned that continue to foster cost reductions and improve the operational reliability of gas turbine. They concluded that further improvements in system performance and plant design are needed in the future. The design of combustion systems using syngas as fuel can take advantage of CFD analysis to optimize the efficiency of the combustion system with respect to the limitations of pollutants emission. The aim of this work is to analyze the fundamental impacts of firing syngas in gas turbine combustor and predict the changes in the firing temperature and emissions with respect to natural gas or methane combustion.
2. Governing Equations
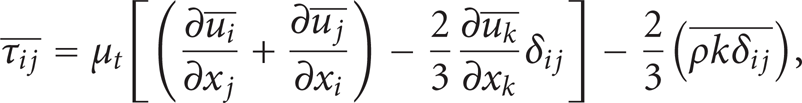
The mathematical equations describing the syngas fuel combustion are based on the equations of conservation of mass, momentum, and energy together with other supplementary equations for the turbulence and combustion. The standard k-ε turbulence model is used in this study. The equations for the turbulent kinetic energy k and the dissipation rate of the turbulent kinetic energy ε are solved. For non premixed combustion modeling, the mixture fraction/PDF model is used. The timeaveraged gas phase equations for steady turbulent flow are:

Φ is the dependent variable that can represent the velocity u i , T the temperature, k the turbulent kinetic energy, ε the dissipation rate of the turbulent kinetic energy, and f the mixture fraction. The governing equations are:
2.1. Continuity

2.2. Momentum Equation

where

where k is the average turbulent kinetic energy defined as:
2.3. Turbulent Kinetic Energy Equation

where σ k = 1 and G k is the production of the turbulent kinetic energy defined as

2.4. Dissipation of the Kinetic Energy

where
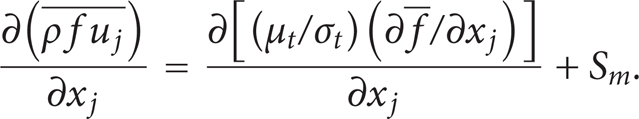
2.5. Mixture Fraction f
In non-premixed combustion, fuel and oxidizer enter the reaction zone in distinct streams. The PDF/mixture fraction model is used for non premixed combustion modeling. In this approach individual species transport equations are not solved. Instead, equation for the conserved scalar (f) is solved, and individual component concentrations are derived from the predicted mixture fraction distribution. The mixture fraction equation is given by
The mixture fraction, f, can be written in terms of elemental mass fraction as

where Z k is the element mass fraction of some element k. Subscripts F and O denote fuel and oxidizer inlet stream values, respectively. For the mixture fraction approach, the equilibrium chemistry PDF model is used. The equilibrium system consists of 13 species (C, CH4, CO, CO2, H, H2, H2O, N2, NO, O, O2, OH, HO2). The chemistry is assumed to be fast enough to achieve equilibrium.
2.6. Energy Equation
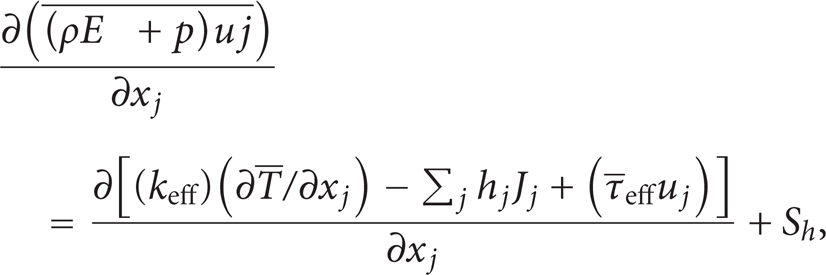
where E is the total energy (
2.7. Equation for the P-1 Radiation Model—Radiation Flux Equation
The P-1 radiation model is used in this study to simulate the radiation from the flame. The radiation model is based on the expansion of the radiation intensity into an orthogonal series of spherical harmonics (Cheng [8] and Siegel and Howell [9]). The P-1 radiation model is the simplest case of the P-N model. If only four terms in the series are used, the following equation is obtained for the radiation flux:

where a is the absorption coefficient, σ S is the scattering coefficient, G is the incident radiation, and C is the linear-anisotropic phase function coefficient (Cheng [8] and Siegel and Howell [9]).
The transport equation for G is

3. Geometry, Boundary Conditions, Mesh, and Numerical Method
The gas turbine can combustor is designed to burn the fuel efficiently, lower the emissions, and keep the combustor wall temperatures low. The basic geometry of the gas turbine can combustor is shown in Figure 1. The size of the combustor is 590 mm in the Z direction, 250 mm in the Y direction, and 230 mm in the X direction. The primary inlet air is guided by vanes to give the air a swirling velocity component (see Figure 1(a)). The boundary conditions of the primary air are as follows: the injection velocity is 10 m/s, the temperature is 300 K, the turbulence intensity is 10%, mixture fraction f = 0 and the injection diameter is 85 mm. The fuel is injected through six fuel inlets in the swirling primary air flow (see Figure 1(a)). The boundary conditions of the fuel are as follows: mass flow rate, 0.001 Kg/s, the temperature is 300 K, the turbulence intensity is 10%, mixture fraction f = 1 and the injector diameter is 4.2 mm. The secondary air or dilution air is injected at 0.1 meters from the fuel injector to control the flame temperature and
Geometry of the gas turbine can combustor, (a) primary air (blue) and six fuel inlets, (b) secondary air (blue) and outlet.


Mesh for the basic geometry of gas turbine can combustor.
4. Results
The impact of the variability in the syngas fuel composition and low heating value on the combustion performance and emissions in gas turbine can combustor is performed in this study. Table 1 shows the composition for the five syngas fuel and their lower heating values selected for this CFD analysis. The syngas fuels were produced using different gasification processes (Todd [10]) and using different feed stocks (coal, biomass, waste). The range of the constituents volume fractions for the selected syngas fuels are hydrogen (1) (H2) = 22.6% −.6%, (2) carbon monoxide (CO) = 23.6%–46.6%, (3) methane (CH4) = 0.1%–6.9%, (4) carbon dioxide (CO2) = 5.6%–17.9%, (5) Nitrogen (N2) = 1.1 %–49.3%, and (6) water (H2O) = 0.3%–39.8%. The hydrogen to carbon monoxide volume ratio for these five syngasis between 0.63 and 2.36. Table 1 shows also that the lower heating values for the syngas fuels are smaller compared to the lower heating value of the methane. It is also noted that syngas 1 (Schwarze Pumpe) has the highest hydrogen volume fraction (61.9%), syngas 2 (Exxon Singapore) has the highest carbon dioxide volume fraction, syngas 3 (Tampa) has the highest carbon monoxide volume fraction (46.6%), and syngas 5 (Sarlux) has the highest water vapor volume fraction (39.8%).
Syngas compositions.

The contours of the predicted gas temperature for the combustion of methane in gas turbine can combustor are shown in Figures 3 and 4. The maximum gas temperature for methane combustion is 2200 K. For the validation of the combustion model, the predicted flame temperature for methane combustion was compared to the adiabatic flame temperature. For natural gas or methane fuel and with initial atmospheric conditions (1 bar and 20 C), the theoretical flame temperature produced by the flame with a fast combustion reaction is 2233 K. The predicted maximum temperature of the combustion products or the adiabatic flame temperature compares well with the theoretical adiabatic flame temperature. The peak gas temperature is located in the primary reaction zone. The fuel from the six injectors is first mixed in the swirling air before burning in the primary reaction zone. The gas temperature decreases after the primary reaction zone due to the dilution of the flame with the secondary air.

Temperature contours (X-Z Plane, Y = 0): combustion of methane in gas turbine can combustor.
Temperature contours (X-Y Plane)—Combustion of methane in gas turbine can combustor.

Figure 4 shows the temperature contours (X-Y Plane) for methane combustion in can combustor at different axial positions (Z = 134 mm to 590 mm). The first contour (Z = 134 mm) represents the gas temperature near the six fuel injections. The fuel is injected from the six fuel inlets and mixedwith the swirling air before the start of the combustion. The size of the flame increases downstream and reach a maximum radius at Z = 200 mm. The radius and temperature of the flame decrease after that with the increase of the axial distance Z (Z = 300, 400, and 500 mm). The lowest gas temperature is reached at the exit (Z = 590 mm) of the gas turbine can combustor. A uniform gas temperature distribution is obtained at the exit of the can combustor as shown in Figures 3 and 4.
The contours of the velocity w (Z-component) for methane combustion in gas turbine can combustor is shown in Figure 5. The primary air is injected in the Z-direction with initial velocity of 10 m/s. The primary air is accelerated (up to 16 m/s) at the entrance of the combustors due to the presence of swirlers vanes (see Figure 1). Swirlers curved vanes are used to generate recirculation zone at the entrance of the combustion chamber. Strong recirculation regions are produced in the fuel injection region. This will help to increase the turbulence and mix very well the fuel and air in the primary reaction zone. This will in turn burn the fuel efficiently and reduce the pollutants emissions. Figure 6 shows the contours (X-Y Plane) of the velocity swirling strength for Z = 134 mm to 400. Strong recirculation regions with strong swirling strength are shown at the entrance regions near the fuel injection. The contours show that the velocity swirling strength decreases downstream with the increase of the axial distance Z. The velocity swirling strength contours at Z = 200 shows an annulus region with high swirling strength.

Contours of the velocity w (z-direction) in the y-z plane: combustion of methane in the gas turbine can combustor.
Contours of velocity swirling strength (X-Y plane): combustion of methane in gas turbine can combustor.

The results of methane combustion in gas turbine can combustor are used as a baseline for comparison with syngas fuel combustion. The effect of syngas fuel compositions on gas temperature, CO2 and
Fuel and air injection conditions and power generated.

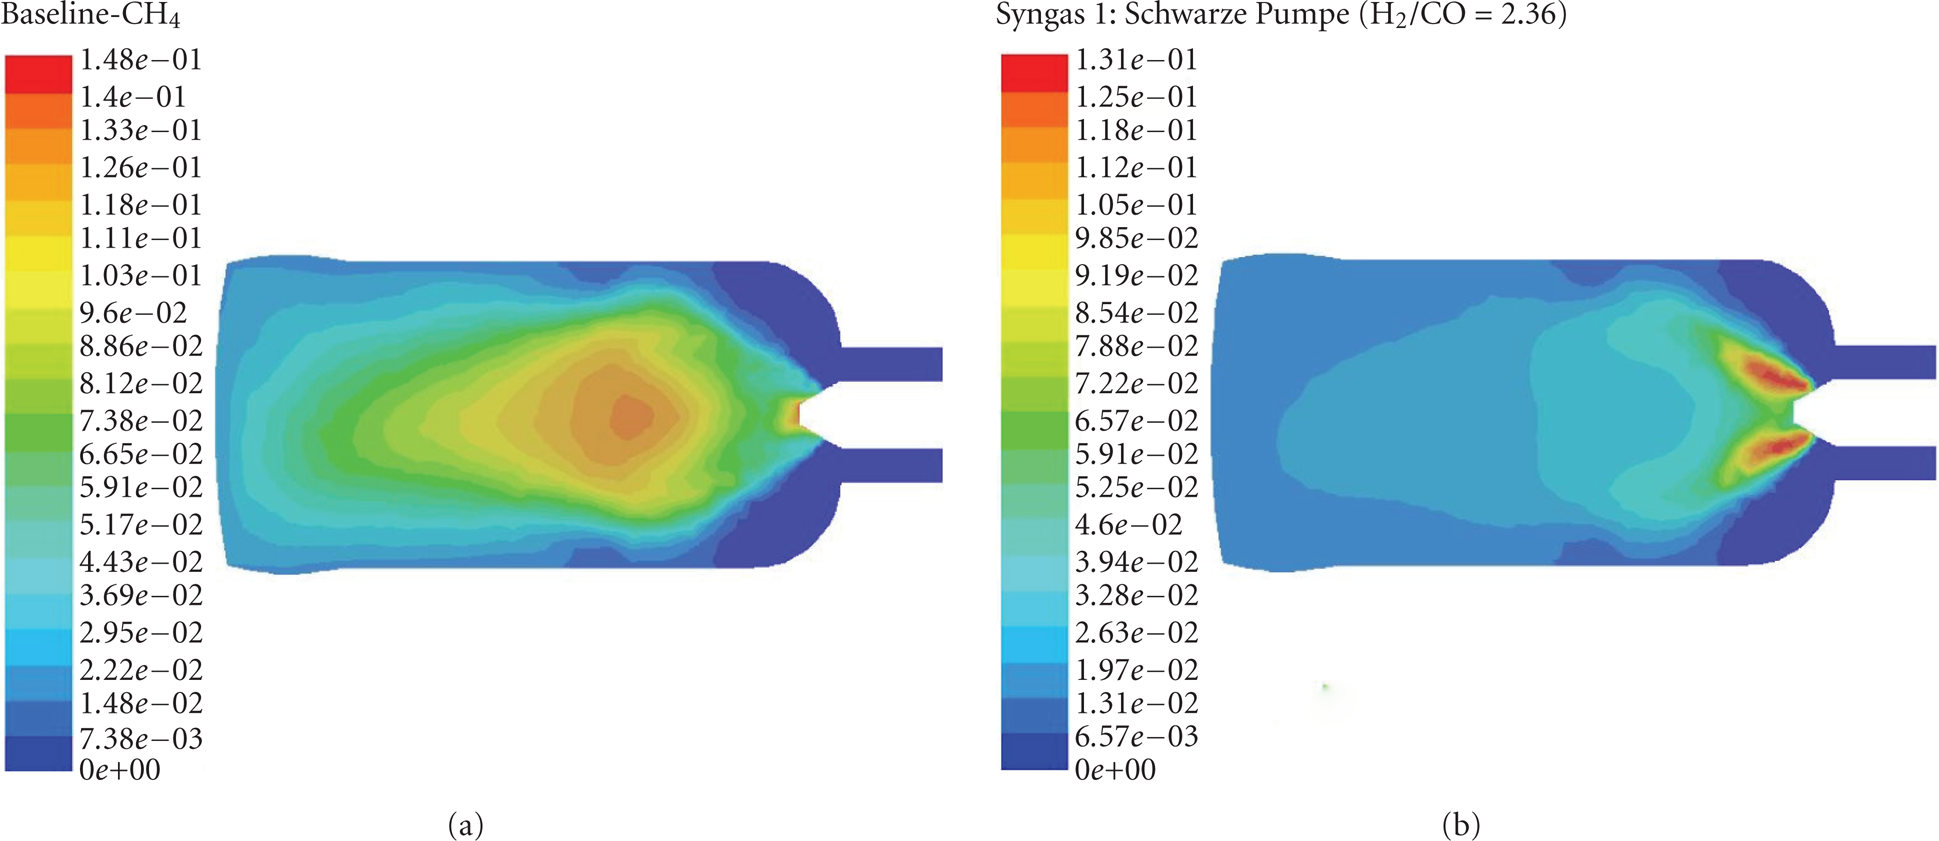
Temperature contours for natural gas and syngas fuel mixtures with the same fuel mass flow rate: effect of Syngas composition (H2/CO).

Contours of CO2 mass fraction.
(a) Average carbon dioxide (CO2) mass fractions at the exit of can combustor. (b) Average mass of carbon dioxide at the exit per unit of energy generation.

The
Contours of NO mass fraction.

(a) Average NO mass fractions at the exit of the can combustor. (b) Average mass of NO at the exit per unit of energy generation.

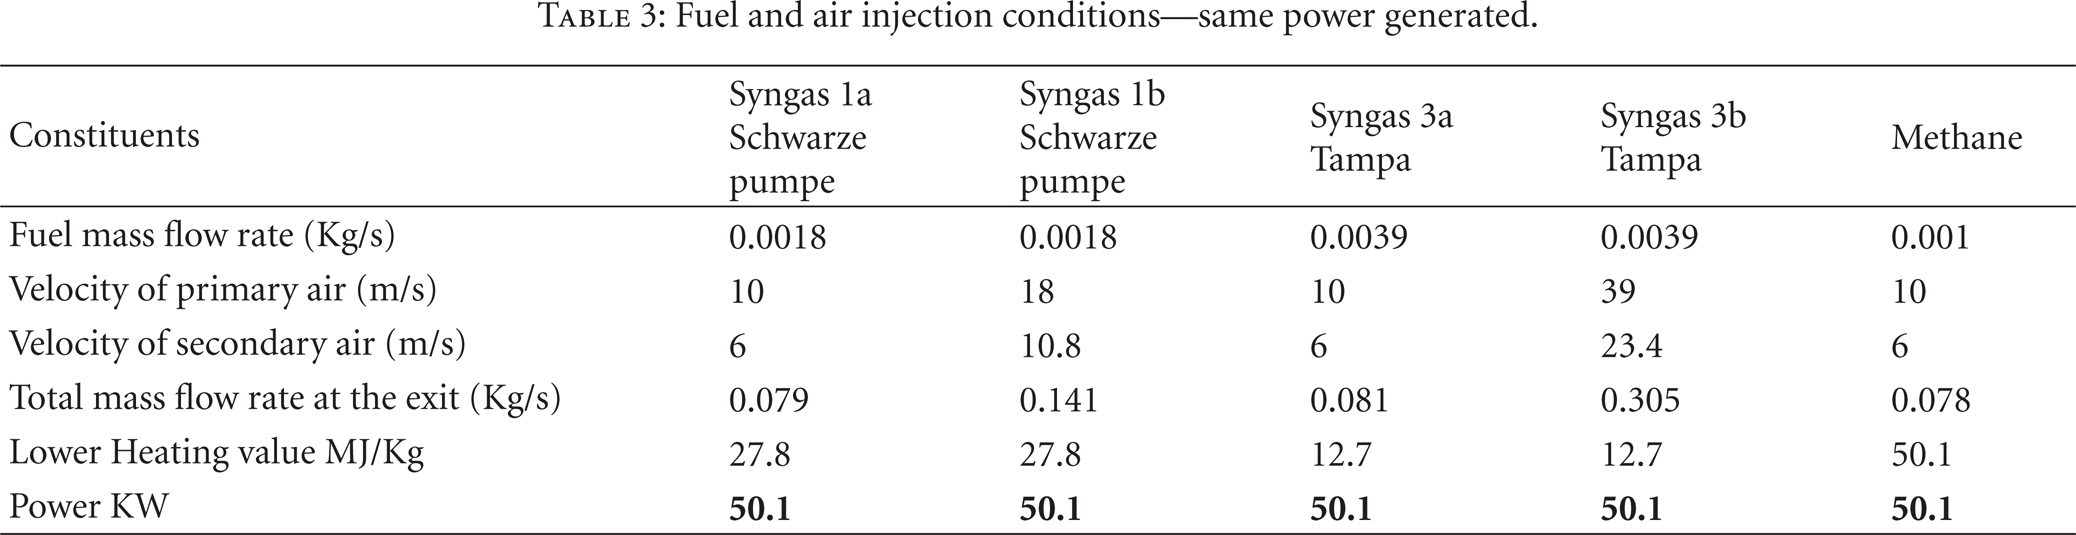
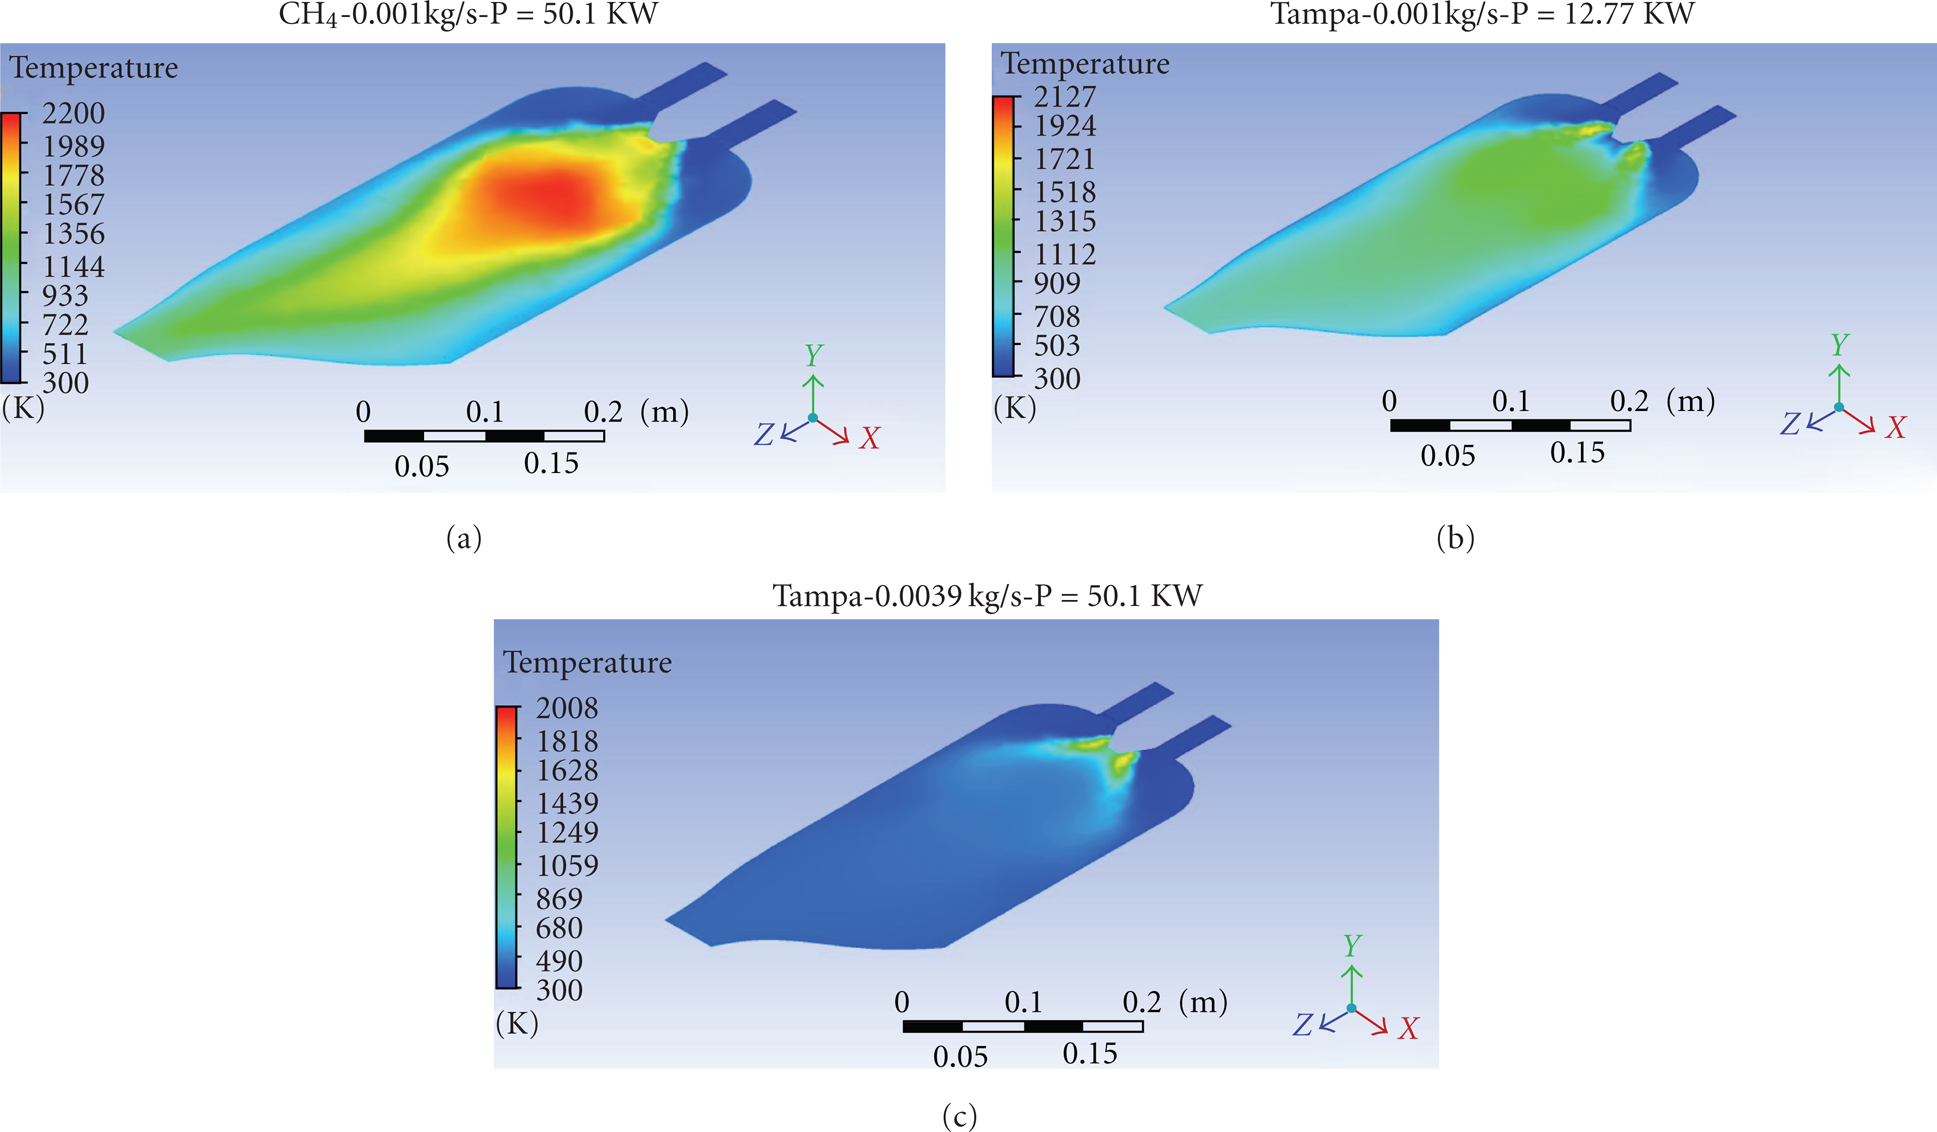
It is noted that all the results presented in Figures 7 to 11 were obtained with a constant fuel flow rate. The syngas fuel composition and lower heating values were changed but the fuel mass flow rate was kept constant at 0.001 Kg/s. In fact when syngas heating value decreases, the mass fuel flow rate should increase to keep the same energy input in the can combustor. For the same fuel input in the can combustor, the fuel mass flow is four to five times greater than for methane or natural gas, due to the lower heating value of the syngas. Methane has a high lower heating value of 50.1 MJ/Kg. The lower heating values for the five syngas tested in this study is between 10.4 MJ/Kg and 27.8 MJ/Kg. Syngas is primarily composed of carbon monoxide and hydrogen but also contains a significant fraction (up to 50%) of non combustibles (nitrogen, steam, carbon dioxide). The volumetric heating values of pure methane, hydrogen, and carbon monoxide are, respectively, 33.5, 10.2, and 12.6 MJ/m3. The hydrogen and carbon monoxide has a lower volumetric heating value about 1/3 of the lower heating value of methane. When combined with nitrogen, water, and carbon dioxide in the gas stream, the syngas fuel volumetric heating value is even smaller (see Table 1). A comparison of the combustion process and emissions between the methane and syngas fuels with the same power and different fuel mass flow rate was investigated (see Table 3). The fuel mass flow rate for syngas 1 (Schwarze Pumpe) was increased from 0.001 Kg/s to 0.0018 Kg/s and syngas 3 (Tampa) was increased from 0.001 Kg/s to 0.0039 Kg/s to match the same heat input for the methane. It is noted that the heat input from methane combustion is 50.1 KW with a fuel mass flow rate of 0.001 Kg/s. The heat input from synags 1 (Schwarze Pumpe) with a fuel flow rate of 0.001 Kg/s and 0.0018 Kg/s is 27.8 KW and 50.1 KW. The heat input from synags 3 (Tampa) with a fuel flow rate of 0.001 Kg/s, and 0.0039 Kg/s is 12.7 KW and 50.1 KW. The fuel mass flow rates for syngas 1 and syngas 3 were increased, respectively, by a factor of 1.8 and 3.9 to match the same heat input for methane. The heat input (KW) was obtained by multiplying the lower heating value of the fuel (MJ/Kg) by the fuel mass flow rate (Kg/s). It is also noted that the primary and secondary air mass flow rates were increased accordingly to the increase in the fuel mass flow rate (see Table 3). Figure 12 shows the temperature contours of methane and syngas 3 with low and high fuel mass flow rate (same power of 50.1 KW). The results with the high fuel mass flow rate for syngas 3 or the same power show the same effects (lower gas temperature and shorter flame) as the results obtained with low fuel mass flow rate. The average masses of CO2 and NO at the exit of the can combustor per unit of energy generation obtained with the same power were calculated, and the results are presented in Figures 13 and 14. With the same power, Figure 13 shows a reduction of the mass of CO2 per unit energy generation of about 10.7% to 12.5% for Schwarze Pumpe syngas fuel compared to methane fuel but higher value of CO2 for Tampa syngas fuel. Figure 14 shows a reduction of the mass of NO per unit energy generated for syngas fuel compared to methane fuel only when the primary and secondary air mass flow rates were increased according to the increase in the fuel mass flow rate (Schwarze Pumpe Syngas 1b and Tampa Syngas 3b) a shown in Table 3.
Fuel and air injection conditions—same power generated.
Syngas temperature contours: effect of fuel mass flow rate.

Average mass of carbon dioxide at the exit per unit of energy generation—same power 50.1 KW for all the fuels tested.

Average mass of NO at the exit per unit of energy generation—same power 50.1 KW for all the fuels tested.
5. Conclusions
Three-dimensional CFD analysis of syngas fuel combustion in gas turbine can combustor is presented in this study. Five Syngas fuel mixtures with different fuel compositions (H2/CO = 0.63 to 2.63) and low heating values (8224 KJ/m3 to 12492 KJ/m3) were tested in this study. The syngas fuels are produced by different gasification processes using different feed stocks (coal, biomass, waste). The k-ε model was used for turbulence modeling, mixture fractions/PDF model for non premixed gas combustion and P-1 for radiation modeling. The effect of the syngas fuel composition (H2, CO, CO2, CH4, N2, H2O) and fuel heating values on syngas flame shape, gas temperature, carbon dioxide (CO2), and nitrogen oxides (
Baseline fuel (methane) combustion: the results of the gas temperature, velocity field, swirling strength and CO2 and
The gas temperature for the all five syngas shows a lower gas temperature compared to the temperature of methane. The gas temperature reduction depends on the lower heating value and the combustible constituents (hydrogen, carbon monoxide, and methane) and non combustibles (inert) constituents in the syngas fuel.
The results show a reduction (30% to 49%) of CO2 mass fraction at the exit of the can combustor when methane is replaced with syngas fuel that produces less power (20% to 55% power reduction with syngas fuel). The reduction of CO2 concentrations depends on the carbon monoxide and methane volume fractions in syngas fuel. For the same power generated by the methane and syngas fuels combustion, the results show a higher mass of CO2 emitted per unit of energy generation (Kg/KJ) for Exxon Singapore, Tampa, and PSI syngas fuels compared to methane fuel. Schwarze Pumpe was the only syngas fuel that shows a reduction of about 12% of the average mass of CO2 emitted per unit of energy generation (Kg/KJ) compared to methane fuel.
With the same fuel mass flow rate but less power generated for the syngas fuel, the results show a reduction (11.5% to 97.6%) of the average NO mass fraction for synags fuel compared to methane. Syngas is used in non premixed combustion to control the
The results obtained in this study show the change in gas turbine can combustor performance (temperature, flame shape, CO2 emissions, and NO emissions) when natural gas or methane fuel is replaced by syngas fuels with lower heating value and fuel compositions.