
Abstract
We presented the mathematical model in the iron reactor. The model was limited to Isobaric Zone and Cooling Zone termed as IZ and CZ, respectively. The simulation was done by adapting the heat and mass transfer equations. The main purpose of this paper is to estimate the temperature increasing effect of reduced-iron on sponge-iron quality. The calculations are solved using Finite Element Method (FEM). The results showed that the temperature and concentration values from the simulation have high similarity to the reference data with Root-Mean-Square Error (RMSE) about 0.7. The formation of total-carbon in the both zones decreased metallization degree until 1.72%. The increase in reduced-iron temperature higher than 1200 K produces total-carbon higher than 3%. Thus the increase in reduced-iron temperature more than 1200 K is not recommended because it can decrease metallization degree.
1. Introduction
In steel industries, most plants are still facing some difficulties in operation and only having a little progress in solving of backward capacities. One alternative way to increase production capacity is by rising reduction-gas temperature in iron reactor. However, this rising will also increase reduced-iron temperature because of the direct contact between reduction-gas and reduced-iron based on iron reactor configuration shown on Figure 1. Higher cooling-gas flow rate will be needed to accommodate the increase in reduced-iron temperature. Product quality will also be affected as the result of cooling-gas increasing.

Scheme of iron reactor.
The increase in reduction-gas temperature on product quality should be investigated based on the previous explanation. In practice, direct investigation in the plant is impossible because it will spend much cost and time; therefore, a simulator will be needed. We designed a simulator by composing a mathematical model. This model represented the iron reactor to reproduce the data from reference. For this purpose, we used the reference data from Direct Reduced Iron (DRI) plant.
Based on Figure 1, iron reactor is divided into 3 zones: Reduction Zone, Isobaric Zone, and Cooling Zone, termed as RZ, IZ, and CZ, respectively. In this paper, the mathematical model is limited to Isobaric Zone and Cooling Cone. Since reduction zone is not modeled here, the increase in reduction-gas temperature is represented by an increase in reduced-iron temperature on the inlet of IZ.
Some mathematical models for iron reactor were composed by other researchers [1–3]. However they did not discuss in detail the effect of reduction-gas and reduced-iron temperature on sponge-iron quality. The discussions were limited on the modeling of iron ore reduction.
The quality of sponge-iron is primarily ascertained by the percentage of metallization (removal of oxygen), which is the ratio of metallic iron to the total iron present in the product. Higher total-carbon percentage which consists of iron carbide and free carbon termed as Fe3C and C in the sponge-iron will decrease metallization degree. Motlagh [4] had found that in the presence of metallic iron, the rates of carbon deposition were directly related to the gas flow rate although he did not explain in detail. Thus, in this paper, we will also discuss about the effect of cooling-gas flow rate on total-carbon formation.
2. Parameter Determination and Selection
Iron reactor is a counter current reactor to produce sponge-iron from iron ore. In RZ, some chemical reactions occurred between reduction-gas and iron ore pellet. The reactions extract iron metal from the ore to produce reduced-iron. The reduced-iron is cooled in the CZ after passing through the IZ.
The IZ is utilized to anticipate mixing between leaking gas from the RZ and CZ though it is difficult to be avoided. Small part of cooling-gas usually slips and reacts with reduced-iron from RZ by the following reaction:

From Fe3C decomposition and methane cracking, C will be also produced using reaction

Another reaction that occurs in this zone is water gas shift reaction which produces CO and H2O by reaction

All reactions occur in solid phase except water gas shift reaction. Because the composition of cooling-gas in IZ and CZ is the same, the reactions in both zones are also the same.
We generated the mathematical models of IZ and CZ for the gas and solid phases. These models consist of heat and mass transfer equations. Kinetic equations are taken into account based on the reactions which occur in each zone. The equations are formulated with the following assumptions
Operating condition is steady state.
Heat loss through the wall of the reactor occurs only in the CZ.
Decomposition reactions of ethane and propane are ignored.
Plug flow is used to approach a model for gas and solid phases.
By considering the above assumptions, the heat and mass transfer equations are formulated as follows.
Mass transfer equations for IZ and CZ

Heat transfer equations for IZ

Heat transfer equations for CZ

The mass transfer equations for IZ and CZ are the same, but the heat transfer equations are different. The heat transfer equations in CZ use heat loss parameter from the wall of reactor; whereas heat transfer equations in IZ ignore it.
Kinetic equations of Fe3C formation (r1), methane cracking (r2), Fe3C decomposition reaction (r3), and water gas shift reaction (r4) in the IZ and CZ are defined as

The correction factor f is added to the model because reaction constant values are adopted from Arabczyk et al. [1], Matamala and Cañete [2], and Newsome [5].
Heat capacities of gas and solid phase are calculated based on the temperature changes in each phase. On the gas phase, heat capacity value is calculated based on the mixing of heat capacity of CH4 and H2. The other components such as C2H4, C3H6, H2O, CO, CO2, and N2 are omitted because they have small fraction compared to CH4 and H2. The heat capacity of gas phase is evaluated as

We used constant values of a,b,c, and d for CH4 and H2 as defined by Reklaitis [6]. Heat capacity of solid phase is calculated based on heat capacity of Fe. The other components in the solid phase such as Fe3C, C, and gangue are omitted in this calculation. Heat capacity parameter of Fe as obtained from Perry and green [7] is shown in equation

Standard reaction enthalpy (
3. Model Execution
We calculated simultaneously the mathematical models by Finite Element Method (FEM) for IZ and CZ. The results of calculation were then validated by the reference data.
In this modeling, we adjust six correction factor values (f) until gas and solid composition have RMSE about 0.7 compare to the reference data. Their values are listed in Table 1. The f is used to correct reaction constant value which is adopted from literature [1, 2, 5].
General data and correction factor values.

Table 2 shows the comparison list between reference data and the simulation (see Figure 1 for reference note). There are 2 data unavailable in the plant because the measuring instruments are not usable. Leaking gas from IZ and total-carbon formed in the each zone which are used as references in Table 2 are calculated from the mass and energy balance equation.
Comparison between reference data and simulation results.

*Flow numbers are refereed to Figure 1.
**From reference data calculation.
In the reference at Table 2, gas reduction temperature at flow 2 and 1 is about 1203 and 1193 K, respectively. The gas at flow 1 is a gas-mixture between the leaking gas from IZ and gas at flow 2. Therefore, the output temperature of leaking gas from IZ is calculated about 1139 K by following equation:

Based on the reference data, about 10% of cooling-gas usually slip to IZ and react with reduced-iron from RZ. This condition causes the formation of total-carbon starting from IZ to CZ. We calculated total-carbon formed in the each zone by mole balance reaction. Since total-carbon is formed by methane cracking, mole difference between CH4 inlet and outlet in the reference data of cooling-gas can give the information about total-carbon formation in the each zone. The total-carbon formation in the CZ and IZ is about 407 and 171 gram/second, respectively.
4. Concentration and Temperature Profile in IZ and CZ
The results of simulation are shown by the profile of concentration and temperature. The profile of gas concentration in Figure 2(b) shows that the concentrations of some components changed slightly by water-gas-shift reaction. Conversion of CO and H2O to CO2 and H2 makes percentage of CO and H2O decreased, while CO2 and H2 increased. Calculation of mole balance has been equivalent between CO, H2O, and CO2 moles.
Profiles of many variables as a function of the depth of isobaric and cooling zone: (a) gas concentration; (b) solid concentration; (c) gas and solid temperature.
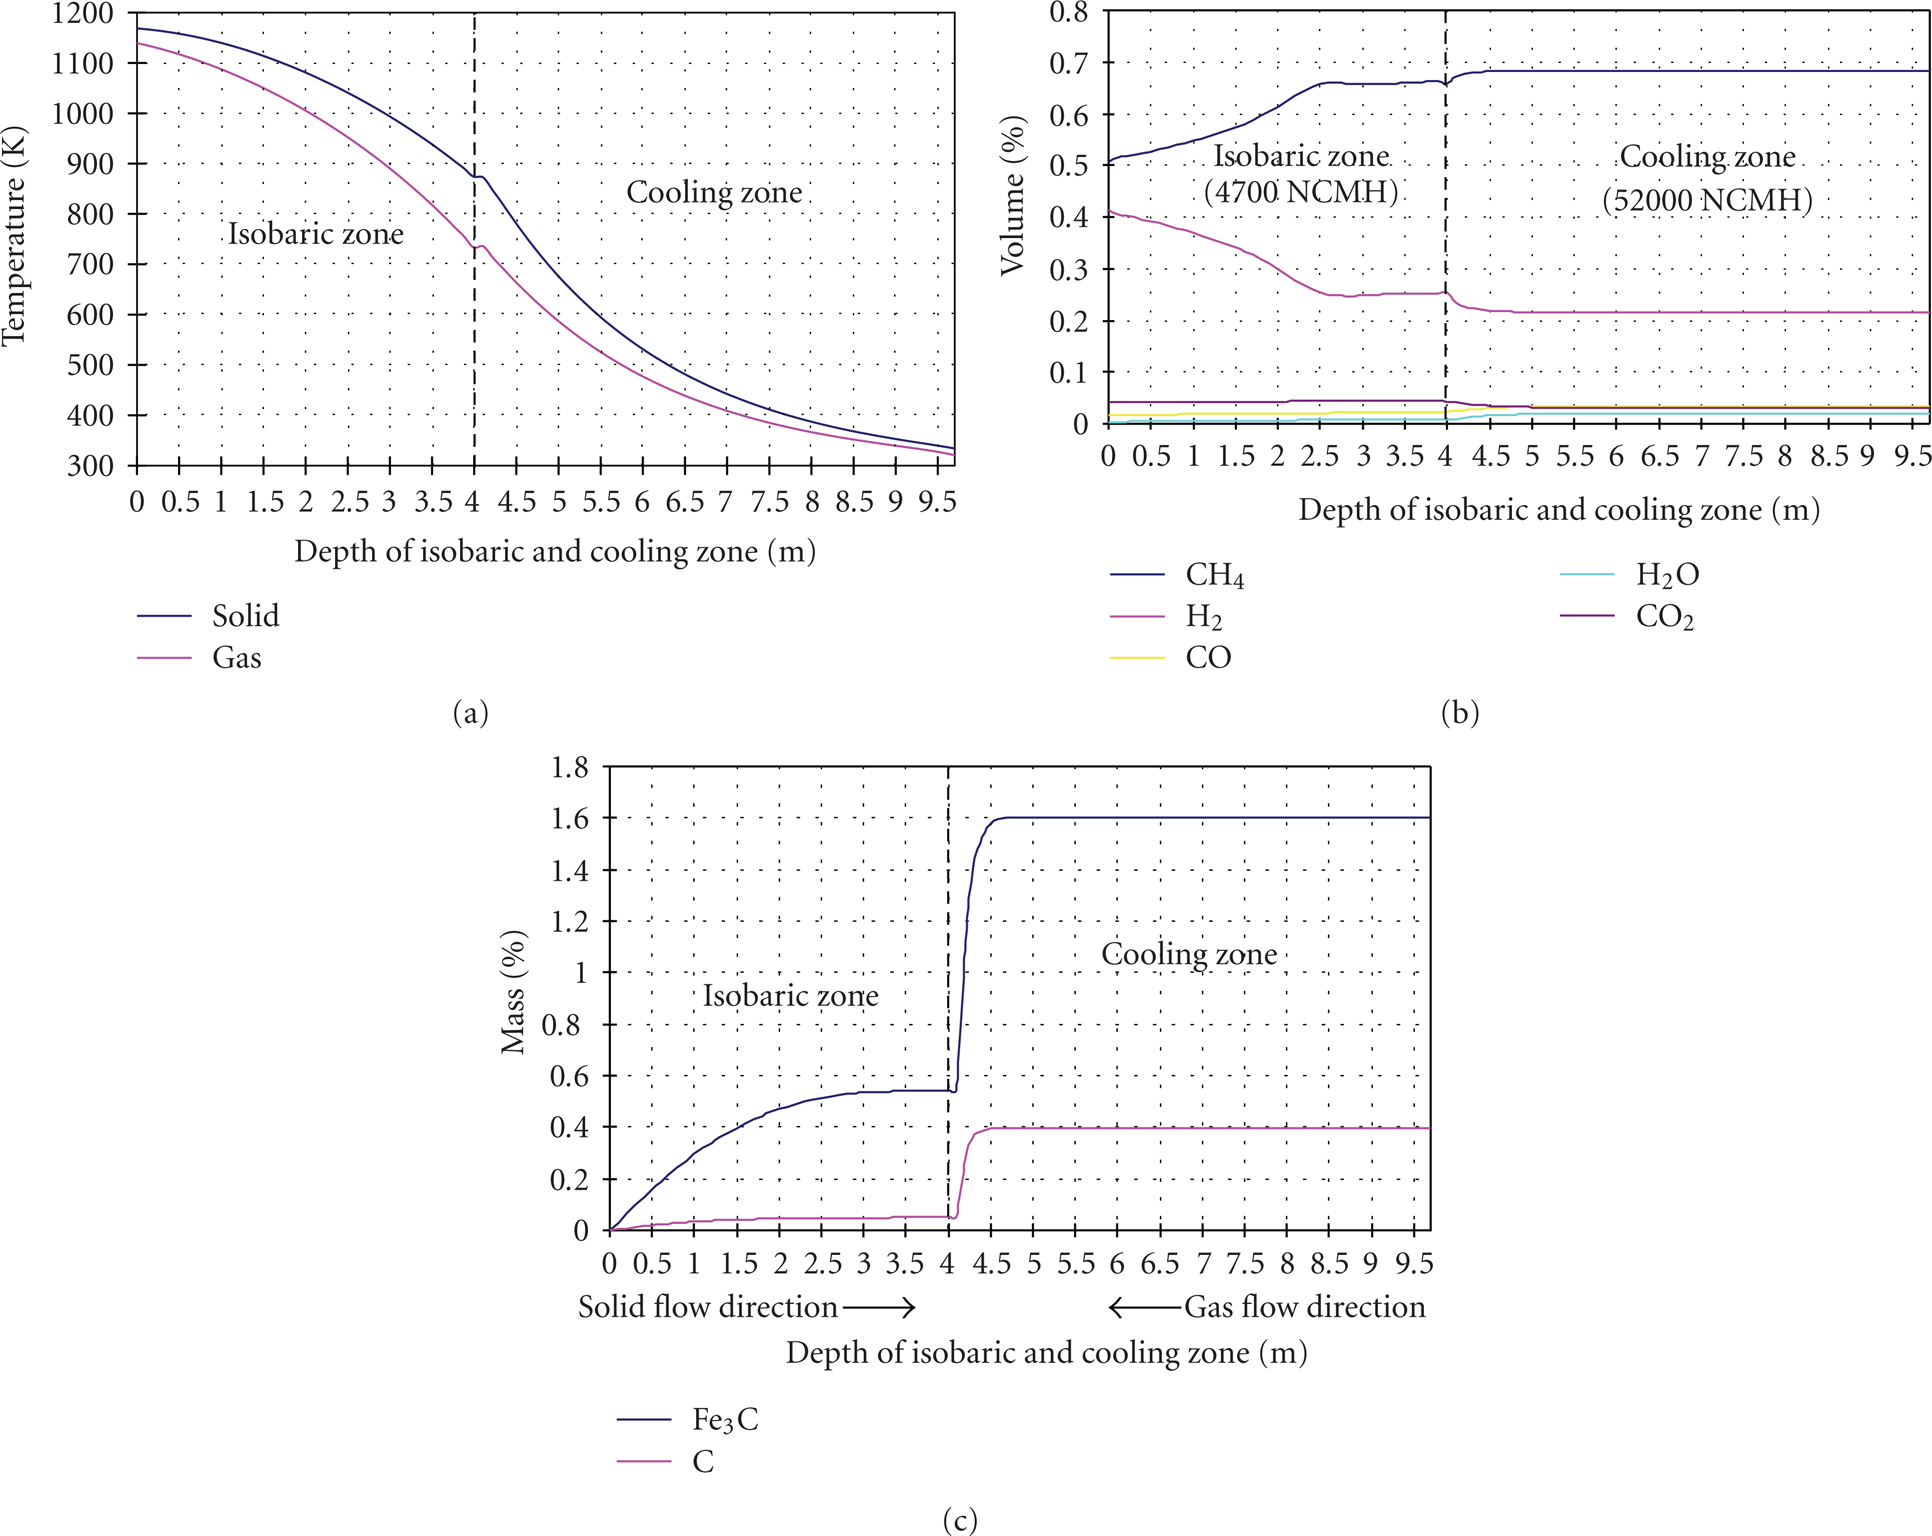
Based on the slight changes of CO and H2O concentration on Figure 2(b), water-gas-shift reaction is begun at 4.7 m depth in IZ and CZ (from gas flow direction) when gas temperature reaches 631 K. Ono et al. [8] said that water-gas-shift reaction is usually performed with oxide iron catalyst at temperature between 643 and 723 K. This reaction also can be performed by the same catalyst at lower temperature about 600 K [5].
The profile of gas concentration in Figure 2(b) also shows that the methane concentration is constant at the gas inlet point of CZ. However it decreases at 4.5 m depth of CZ and IZ. A decrease in methane concentration is caused by methane cracking and Fe3C formation reaction. At the same depth, the hydrogen profile shows amplification due to those reactions.
The concentration profiles of methane and hydrogen agreed with concentration profiles of solid (see Figure 2(c)). From solid flow direction, the formation of total-carbon which originates from Fe3C and C is formed at IZ to CZ. The formation of Fe3C and C ends at 4.5 m and 4.25 m depth of IZ and CZ, respectively. The calculation of mole balances has been equivalent between CH4, H2, Fe3C, and C moles.
The formation of total-carbon in sponge-iron decreases degree of metallization. Based on the composition data of sponge-iron in Table 3, we obtained the degree of metallization about 92.49%. If the total-carbon is not formed in the product, we could obtain higher degree of metallization about 94.21%. Therefore, the formation of total-carbon in IZ and CZ decreases the degree of metallization about 1.72%.
Composition of make-up cooling-gas.

The profile of solid temperature in Figure 2(a) also implies that Fe3C and C do not form at temperature lower than 723 K and 779 K, respectively. Pilipenko and Veselov [9] said that at the temperature range of 723–773K, the formation of Fe3C occurs in the process of methane decomposition of the iron powder. The formation of the C at 773 K also agreed with the equilibrium diagram for the system of iron-methane-hydrogen [10].
5. The Effect of Reduced-Iron Temperature on Total-Carbon Formation
Simulation of IZ and CZ was executed simultaneously on production capacity of 2500 tons/day. In this simulation, the increase in reduced-iron temperature is followed by an increase in cooling-gas flow rate. By simulating five values of reduced-iron temperature, we got the value of cooling-gas flow rate for every increment. We also show the total-carbon value as a function of cooling-gas change in this simulation.
Based on Figure 3(a), the increase in input temperature of solid (reduced-iron) at 0 m depth of IZ and CZ need higher cooling-gas to keep the temperature of product (reduced-iron output) about 330 K. An increase in reduced-iron input temperature to 1200 K needs flow rate of cooling-gas about 64000 NCMH. The increase in temperature of reduced-iron is followed by an increase in cooling-gas flow rate. However, the temperature of cooling-gas in the outlet of IZ (at 0 m depth of IZ and CZ) still increases as shown in Figure 3(b).
Temperature profiles in IZ and CZ: (a) solid; (b) gas.

In this simulation, the concentrations of cooling-gas inlet are calculated based on mixed composition between recycle and make-up cooling-gas. The composition of make-up cooling-gas is based on reference data (see Table 3). Figure 4 shows that an increase in cooling-gas flow rate to 64000 NCMH could produce total-carbon about 900 gram/second. It implies that the total-carbon in the sponge-iron is about 3% mass. This percentage is higher than normal quality of sponge-iron about 2% mass. Usually the limit of carbon content in the sponge-iron is 1%–3% by weight [3]. If maximum total-carbon content in sponge-iron is 3% mass, an increase in cooling-gas more than 64000 NCMH is not recommended due to degradation of product quality. Thus based on the previous explanation, an increase in reduced-iron temperature to 1200 K is also not recommended because it needed flow rate of cooling-gas more than 64000 NCMH.

Total-carbon formation as function of cooling-gas flow rate.
6. Summary
We simulated the mathematical model of IZ and CZ to study the effect of reduced-iron temperature on total carbon formation. The results have RMSE about 0.7 compared to the reference data. The error originated from temperature of cooling-gas output value.
Water-gas-shift reaction is begun at 4.7 m depth in IZ and CZ (from gas flow direction) when gas temperature reaches 631 K. The formation of Fe3C and C does not occur at temperature lower than 723 K and 779 K, respectively. The formation of total-carbon which consists of Fe3C and C in IZ and CZ reduced metallization degree until 1.72%. The cooling of sponge-iron began in IZ though only 10% of cooling-gas slip to IZ.
The increase in reduced-iron temperature needs higher cooling-gas flow rate to keep temperature of product about 330 K. An increase in reduced-iron temperature to 1200 K needs cooling-gas flow rate about 64000 NCMH. If maximum total carbon content allowed in sponge iron product is 900 gram/second (3% mass), the increase in cooling gas more than 64000 NCMH is not recommended. Therefore the increase in reduced-iron temperature higher than 1200 K is also not recommended because the total carbon percentage will be higher than 3%.