
Abstract
We present our recent progress on mesoscopic modeling of multiphysicochemical transport phenomena in porous media based on the lattice Boltzmann method. Simulation examples include injection of CO2-saturated brine into a limestone rock, two-phase behavior and flooding phenomena in polymer electrolyte fuel cells, and electroosmosis in homogeneously charged porous media. It is shown that the lattice Boltzmann method can account for multiple, coupled physicochemical processes in these systems and can shed some light on the underlying physics occurring at the fundamental scale. Therefore, it can be a potential powerful numerical tool to analyze multiphysicochemical processes in various energy, earth, and environmental systems.
1. Introduction
Multiphysicochemical transport phenomena in porous media are ubiquitous, particularly in various energy, earth, and environment systems. One example is the disposal of supercritical CO2 in geologic formations, the most promising near-term solution to the problem of reducing carbon emissions into the atmosphere [1]. Experimental analyses of the long-term fate of CO2 after injection into the geologic formations are not possible with relatively short-term laboratory experiments. Therefore it is necessary to employ comprehensive numerical models that incorporate multiple physicochemical processes involving interactions between the injected CO2, the brine in the pore spaces, and the minerals lining the pores. Supercritical CO2, as a buoyant and slightly miscible fluid, once injected, displaces brine from the pore space in a complex pattern. At the interface with brine, CO2 dissolves into the brine to form carbonic acid that can react with and dissolve minerals eventually leading to mineral precipitation further along the flow path. Clearly, there are multiple physics processes involved, including hydrodynamics, thermodynamics, chemical dynamics, and electrodynamics (because the surface of most natural media is charged). All these processes are ultimately governed by pore-scale interfacial phenomena, which occur at scales of microns. However, because of the wide disparity in scales ranging from pore to field, a continuum formulation based on spatial averages taken over length scales much larger than typical pore and mineral grain sizes is often utilized, implying the existence of a representative elemental volume (REV) [2]. As a result, spatial heterogeneities at smaller scales are unresolved and the aggregate effects of the pore-scale (mesoscopic scale) processes are taken into account through various effective constitutive parameters. One of the goals of performing pore-scale simulations is to obtain values for these constitutive parameters through upscaling the pore-scale results. Other goals are to identify key parameters and physicochemical processes that control macroscopic phenomena, and to validate continuum descriptions.
Another example is fuel cells, and in particular polymer electrolyte fuel cells (PEFCs). In PEFCs, the catalyst layer (CL) is the host to several competing transport mechanisms involving charge (proton and electron), species (oxygen, nitrogen, and water vapor), and liquid water transport. The multi-faceted functionality of a gas diffusion layer (GDL) includes reactant distribution, liquid water transport, electron transport, heat conduction, and mechanical support to the membrane-electrode-assembly. Despite tremendous recent progress in enhancing the overall cell performance, a pivotal performance limitation in PEFCs is manifested in terms of mass transport loss originating from suboptimal liquid water transport and resulting flooding in the constituent components [3]. In recent years, several macroscopic computational models for multiple-physicochemical transport processes in PEFCs [4–10] have been developed. These macroscopic models again are based on the theory of volume averaging and treat the catalyst layer and gas diffusion layer as macrohomogeneous porous layers. Due to their macroscopic nature, the current models fail to resolve the influence of the structural morphology of the CL and GDL on the underlying physics. Mesoscopic modeling is critical to understanding of the overall structure-wettability-transport interactions as well as the underlying multiphysicochemical processes in the CL and GDL, and hence is a useful tool for design and optimization of microstructures of electrodes for better performance and durability.
In this paper, we review our recent work on mesoscopic modeling of multiphysicochemical processes in porous media, based on the lattice Boltzmann method (LBM), a relatively new numerical method for simulating fluid flows and modeling physics in fluids [11]. Originating from the classical statistical physics, LBM is a mesoscopic method based on simplified kinetic equations. In the LBM, the fluid is modeled as a collection of fictitious particles propagating and colliding over a discrete lattice domain. Mesoscopic continuity and momentum equations can be obtained from this propagation-collision dynamics through a rigors mathematical analysis. The particulate nature and local dynamics provide advantages for complex boundaries and parallel computation. In addition, the kinetic nature of the LBM makes it easy to account for new physics in the LBM framework, which is especially useful for modeling multiphysicochemical phenomena. In Section 2, the partial differential equations governing fluid flow, transport of reactive species and electric potential, as well as mineral reactions in porous media will be given. In Section 3, the implementation of the LBM to solve these governing equations will be presented. Some simulation examples will be given in Section 4 and concluding remarks in Section 5.
2. Governing Equations
Consider the electrolyte fluid flowing through solid porous media. Although the pore scale in this study may be at micrometer scale, the fluid can still be treated as a continuum Newtonian fluid since the characteristic size is much larger than the molecular diameters [12–14].
2.1. Continuity and Momentum Equations
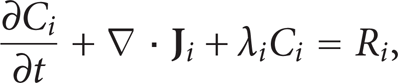
For isothermal incompressible fluid flow, the continuity and momentum equations can be written as [15]

where ρ represents the density of the fluid, t the time,
For the hydrodynamic boundary condition, we use the nonslip model at the solid surfaces. The slip boundary conditions have been adopted in some recent studies [16, 17]; however, a careful molecular study showed that the hydrodynamic boundary condition, slip or not, depended on the molecular interactions between fluid and solid and on the channel size [18, 19]. For the flow in porous media considered in this work, the nonslip boundary condition is still valid.
2.2. Transport Equations for Aqueous Species and Electrical Potential
For the ith ion species in the solute, the mass conservation equation describing transport and reaction can be written in the general form [20]
where C
i
denotes the ionic concentration,
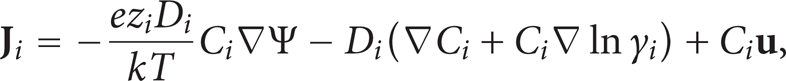
where the first term on the right refers to electrochemical migration, the second term to aqueous diffusion, and the last term to advective transport. Here z i , D i , and γ i denote the ion algebraic valence, the diffusivity, and the activity coefficient of the ith species, respectively; and e, k, and T denote the absolute charge of electron, the Boltzmann constant, and the absolute temperature, respectively. The quantity Ψ represents the local electrical potential caused by the ionic distribution which is governed by the Poisson equation

where ε r is the local dimensionless fluid dielectric constant, ε0 the permittivity of a vacuum, and ρ e the net charge density. Assuming no radiation and constant activity coefficient and substituting (4) into (2), we have

This is the Nernst-Planck equation [21], where

where Ψext is the external electrical potential field.
When the ionic convection is negligible and the electric potential is continuously derivable, (5) has a simple steady-state solution for dilute electrolyte solutions:

Substituting (7) into (4) yields the nonlinear PB equation [22]

2.3. Equations for Mineral Reaction Rates
Heterogeneous reactions between aqueous species and minerals at the pore-mineral interface are given by [23]

where n denotes the unit normal perpendicular to the fluid-mineral interface pointing toward the fluid phase, D denotes the aqueous diffusion coefficient assumed to be the same for all species for simplicity, and

3. Lattice Boltzmann Model Implementation
3.1. Incompressible Lattice Boltzmann Model for Single-Phase Flow
In order to eliminate compressible effects in the conventional LBM, here we use an incompressible LB model constructed by Guo et al. [24]. The pore-scale flow of a single aqueous fluid phase is simulated by the following evolution equation:
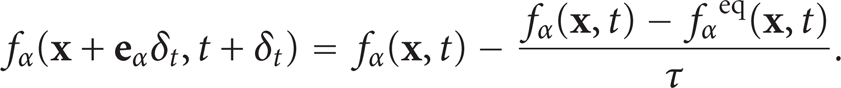
In the above equation, δ
t
is the time increment, f
α
the distribution function along the α direction in velocity space,
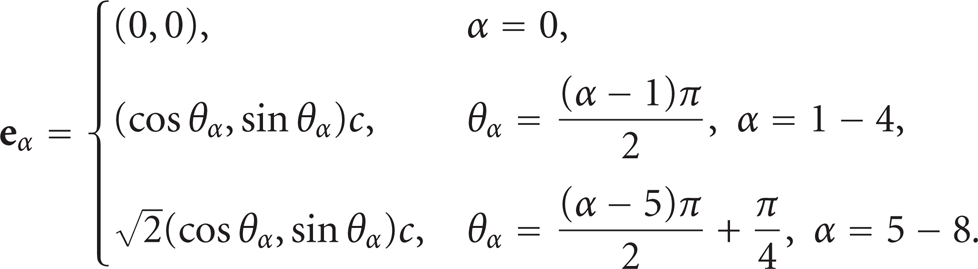
For the incompressible LB model, the equilibrium distribution is defined by Guo et al. [24]:

where σ,λ, and γ are the parameters satisfying

In these equations, c = δx/δt, where δx is the space increment, and p and

Equation (11) has been shown to recover (1) [24], with the velocity and pressure given by
respectively.
3.2. Lattice Boltzmann Model for Two-Phase Flow
The interaction-potential model, originally proposed by Shan and Chen [25], and henceforth referred to as the S-C model, introduces k distribution functions for a fluid mixture comprising of k components. Each distribution function represents a fluid component and satisfies the evolution equation. The nonlocal interaction between particles at neighboring lattice sites is included in the kinetics through a set of potentials. The LB equation for the kth component can be written as

where
The phase separation between different fluid phases, the wettability of a particular fluid phase to the solid, and the body force are taken into account by modifying the velocity used to calculate the equilibrium distribution function. An extra component-specific velocity due to interparticle interaction is added on top of a common velocity for each component. Interparticle interaction is realized through the total force,
The continuity and momentum equations can be obtained for the fluid mixture as a single fluid using Chapman-Enskog expansion procedure in the nearly incompressible limit:

where the total density and velocity of the fluid mixture are given, respectively, by
with a nonideal gas equation of state given by [28].
3.3. Lattice Boltzmann Model for Transport of Reactive Solutes
In a previous article, Kang et al. [29] have derived the following LB equation for the total primary species concentrations for chemical systems with reactions written in canonical form:

where N
C
is the number of primary species, Ψ
j
is the total concentration of the jth primary species, G
α,j
is its distribution function along the α direction,
It has been shown that the above equation can recover the following pore-scale advection-diffusion equation for Ψ j [30]:

This equation is the same as (5) except that here the electrochemical migration is neglected. Assuming that the homogeneous reactions are in instantaneous equilibrium, we have the following mass action equation [31, 32]:

where ν ji are the stoichiometric coefficients, K i is the equilibrium constant of the ith homogeneous reaction, γ i is the activity coefficient of the ith secondary species, and C j and C i are solute concentrations for primary and secondary species, respectively. They are related by

where N R is the number of independent homogeneous reactions, or, equivalently, secondary species.
More details on the heterogeneous reactions between aqueous species and minerals at the pore-mineral interface described by (9), and on the update of solid phase, can be found in [29, 33].
3.4. Lattice Poisson Method
To solve the Poisson equation with strong nonlinearity, (8), we adopt the lattice Poisson method (LPM) developed previously [34, 35], which tracks the electrical potential distribution transporting on the discrete lattices. By expanding (8) into the time-dependent form
with

where

where c′ is a pseudo-sound speed in the potential field. After evolving on the discrete lattices, the mesoscopic electrical potential can be calculated using
Although the electrical potential evolution equations are in an unsteady form, only the steady state result is realistic, because the electromagnetic susceptibility has not been considered. Although the lattice evolution method for nonlinear Poisson equation is not as efficient as the multi-grid solutions due to its long wavelength limit, it has the advantages of suitability for geometrical complexity and parallel computing.
4. Simulation Examples
4.1. Injection of CO2 into a Limestone Rock
We first present some modeling results on the injection of a fluid saturated with 170 bars CO2(g) into a limestone rock at the pore scale. The pore structure was derived from a digitized image of a limestone rock thin section with 640 × 480 pixels (Figure 1). We reduced the original resolution to save computational time (Figure 2). The chemical system of Na+-Ca2+-Mg2+-H+-SO42-Cl−-CO2 with the reaction of calcite to form dolomite and gypsum is considered. Secondary species included in the simulation are OH−,

Photographic image of a limestone rock thin section (640 × 480 pixels).
Digitized image with reduced resolution.
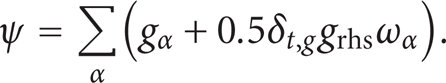
Resulting geometries at time = 15625 seconds for two different mineral reaction rate constants are plotted in Figure 3. Damkohler is 7.375 for calcite and gypsum, 0.7375 for dolomite for the faster mineral reactions,
Resulting geometries at time = 15625 seconds for two different mineral reaction rate constants: (a) large reaction rate constants; (b) small reaction rate constants.

Distribution of solute concentrations, pH value, and reaction rates at time = 15625 seconds for small reaction rate constants.

4.2. Two-Phase Behavior and Flooding Phenomena in Polymer Electrolyte Fuel Cells
In this Section, we present some results for two-phase flow through the porous CL and the fibrous GDL in a PEFC. Details can be found in [36]. Figure 5 displays the steady state invading liquid water fronts corresponding to increasing capillary pressures from the primary drainage simulation in the reconstructed CL microstructure characterized by slightly hydrophobic wetting characteristics with a static contact angle of 100°. At lower capillary pressures, the liquid water saturation front exhibits finger like pattern, similar to the displacement pattern observed typically in the capillary fingering regime. The displacing liquid water phase penetrates into the body of the resident wetting phase (i.e., air) in the shape of fingers owing to the surface tension driven capillary force. However, at high saturation levels, the invading nonwetting phase tends to exhibit a somewhat flat advancing front. This observation, as highlighted in Figure 5(b), indicates that with increasing capillary pressure, even at very low capillary number (Ca), several penetrating saturation fronts tend to merge and form a stable front. The invasion pattern transitions from the capillary fingering regime to the stable displacement regime and potentially lies in the transition zone in between. In an operating fuel cell, the resulting liquid water displacement pattern pertaining to the underlying pore-morphology and wetting characteristics would play a vital role in the transport of the liquid water and hence the overall flooding behavior.
Advancing liquid water front with increasing capillary pressure through the initially air-saturated reconstructed CL microstructure from the primary drainage simulation.

Figure 6 shows the liquid water distribution as well as the invasion pattern from the primary drainage simulation with increasing capillary pressure in the initially air-saturated reconstructed carbon paper GDL characterized by hydrophobic wetting characteristics with a static contact angle of 140°. The reconstructed GDL structure used in the two-phase simulation consists of 100 × 100 × 100 lattice points in order to manage the computational overhead to a reasonable level. Physically, this scenario corresponds to the transport of liquid water generated from the electrochemical reaction in a hydrophobic CL into the otherwise air-occupied GDL in an operating fuel cell. At the initially very low capillary pressure, the invading front overcomes the barrier pressure only at some preferential locations depending upon the pore size along with the emergence of droplets owing to strong hydrophobicity. As the capillary pressure increases, several liquid water fronts start to penetrate into the air occupied domain. Further increase in capillary pressure exhibits growth of droplets at two invasion fronts, followed by the coalescence of the drops and collapsing into a single front. This newly formed front then invades into the less tortuous in-plane direction. Additionally, emergence of tiny droplets and subsequent growth can be observed in the constricted pores in the vicinity of the inlet region primarily due to strong wall adhesion forces from interactions with highly hydrophobic fibers with the increasing capillary pressure. One of the several invading fronts finally reaches the air reservoir, physically the GDL/channel interface, at a preferential location corresponding to the capillary pressure and is also referred to as the bubble point. It is important to note that the mesoscopic LB simulations provide fundamental insight into the pore-scale liquid water transport through different GDL structures and would likely enable novel GDL design with better water removal and flooding mitigation.

Advancing liquid water front with increasing capillary pressure through the initially air-saturated reconstructed GDL microstructure from the primary drainage simulation.
4.3. Electroosmosis in Homogeneously Charged Micro- and Nanoscale Porous Media
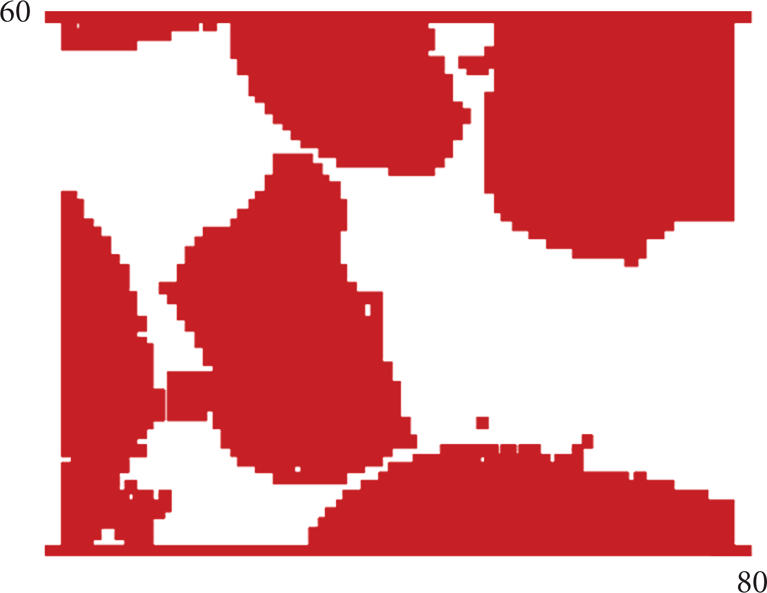
In this section, we briefly present some simulation results on electroosmotic flows (EOFs) in charged micro porous media using the lattice Poisson-Boltzmann method (LPBM), with geometry effects, solution and surface charge effects considered. More details can be found in [35]. We focus on a cubic system of which each side is 1 micron long. A 60 × 60 × 60 uniform grid is used. We change microstructure geometries of porous media by varying the porosity ε from 0.1 to 0.9. The average characteristic length of particles varies from 20 to 150 nm. Figure 7 shows Schematics of the generated porous structures for porosity 0.3 and 0.6. The bulk ionic concentration n
∞
varies from 10−6 to 10−3 M and the surface zeta potential from 0 to −100 mV. The other properties and parameters used in this work are the fluid density ρ = 999.9 kg/m3, the dielectric constant
Schematics of the generated porous structures on 60 × 60 × 60 grid systems. The white is solid particles and the dark is fluid: (a) porosity = 0.6, (b) porosity = 0.3.
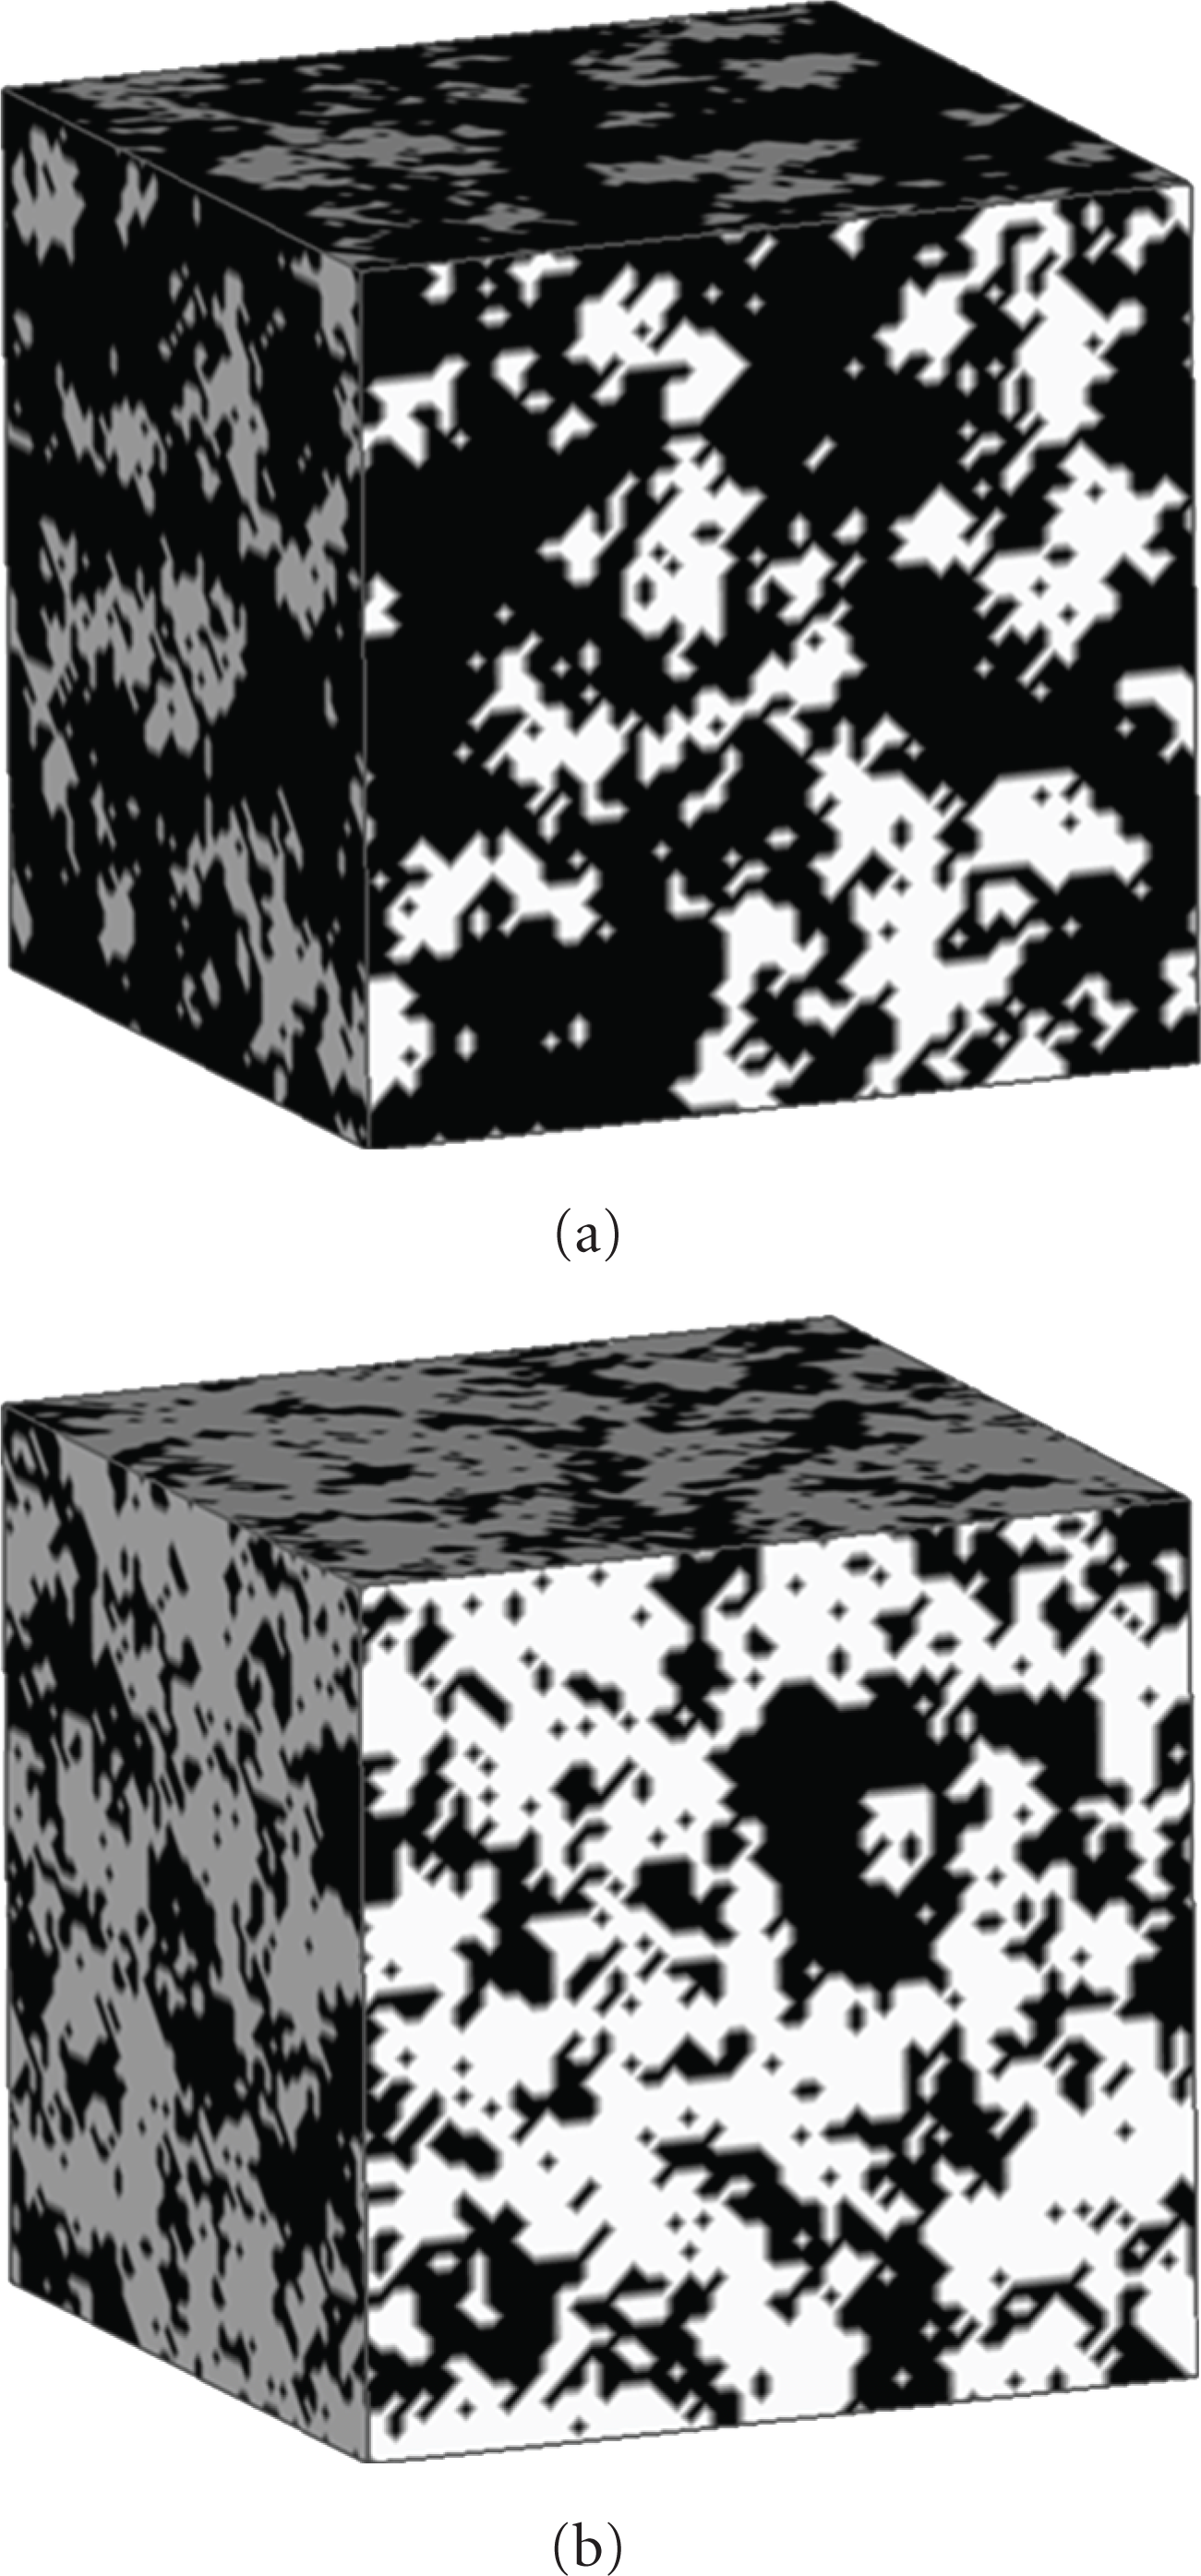
First, the geometry effects on the electroosmotic permeability in micro porous media are investigated by changing volume fraction and particle size (or number density) of the solid phase. We define the electroosmotic permeability, κ e , as

where
Predicted electroosmotic permeabilities for various porosities of porous media at c∞ = 10−4 M, ζ = −50 mV, E = 1 × 10⁴ V/m.
Figure 9 shows the predicted electroosmotic permeability versus the bulk ionic concentration of the electrolyte solution. We used ε = 0.38. The electroosmotic permeability κ e increase monotonically with the bulk ionic concentration c ∞ as c ∞ varies from 10−6 to 10−3 M. This result can be explained by the undeveloped electrical potential distributions in narrow channels, whose similar results can be found in [37, Figure 2] and [38, Figures 1 and 2]. When c ∞ is lower than 10−4 M, the electroosmotic permeability is nearly proportional to the bulk ionic concentration. When c ∞ is higher, the increasing rate becomes a little smaller.

The electroosmotic permeability changing with the bulk ionic concentration for ε = 0.38, ζ = −50 mV, and E = 1 × 10⁴ V/m.
Zeta potential on solid surfaces of porous media affects EOF permeability directly. Simple proportional relationships have been obtained between the electroosmotic permeability and the zeta potential for electrical transports in soils and in polymer composites recently based on the boundary-layer theory. Here we analyze such effects using our numerical methods.
Figure 10 shows the calculated electroosmotic permeability versus the zeta potential on solid surfaces of porous media. All surfaces are homogeneously charged with a same value of ζ. The other parameters used are: c∞ = 10−4 M, c d = 0.1 and ε = 0.38. The zeta potential ζ changes from 0 to 90 mV. It shows that the proportionally linear relationship between electroosmotic permeability and zeta potential is accurate only when ζ is very small (<30 mV). The permeability increases much sharper when the zeta potential ζ is larger than 40 mV.

The electroosmotic permeability versus the zeta potential for ε = 0.38, c∞ = 10−4 M, and E = 1 × 10⁴ V/m.
5. Conclusions
We have presented our recent work on mesoscopic modeling of multiphysicochemical processes in porous media, based on the LBM. For the problem of injecting CO2 saturated brine into a limestone rock, it is shown that the LBM is able to provide detailed information on fluid velocity, solute concentration, mineral composition, and reaction rates, as well as the evolution of the porous media geometry, and therefore can shed some light on the fundamental physics occurring at the pore scale for reactive transport involved in geologic CO2 sequestration. For two-phase behavior and flooding phenomena in PEFCs, the LBM is a powerful tool to study the influence of the pore structure and surface wettability on liquid water transport and interfacial dynamics in the PEFC catalyst layer and gas diffusion layer. Particularly, the two-phase regime transition phenomenon in the capillary dominated transport in the CL and the influence of the mixed wetting characteristics on the flooding dynamics in the GDL are demonstrated. For electroosmotic flows in charged porous media, the strongly nonlinear governing equations of electroosmosis in three-dimensional porous media are solved using the LPBM. The effects of pore structure, bulk ionic concentration, and the surface charge on electroosmotic permeability are carefully investigated. It is concluded that the LBM is a powerful numerical tool to simulate multiphysicochemical processes in porous media at the pore-scale.
Footnotes
Acknowledgment
This article is based on research project supported by the National Science Foundation under Grant no. CHE-0431328 and the U.S. Department of Energy, Biological and Environmental Research (BER), and by LDRD projects 20070760PRD4 and 20080727PRD2 sponsored by Los Alamos National Laboratory.