
Abstract
Taking into account the complexity and cost of a direct experimental approach, the recourse to a tool of simulation, which can also predict inaccessible information by measurement, offers an effective and fast alternative to apprehend the problem of pollutant emissions from internal combustion engines. An analytical model based on detailed chemical kinetics employed to calculate the pollutant emissions of a marine diesel engine gave satisfactory results, in general, compared to experimentally measured results. Especially the NO emission values are found to be higher than the limiting values tolerated by the International Maritime Organization (IMO). Thus, this study is undertaken in order to reduce these emissions to the maximum level. The reduction of pollutant emissions is apprehended with ammonia injection.
1. Introduction
The energies produced by the diesel engines of strong power are largely used in marine propulsion because of their favorable reliability and their significant output. However, the increasingly constraining legislations, aimed at limiting the pollutant emissions from the exhaust gas produced by these engines, tend to call into question their supremacy [1, 2].
Most bibliographical studies on the various approaches to estimate the rate of emissions cover many established models suchas
the direct models that lead to digital resolution of Navier Stokes, energy conservation, and phenomenological species equations that have given rise to codes: CONCHAS, KIVA, and KIVA II,
the phenomenological models that simulate combustion, using formulations based on different physical and chemical phenomena that were experimentally observed and described,
the empirical models establishing kinetics patterns reduced to a dozen variables necessary for calculations of turbulent flames equations which lead to calculate the formation of pollutants.
Many other studies were undertaken, on the experimental level as well as on the analytical level, in order to study the mechanisms which govern the formation of the various produced pollutants. The study of combustion chemistry enjoys an undeniable anticipation, and has now acquired a certain maturity [3–5].
The analysis of the pollutant emissions and their reduction in the exhaust gas of the semirapid turbocharged marine diesel engine constitutes the principal objective of this study.
The various simulations carried out in this work are based on the computer code marketed by Reaction Design, the CHEMKIN package, which is developed by the Sandia National Laboratories.
Comparisons of the numerical predictions with the experimental results carried out on a real unit at use aboard a car ferry ship made it possible to analyze the validity of the numerical results.
2. Experimental Study
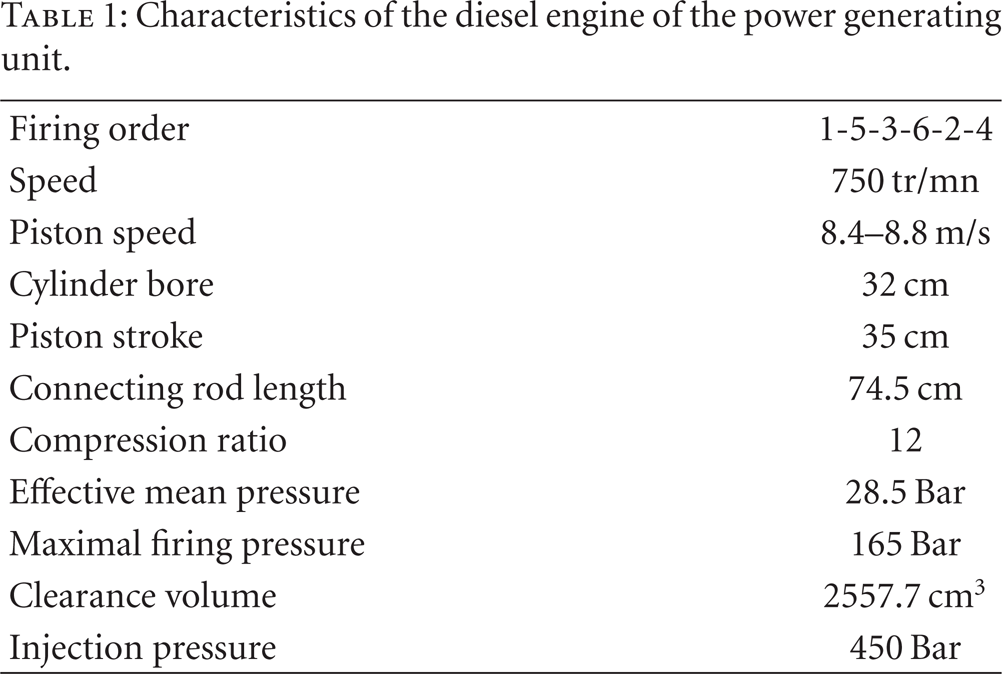
The unit selected for measurements is a power generating unit in use on a car ferry ship during its docking in a harbor. The diesel engine unit is a WARTSILA NSD type 6R32 LNE having characteristics given in Table 1 with a nominal power of 2460 kW. The measured values taken in exhaust gas were carried out using a Testo350 (Precision +/ − 5% mV) gas analyzer, which made it possible to post with precision and in real-time the percentage by volume of oxygen (O2), percentage by volume of carbon dioxide (CO2), nitric oxide (NO), sulfur dioxide (SO2), temperature, and pressure.
Characteristics of the diesel engine of the power generating unit.
The measurements were carried out for various powers: 640, 900, 1370, and 1470 kW.
To determine the emitted quantities in grams per cycle per cylinder (g/cyc/cyl) and in (g/kWh), it is necessary to deduce the volume

where the volume is calculated from the ideal gas equation of state. The mass conservation law enables us to deduce the mass with the admission condition

The volume of exhaust gas at the measurement point is then
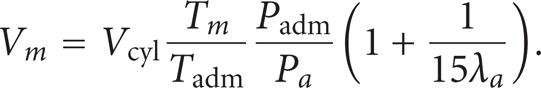
Figure 1 presents the preliminary experimental results obtained on the chosen unit.

Parameters measured with gas analyzers.
As a consequence of the increase in power we note the following.
A greater quantity of exhaust gas increasing the mode of the turbocharger and consequently the pressure of air of overfeeding.
An increase in overfeeding air temperature.
A decrease in percentage by volume of O2 with an increase in percentage by volume of CO2.
An increase in NO emission.
An increase in SO2 emission.
According to these notes, we can conclude that there is an improvement of combustion for the passage from the low power to the semimaximum power of the generating unit.
The cycle temperature increases causing a higher formation of thermal NO. In addition, the admitted quantity of air is larger and consequently supports the formation of NO in greater quantity. This last is higher than the allowed NO emission by the IMO.
This initiated our study to reduce the NO emissions of marine diesel engines.
3. Numerical Study
It is often difficult to carry out directly a parametric study on a real unit, since the study of combustion is generally complex with the simultaneous presence of several physical and chemical phenomena that vary from one model to another according to the aero thermo-chemical conditions of the application. For that, it is necessary to be able, mathematically, to describe the aero thermo-chemical phenomena that control the various processes present in a real combustion chamber.
In spite of the high capacity of computers, it is still impossible, in combustion, to treat at the same time complex kinetics and industrial turbulent flow conditions. For this reason, one uses the modelling based on ideal chemical reactors with simplified flows. These reactors are simulated by using several hundreds of reactions [5–7].
Due to the high turbulence in the combustion chamber induced by the admission of overfeeding air through deflectors and the corrugated shape of the piston (with prechamber) in addition to the injection system (high pressure: 450 to 600 Bar) [8, 9] that allows a good distribution of the fuel jet in the combustion chamber [10–13], one can admit that the reagents mixture is homogeneous, and we assume that the combustion process can be modelled by a perfectly stirred reactor (PSR) [14, 15].
In a PSR, the mixing in the reactor chamber is supposed to be intense and, thus, it is assumed that the temperature and composition in the reactor are uniform through the reactor volume.
A description of the process occurring within the PSR is obtained by relating the conservation of mass and energy to the generation of chemical species within the reactor volume [5, 16].
The species conservation equation is

The energy conservation equation is

The nominal residence time is
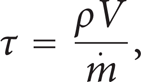
where the mass density ρ is calculated from the ideal gas equation of state

From this set of
The analogous time-dependent equations for mass conservation of each species are

and the time-dependent energy conservation equation is

The net chemical production rate

The simulation of the internal combustion with high-turbulent conditions of an engine is carried out by the CHEMKIN code using 450 elementary reaction mechanisms between 77 species including sulfur (case of the fuel oil). Specifically, the internal combustion engine model (ICEM) has been used to simulate the temporal behavior of the engine combustion [16].
The process of ignition of fuel used by the code is governed by its temperature of autoignition.
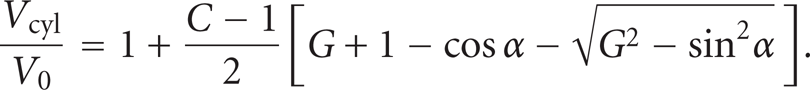
The relation of volume swept by the piston divided by clearance volume is as follows:
The convective heat transfer coefficient between the gas and cylinder wall obtained from the generalized heat transfer correlation in terms of a Nusselt number is
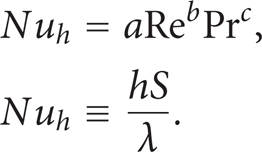
The heat loss is calculated at each step in time according to

The Woschni correlation [16] allows a more accurate estimation of the average cylinder gas speed used in the definition of the Reynolds number for the heat-transfer correlation.
The velocity used in the Reynolds number definition in (14) is an estimation of the average cylinder gas velocity, Z, instead of the mean piston speed

To obtain the average cylinder gas velocity, Woschni proposed a correlation that relates the gas velocity to the mean piston speed and to the pressure rise due to combustion:

The chosen composition of species weight of the fuel introduced in the code is composed of 86.6% in mass of carbon, 10.9% in mass of hydrogen, and 2.5% in mass of sulfur.
The numerical results are established according to pressure, which varies from 1.7 to 2.35 Bar, an overfeeding air temperature, which varies from 317 to 322 K, and an equivalence ratio, which varies from 0.6 to 0.8, corresponding to the values measured with the powers which vary from 900 to 1470 kW and for an ambient temperature of 306 K.
The first objective of the study was to analyze the influence of the equivalence ratio on the course of the combustion process and on the pollutant emissions related to the real engine conditions (overfeeding air temperature, overfeeding air pressure, engine speed, etc.).
The numerical conversion of the results molar fraction (MF) into grams
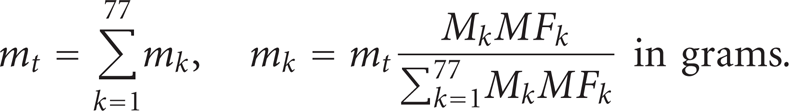
Figure 2 illustrates the influence of the equivalence ratio on the progress of the combustion and the pollutant emissions according to the crank rotation angle for the same running condition. The observed jump of the parameters corresponds to the beginning of the combustion which starts, with an advance, with regard to the piston top dead center (360°) and with a delay of ignition which varies with the equivalence ratio.

Evolutions of the temperature, the pressure, and the pollutant emissions in the combustion chamber.
For a reduction in the equivalence ratio (from R=0.8 to R=0.6), we note that the excess of total air leads to a dilution of exhaust gas which decreases its temperature and pressure, an increase in the ignition delay, a decrease in the total time of combustion, a considerable increase in NO as of N O2 and S O3 emissions, a considerable decrease in H2 O and S O2 C O2 emissions.
We conclude that there is an improvement in the combustion process.
The considerable increase in the excess of air and consequently that of atmospheric nitrogen support the formation of N O x in quantity to the exhaust gas which increases.
For a poor mixture, the fuel jet of a smaller quantity of fuel undergoes a faster oxidation, which has, as a consequence, an increase in the time of ignition.
The different values expressed in g/cycle/cylinder and g/kWh are given by considering a low calorific value of 42.000 kJ/Kg and a total output of 0.4.
The content of C O x is made up mainly of 99.9% to C O2.
The content of N O x is made up mainly of 97.5% in NO and 2.5% in N O2 in the poor mixture; consequently, the N O x emission undergoes an increase since it follows the same evolution of the majority species which is the NO.
The content of S O x is made up mainly of 95% of S O2 and 5% of S O3 in the poor mixture; consequently, the emission of S O x undergoes a small decrease.
Figures 3, 4, and5 show comparisons between computed and measured C O2 -, NO-, and S O2 -emitted quantities in the exhaust gas as a function of engine power.

Evolution of numerical and experimental results for the C O2 emission.

Evolution of numerical and experimental results for the NO emission.
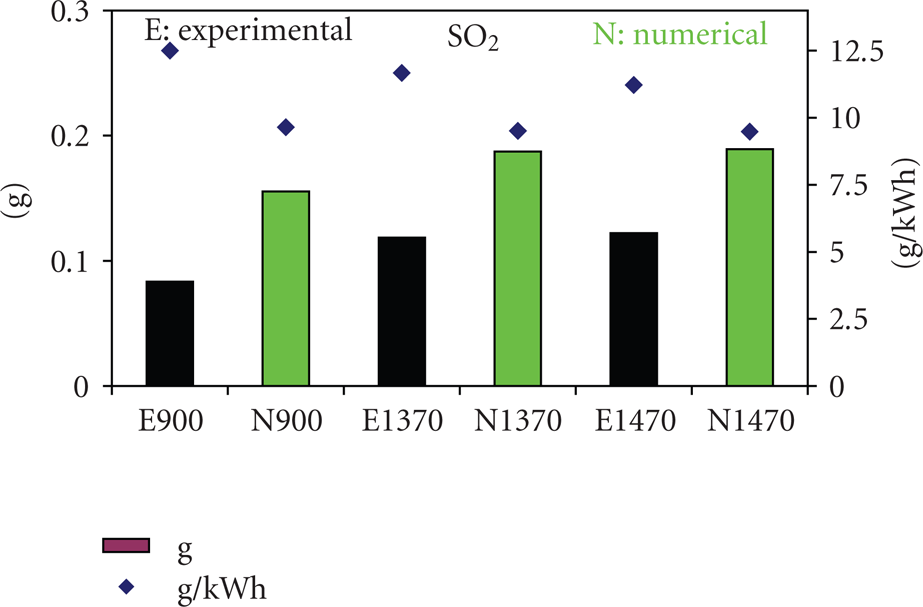
Evolution of numerical and experimental results for the S O2 emission.
Relatively good agreements are observed especially for emission expressed in g/kWh. One can conclude that the model of the adopted calculation allows qualitative and quantitative results, that are, in general, satisfactory. But it should be well noted that the precision of the results depends on the adequate determination of the precision of measures and the assumption adopted in the model.
Figure 6 shows the IMO [17] curve for the limiting N O x emissions according to the nominal speed of the engine. For a speed of 750 rpm, the N O x is limited to a value of 12.2 g/kWh.

Curve IMO limiting the N O x emissions according to the nominal speed of the engines [14].
All the values of NO (g/kWh) in Figure 1(g), and for the various powers, are higher than the limiting value tolerated by the IMO.
4. Study of Ammonia Injection
Therefore, a subsequent study has been done to reduce this NO emission [18–21] by ammonia injection [22]. The objective of this study is to analyze the influence of ammonia injection in the combustion chamber of the diesel engine on the different pollutant emissions.
The study of influence of ammonia injection is that corresponding to the measured maximum power (1470 kW) having a temperature of admission air of T a = 322 K and a pressure of admission air of P a = 2.35 Bar.
The numerical results are established according to N H3 mass in reagent which varies from 0 to 2.18 g, and for air mass which varies from 74.38 to 70.7 g.
The volume of N H3 mixed with the admission air is
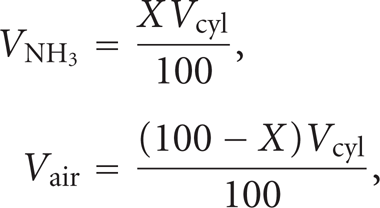
where x is the percentage in volume of N H3 mixed with admission air.
Figure 7 illustrates the influence of ammonia injection on the course of combustion and the pollutant emissions. It represents the variations of the pressure, the temperature, and the pollutant emissions in the cylinder as a function of the crank rotation angle with and without the ammonia injection. A substantial reduction in NO and N O2 emissions is noticed, while the C O2 and S O2 emissions remain constant.

Evolutions of the temperature, the pressure, and the pollutant emissions.
Figure 8 illustrates the influence of ammonia injection on the average combustion pollutants emissions expressed in g/cyc/cyl and g/kWh. A considerable decrease in NO and N O2 emissions is now way down and meets the IMO index requirement. A considerable increase in H2 O quantity isobserved.

Evolutions of pollutant emissions.
The N2 quantity in admission air undergoes a decrease and the N2 quantity in exhaust gas remains constant with a percentage in volume of N H3 which varies from 0 to 0.5. For the other percentage, we note a considerable increase in N2 between admissions and exhaust gas quantity.
We can conclude that in combustion process, the NO and N O2 were transformed to H2 O and N2 by these two following reactions:

For the average of 1% in volume of ammonia mixed with the admission air, one notes a reduction of NO on average of 11.7% g/kWh and a reduction of N O2 on average of 21% g/kWh, consequently, the N O x emission (Figure 9) undergoesa reduction on average of 12% g/kWh.

N O x composition.
5. Conclusion
To address problems of global air pollution due to the pollutant emission from fuel oil engine combustion, it is necessary to understand the mechanisms by which pollutants are produced in combustion processes. In the present work, an experimental and numerical study is carried out on a unit of real use aboard a car ferry ship. A numerical model based on a detailed chemical kinetics scheme is used to calculate the emissions of C O2, NO, and S O2 in an internal combustion engine model for the same characteristics of the real unit. In general, the experimental and numerical results featured good agreements especially at high power and for excess air. For the study of the reduction of pollutant emissions of the diesel engine by the use of ammonia injection, substantial decrease in NO was observed which made the unit meet the IMO regulations.