
Abstract
The main focus of this study is to verify the possibility to monitor diamond mill wear by measuring the cutting force during stone machining. An ornamental stone was machined on an NC machining centre, retrofitted with a 3-axis dynamometer and data acquisition systems, to investigate the effects of variations in machining parameters. The sensor data include cutting force measurements, further divided into measurable components, such as x, y, and z. Those components were analysed to determine the sensory features that best correlate with diamond mill wear. Tool wear and machining parameters appeared significantly influencing cutting force signals. This suggests that even under the varying cutting conditions involving different values of process parameters, the identified cutting force feature can be used for the reliable and accurate control of diamond mill wear during stone cutting operations.
1. Introduction
The intense international market competition in stone field has driven the attention of manufacturers on the automation of manufacturing systems as means for increasing the productivity and improving the quality of products.
Monitoring of the stone cutting processes plays a very important role to avoid down time of the machine, or to prevent unwanted conditions such as excessive tool wear or breakage. A recent survey of literature in the field of tool condition monitoring stresses the fact that the choice of sensors and the signal interpretation are critical to establish a reliable tool condition monitoring system [1]. This is due to the fact that manufacturing processes are difficult to model mathematically. Sensors supply the information that we need to describe the process.
A vast amount of literature exists in the field of tool wear monitoring in metal cutting environment; it suggests that a variety of process parameters can be used to predict the cutting tool state [1]. Techniques for online wear monitoring can be grouped into two main categories: direct sensing and indirect sensing techniques. When direct methods of wear measurements have been attempted, the majority of methods have been indirect. Direct methods are less beneficial because the cutting area is largely inaccessible, and therefore, online monitoring cannot be carried out while the tool is engaged in in-process cutting. These methods include touch trigger probes, optical, radioactive, proximity sensors, and electrical resistance measurement techniques. Indirect methods take measurements while the tool is actively engaged, since it involves recording a variable that can be correlated to tool wear. Commonly used methods include acoustic emission [2], tool temperature, cutting force [3, 4], vibration signature [5–10], and miscellaneous methods, such as ultrasonic and optical measurements, workpiece surface finish quality [5], workpiece dimensions, stress/strain analysis, and spindle motor current. The cutting conditions (speed, feed-rate, and depth of cut) are known to affect the sensor signals and a range of methods have been suggested for separating the effects of these conditions from those of wear on the measured parameter.
Methods for correlating the measured process parameters to tool wear, breakage, or chipping fall primarily into three categories [11]. The first class consists of methods that can be viewed as heuristic-based rules with a priori knowledge only of the process parameters, such as mathematical modelling and adaptive observers. The second category of methods is that requiring formal knowledge of the process and can be grouped together as analytical-based models such as time series analysis and fast Fourier transformation (FFT). The last category is one of the example-based models with inductive learning capabilities such as pattern recognition, decision surfaces, mapping techniques, clustering, and artificial intelligence models (neural networks, genetic algorithms, and knowledge-based systems) [12].
The present work shows a method for tool condition monitoring of a diamond mill used in stone cutting. It focuses on synthetic diamond tool which is a fairly expensive tool used commonly in the cutting of ornamental stone. A work exists on tool condition monitoring of this kind of tool in [13]. It implements a monitoring system utilising simultaneous vibration and strain measurements on the tool tip for the wear of synthetic diamond tool which are specifically used for the manufacturing of aluminium pistons.
This work presents an approach to investigate the correlation of tool wear and cutting force. The idea is to establish tool wear progression by monitoring cutting force during stone machining. It investigates the feasibility of using the cutting force signatures to monitor tool wear. The characteristics of the cutting force signatures were examined in time domain. The identification of common sensory features that best correlate tool wear condition with tool wear was adequately studied. To address the problem, stone cutting on Coreno Perlato Royal by an NC machining centre retrofitted with force sensors and data acquisition systems was conducted to find the relationship among force signal and tool wear. Different settings of cutting parameters were intended to simulate diverse processes. Each measurement was further divided into components: x, y, and z cutting forces (F x , F y , and F z ). Those components were processed for time domain features. Using the statistical analysis techniques, some components of sensory data were found to be the most influential factors to tool wear. Therefore, the identified sensory features can be used for the control of diamond mill wear in stone cutting more reliably and accurately under varying cutting conditions.
The objectives of this paper are (1) to define what is the wear of a diamond mill, (2) to present the method to monitor the tool condition during stone cutting, and finally, (3) to validate the proposed approach by means of experiments.
2. Wear of a Diamond Mill during Stone Cutting
Stone cutting by means of diamond tools consists in wearing away its mineral constituents by passing hard grits over the machined surface. A diamond mill is composed of a support, abrasive grits, and a bond. The support is that part of the tool which the abrasive grits are fixed to; it gives the right shape to the tool; it transmits the kinetic energy from the machine axes to the abrasive grits; it absorbs the stresses generated during machining. The abrasive grits constitute the cut edges; they are characterised by a granulometry, a shape, and a concentration. The bond is a metallic alloy blocking the abrasive on the tool support in order to make the machining possible. It assures both cutting ability and long tool life. A diamond mill for stone cutting is electroplated, that is, it is constituted by a layer of diamond grits fixed to the mill support by the bond.
Many works in literature assume as tool failure mode the flank wear, the fracture, the crater wear, and the plastic deformation [13]. Flank and crater wear are generally accepted as the normal tool failure modes. In the case of synthetic diamond tools used for this study, the flank wear did not play a very important role.
The wear of an electroplated diamond mill is the result of the progressive consumption of diamond grits [14]. It is characterised by a sequence of steps, as shown inFigure 1 [15]. Firstly, tool surface is characterised by whole crystals that are diamond grits having a large height of protrusion and a minimum surface damage. Once the workpiece is contacted, the grit is rounded off so much that a plateau is generated on the grit top. It generates mechanical friction and thermic effects that polish the diamond grits. A high percentage of polished grits makes the surface of the tool so vitreous, to cause a less efficient cutting ability. The intermittent contact with the workpiece, caused by the tool rotation, leads to a cyclic load on the diamond grit which deteriorates the grit ability to contrast the cutting forces, and finally, the grit breakage. This phenomenon is enlarged by the heterogeneous nature of the workpiece and by the machining vibrations. The diamond grits result is characterized by microfractures and microcracks that increase the number of cut edges on grit surface, even if they reduce the penetration depth. Wear progression leads to a completely fragmentary particle till the tool looses its cutting performances.

Wear of an electroplated diamond mill: (a) protruded grit, (b) flattened grit (c) microfractured grit, and (d) macrofractured grit.
The progression of diamond tool wear is carried out to consume the diamond. The microgeometric effect is both the progressive rounding and breakage of the diamond grits that are placed in a unique layer on mill surface. In previous works, we have presented a test protocol [16] to be implemented in order to measure the microgeometric parameters [17] that characterise the wear of a diamond mill. This protocol implies the need to observe the tool, once dismounted by the mandrel, after the cut. The present paper overcomes the need to dismount the tool by the mandrel by implementing an online measurement of diamond mill wear.
3. Monitoring Strategy
3.1. Experimental Setup
In stone machining, the formulation of accurate mathematical models is very difficult, hence in most cases, empirical equations are obtained by performing statistical analysis or through the training of neural network models to fit the experimental data. To collect the data, a designed experiment is performed using predetermined values of machining parameters. Even though empirical equations do not consider the underlying principles and mathematical relationships, empirical modelling does have advantages of accuracy and ease of formulation. Once noticeable, drawback of any empirical modelling is the rigidity that allows only limited variations in the machining conditions. That is, the cutting conditions must be carefully controlled to remain similar to those used in the cutting experiments. Development of empirical models often leads to a large number of trials and a considerable amount of time and effort, however, whenever variations occur, empirical models need to be refitted to maintain the accuracy. To avoid costly reproduction of cutting experiments under the diverse production environment, while satisfying the quality characteristics of the machined products, reliable and accurate means of tool condition monitoring and process control become necessary.
In this study, all machining experiments were carried out on an NC machining centre of Brembana Macchine. The experimental setup is shown in Figure 2. A diamond mill, commonly used to contour ornamental stone, was used, with a diameter and a height of 20 mm and 37.5 mm, respectively. The considered diamond mill has a diamond concentration of 4.77 diamonds/cm2 and a diamond grit size of 40/50 mesh. Its bond is constituted by 90% of nichel.

Experimental scheme.
The workpiece material was Coreno Perlato Royal marble. It mainly consists of Ca CO3 with inclusions of seaweed and fossils that produce light and dark spots appreciated from an aesthetic point of view. Its mechanical properties are shown in Table 1 in comparison with those of well-known white carrara marble.
Mechanical properties of Coreno Perlato Royal and white carrara marble.

Twenty diamond grits were identified on the surface of the new diamond mill and their protrusion height was measured by a Leica microscope. Then, the new tool was mounted on the mandrel of the CNC machining centre in order to execute a linear cut inside a slab of Coreno Perlato Royal of 20 mm thickness, as shown inFigure 3. The cutting force signal was acquired along the whole cut. Then, the wear of the mill was accelerated by carrying the tool to execute a series of cuts on a slab of a very abrasive stone, the Sardinian granite. Once reached a certain stage of wear, that was identified by measuring the protrusion height of the considered 20 diamond grits on mill surface, the mill was carried to execute a linear cut on the slab of Coreno Perlato Royal once again. This sequence was repeated for five times, since the diamond mill wear was monitored in 5 steps distributed along the whole mill life. The mill life corresponds to the time during which the mill shows cutting performances, that is, the grit passes from a whole crystal to a fragmentary particle. Three feed speed values u (200, 400, and 600 mm/min) and three cutting depth values p (0.1, 0.5, and 1 mm) were taken into account; they were chosen in order to reproduce the commonly used industrial range of process variables. The spindle speed was fixed to 3000 rotations per second. The experimental plan is shown in Table 2. The whole number of test was 135. The experimental cuts were performed in a random sequence, in order to reduce the effect of any possible systematic error. A Kistler three-component force dynamometer (type 9257BA) on which the stone slab was mounted sensed the dynamic cutting force components (F x , F y , and F z ), as shown in Figure 3. The signal acquired by the dynamometer was sampled at different frequencies and for different time intervals in order to set the acquisition parameters giving the whole information about force signal with the minimum time waste. The force signal along x, y, and z axes was periodic and 8000 acquisition points seem to be enough to keep the whole signal information. Therefore, the output of the dynamometer was fed into an A/D converter and sampled at 10 kHz by a PC. Each observation consisted of about 0.8 129-second time signal. The raw cutting force data were transformed into time domain.
Experimental plan.


Stone linear cuts.
3.2. Cutting Force Signal Analysis in The Time Domain
A monitoring strategy was adopted based on time-domain characteristics. Figures 4(a)–4(c), 5(a)–5(c), and 6(a)–6(c) show typical time domain signals monitored in the x (transverse to feed), y (feed), and Z (vertical) directions, respectively, at different time intervals inside tool life. Stone cutting was performed at a feed speed of 600 mm/min and at a depth of cut of 1 mm.
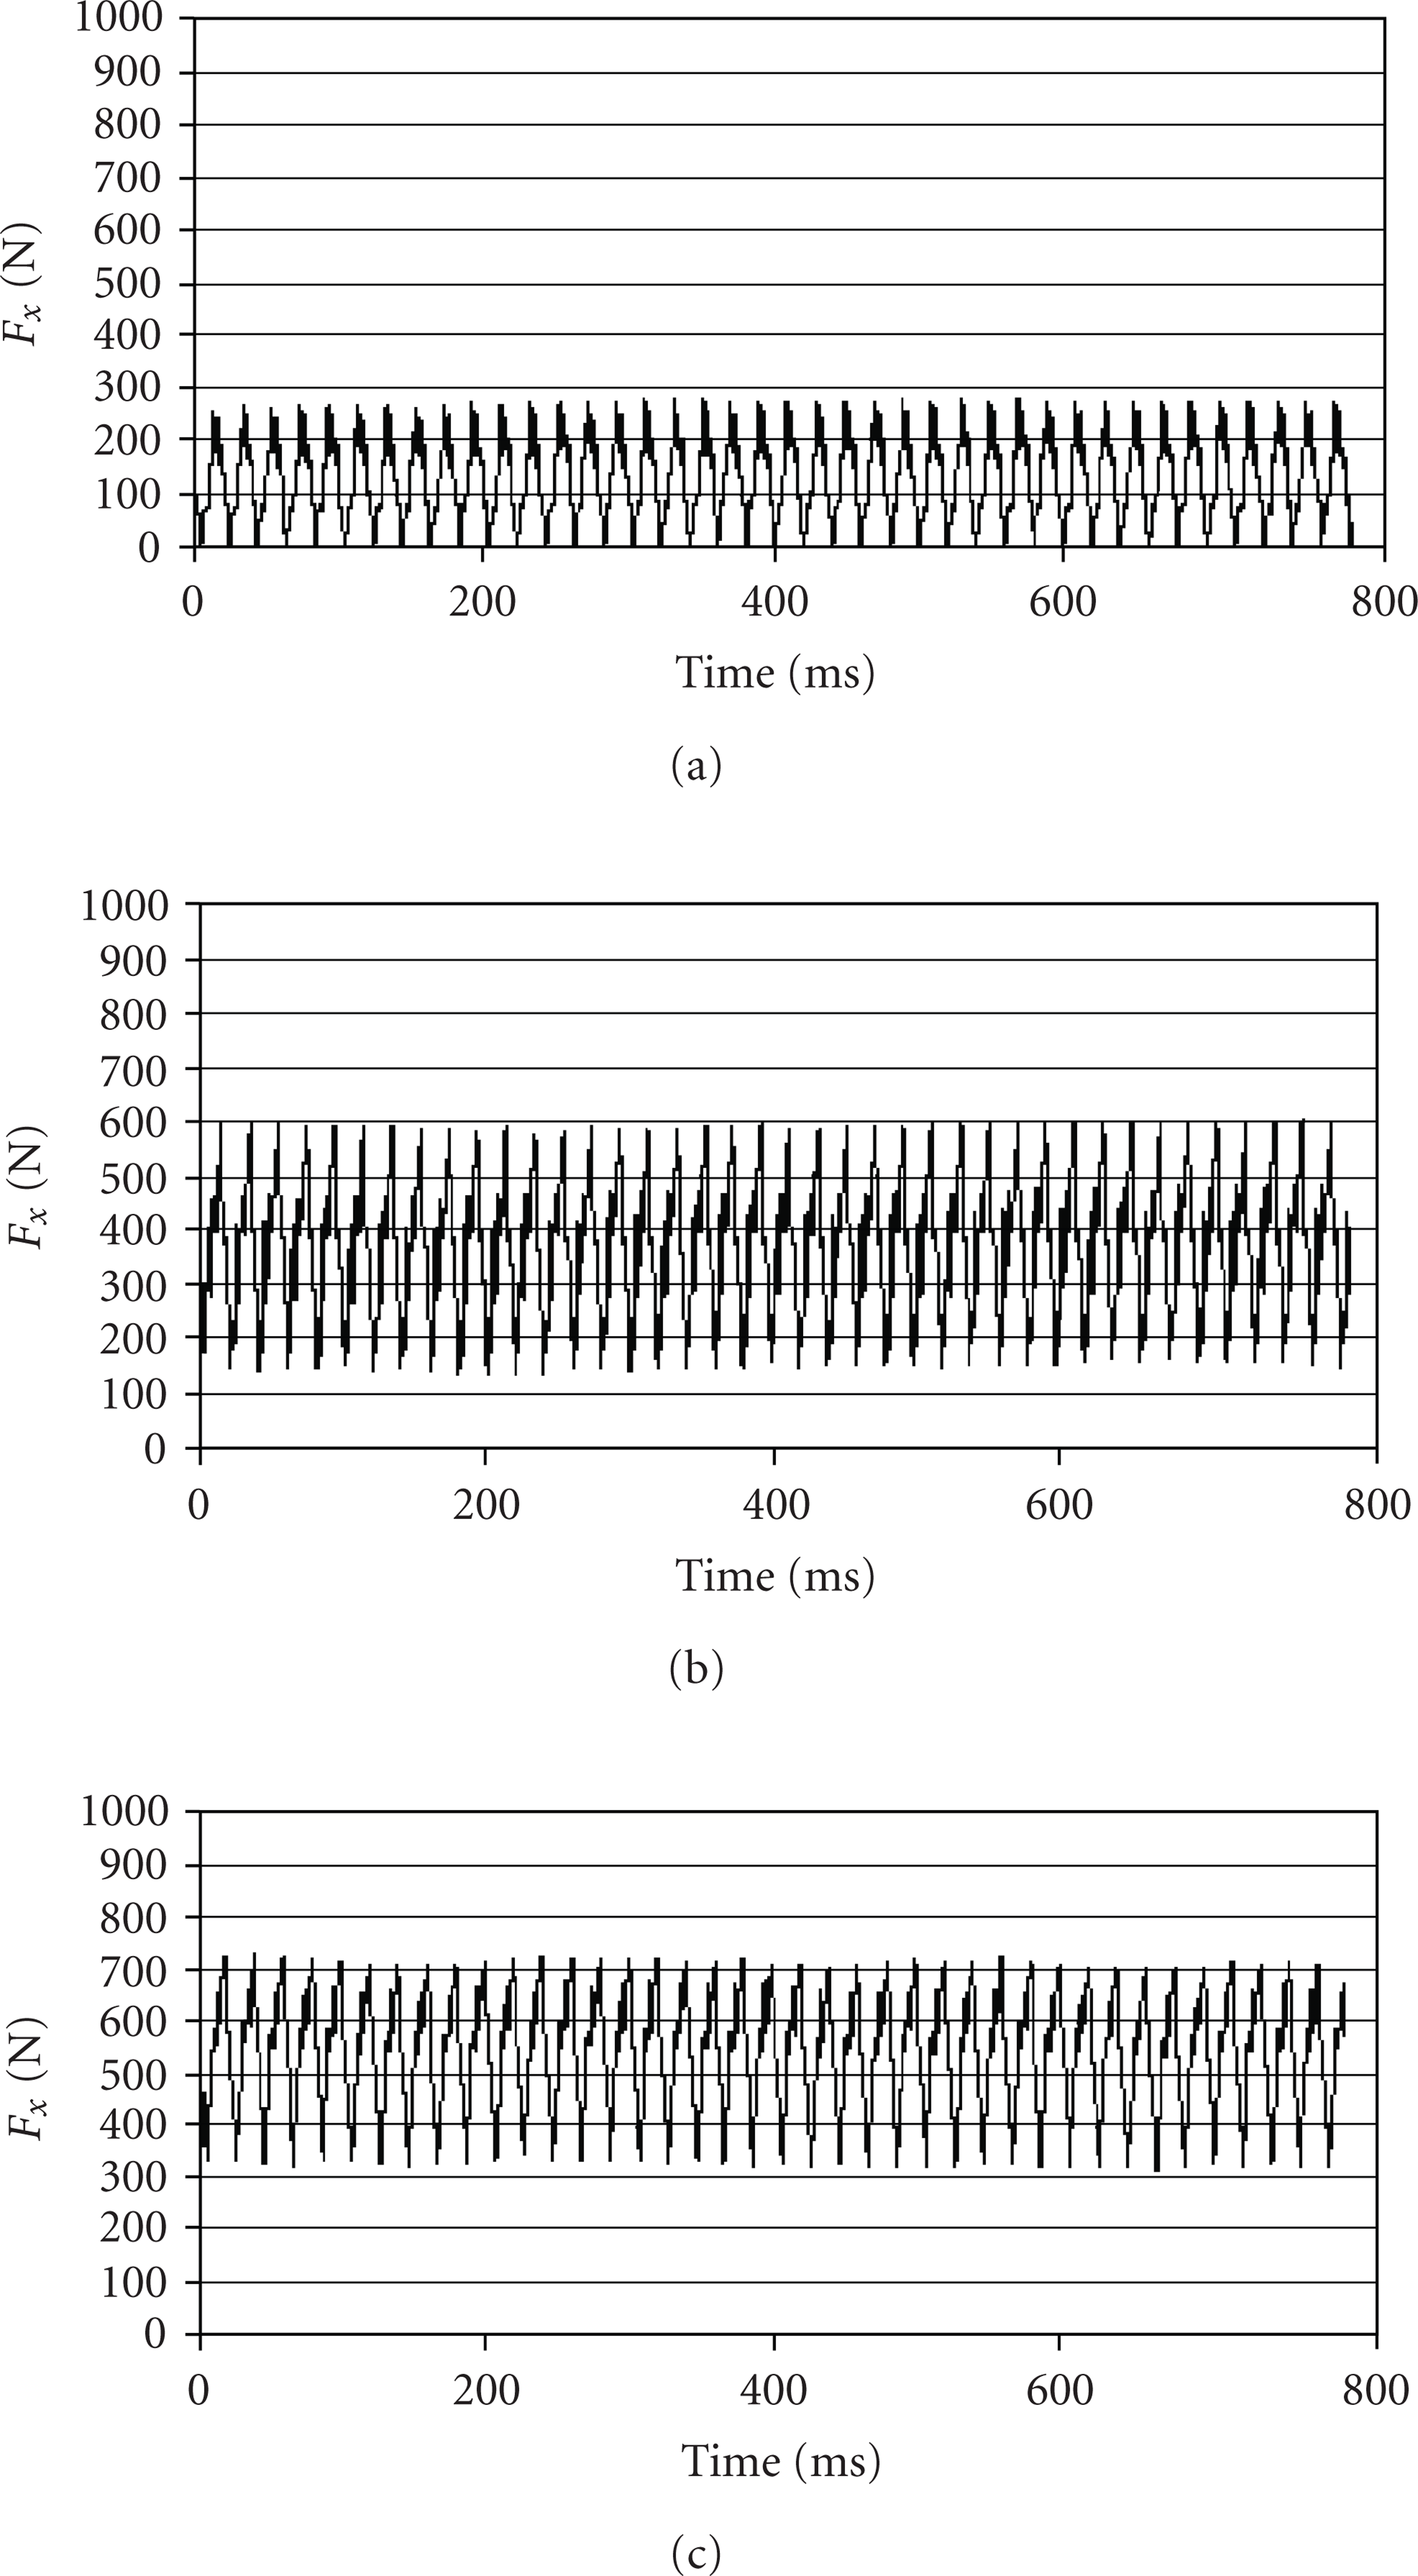
Time domain signal monitored in x direction: (a) at 1° wear stage, (b) at 3° wear stage, and (c) at 5° wear stage.
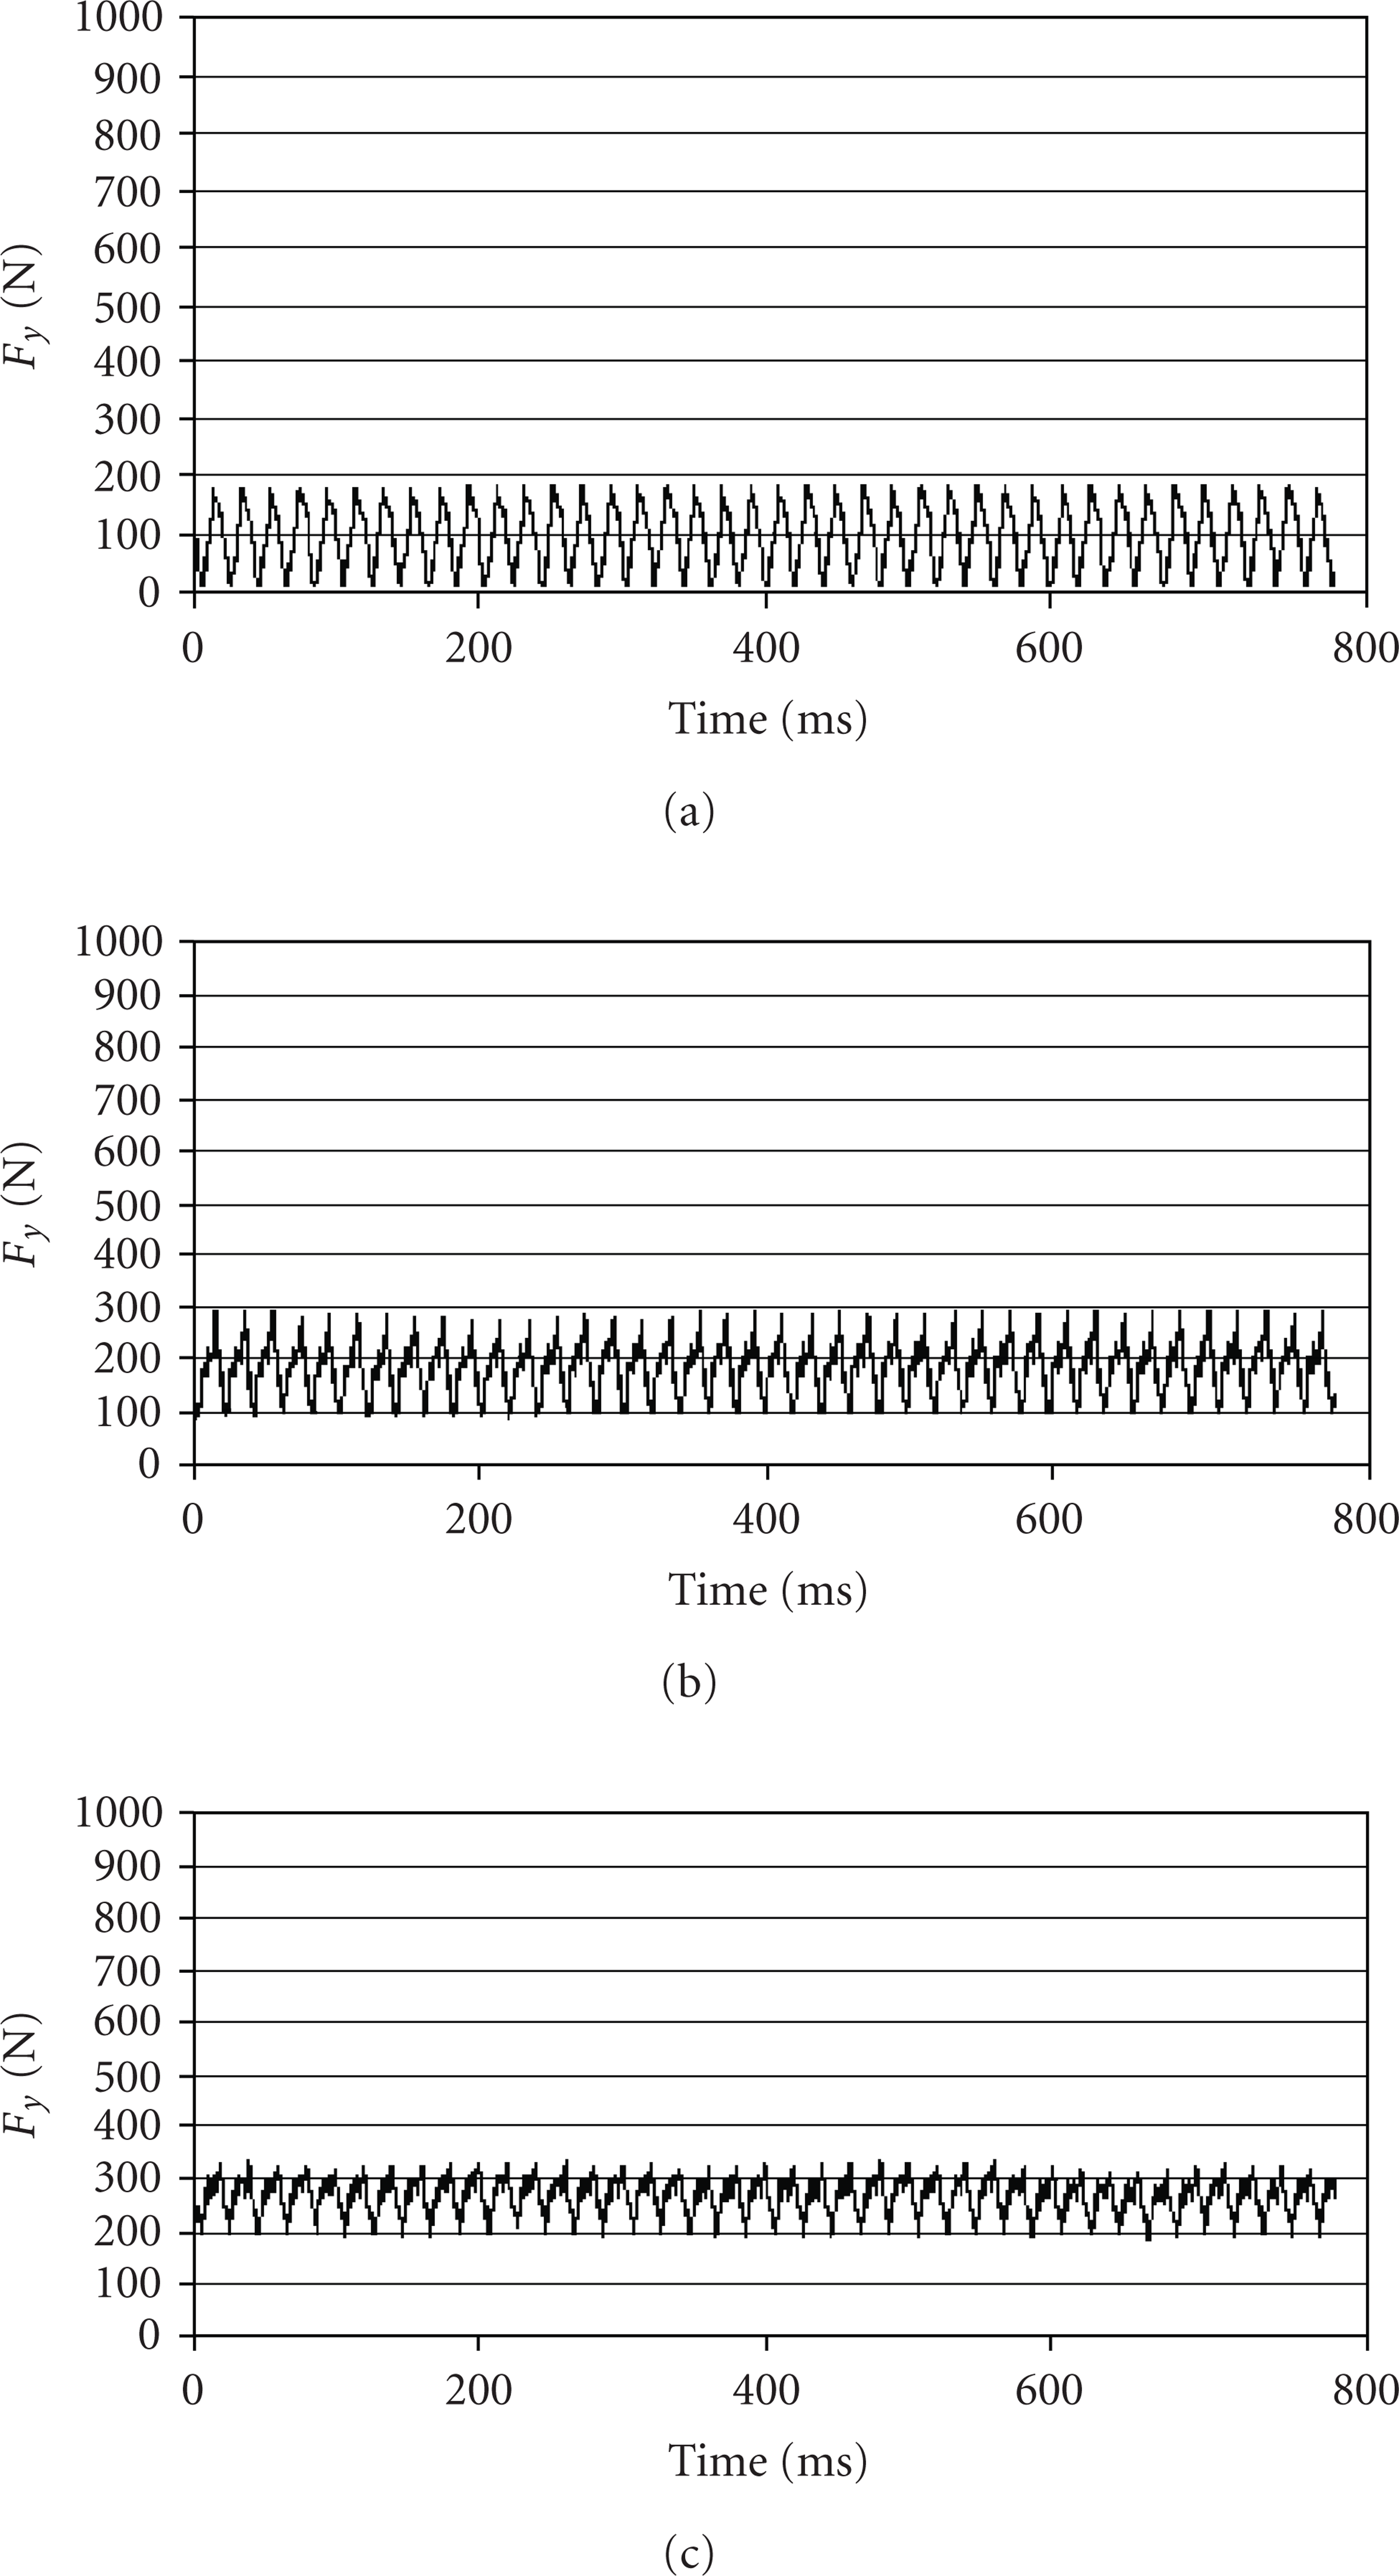
Time domain signal monitored in y direction: (a) at 1° wear stage, (b) at 3° wear stage, and (c) at 5° wear stage.

Time domain signal monitored in Z direction: (a) at 1° wear stage, (b) at 3° wear stage, and (c) at 5° wear stage.
Figures4 and 5 show that the force signals are periodic and regular. The waviness of the cutting force signals is due to the eccentricity of the tool. In fact, many further tests have been carried out at 70–80 Hz. They have shown that the main frequency of the signal is related to the spindle speed of the tool. The average and maximum values of F x and F y signals increase with the progress of mill wear. The minimum value of F x and F y signals is near to 0 when mill is new, this is due to the fact that the cut is interrupted. In fact, the diamond grits on mill surface protrude by bond with different heights; this means that only the higher grits engage stone for cutting. When a grit exits stone, it is possible that the following grits do not engage stone, since it does not protrude enough by bond, causing the force on stone to reduce to zero. However, the average value of the F z signal is equal to zero in each of the three considered cases, since the tool axis is perpendicular to the x-y plane, that is, a plane cut has been carried out. Therefore, F z results have not been investigated further.
After the signal was stored, a feature extraction program in Labview environment starts analysing the data. Previous studies have shown that some time-domain features can be indicative of tool wear for metal machining [1–4]. Therefore, the following time-domain features were extracted from each of the following parts: mean, root mean square, crest factor, variance, skewness, and kurtosis, in order to understand which is the time-domain feature that feels the main effects of diamond mill wear during stone cutting. These 6 features were extracted for the two force signals, F x and F y , respectively.
The mean value

The Xrms value of a function x(t) over an interval of T is

The crest factor CF is the ratio of the peak level (X max ) to the root mean square level (Xrms)

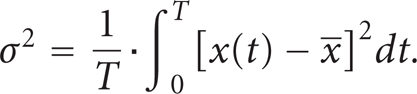
The variance is the mean square value about the mean
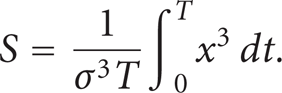
The skewness S is the third statistical moment of a distribution
The kurtosis K is the fourth statistical moment of a distribution

The analysis of variance (ANOVA) was carried out on the 6 features previously defined in order to measure which feature feels the most significant influence of mill wear. The ratio between the variance of each feature data due to mill wear and the whole variance of each feature data was used to measure the influence of mill wear on each of the 6 considered features. Moreover, ANOVA analysis allowed is to verify if the two considered process parameters influence significantly the extracted features.
Finally, regression analysis is allowed to write the analytical relationship among the force feature Xrms, that feels the most significant effects of the mill wear, the diamond mill wear (T), and the considered process parameters (u and p).
4. Results Discussion
ANOVA analysis proved that both the diamond mill wear and the two considered process parameters, feed speed and depth of cut, influence significantly all the 6 considered features of F x and F y signals. The interactions between the three factors, mill wear, feed speed, and depth of cut, do not significantly influence anyone of the 6 features of F x and F y signals. Figure 7 shows the average values of the 6 features extracted from F x signal for each value of the considered process parameters, feed speed, depth of cut, and mill wear. We can see that the mean value Xavg and Xrms value of F x signal strongly increase with the increase of the feed speed (u), of the depth of cut (p), and of the mill wear (T). However, the three parameters sigma, skewness (S), and crest factor (CF) seem to be less affected by the increase of the process parameters, since their trend is slowly. Finally, the influence of the process parameters on the kurtosis (K) is not clear, since we cannot identify a univocal trend. The same effects were observed for F y signal.

Main effect plots of features extracted by F x signal versus feed speed (u), depth of cut (p), and mill wear (T).
ANOVA analysis demonstrated that Xrms is the feature that feels the most significant effects of diamond mill wear for the three considered force signals. Therefore, Xrms was considered to deepen the analysis in order to monitor mill wear by acquiring cutting force signal during stone cutting. The other features were neglected in the following stages of analysis.
Plots of the Xrms feature versus diamond mill wear were produced together with cutting force relationship with feed rate and depth of cut (see Figures 8 and 9). The x-axis of Figures 8 and 9 shows the 5 stages of diamond mill wear distributed along mill tool life, as introduced in Section 3.1. The 5 stages of wear were put into relationship with the protrusion height of the diamond grits by the bond observed on mill surface, as shown in Figure 10.

Xrms feature of F x and F y versus diamond mill wear for the three values of feed speed (200, 400, and 600 mm/min).

Xrms feature of F x and F y versus diamond mill wear for the three values of depth of cut (0.1, 0.5, and 1 mm).

Height of the diamond grits versus stages of mill wear.
Inspection of Figures 8 and 9 shows that the x-component of the cutting force is higher than the y-component, since the angle of contact between mill and stone is lower than 45°, due to the low value of the depth of cut. Moreover, Xrms increases significantly with the mill wear for the same value of the feed rate or of the depth of cut, Xrms increases strongly with the feed speed or with the depth of cut for the value of the diamond mill wear too.
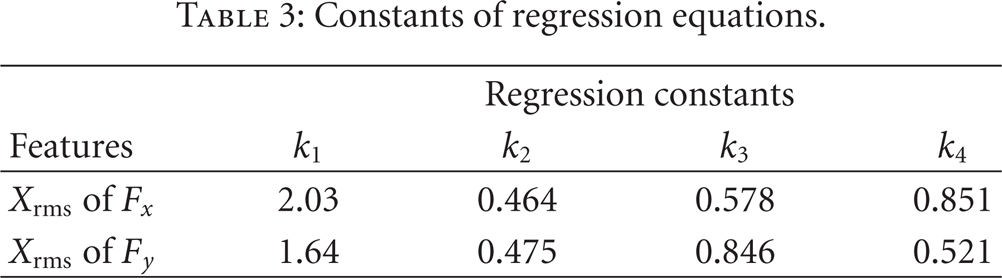
Regression analysis underlined that the analytical relationship among Xrms feature, mill wear T, feed speed v a , and depth of cut p is given by the following expression for the two considered signals, F x and F y , respectively,

where k1, k2, k3, and k4 are constants. The coefficients of determination were higher than 98%, while the hypotheses (normality and homogeneity of variance) about the residuals were satisfied. However, (7) may be written as

The values of the constants are shown in Table 3. Therefore, the measurement of the cutting force along one of the two axes, x and y, is enough to monitor diamond mill wear. In fact, Xrms feature shows the same behaviour for the two axes. The 95% confidence region for the entire regression surface has been evaluated by extending the Working-Hotelling confidence band for the regression line when there is one independent variable [18]. The results are shown in Table 4 where we have reported the limits of the confidence band together with the experimental value and the corresponding value given by the regression model (all the values are in Newton). The results in Table 4 match with the projection curves of Figures 8 and 9, that is, a confidence band has been reported for each curve of Figures 8 and 9. As we can see, the confidence band is very close to the values estimated by the regression model, since the estimated variance has a very small value.
Constants of regression equations.
95% confidence band for regression surface (the values are in N).

5. Conclusions
A diamond mill wear monitoring strategy, based on cutting force measurements, was presented. The present work demonstrated that force measurements may be effectively used to monitor diamond mill wear during stone cutting.
Due to the fact that no information exists in literature on diamond mill wear during stone cutting, a certain number of monitoring features were extracted from the data. The selection of the feature displaying the most consistent trend towards mill wear was carried out by means of analysis of variance (ANOVA) results. The selected feature Xrms was put into relationship with mill wear and process parameters.
The Xrms feature of cutting force signals along x and y axes is significantly influenced by mill wear, feed speed, and depth of cut, while the interactions seem not to significantly influence Xrms feature. The cutting force signal along z-axis is very near to 0, while the cutting force signal measured along x-axis is higher than that of y-axis.
The relationship among Xrms and mill wear, feed speed, and depth of cut shows an exponential trend for both the considered signals, F x and F y . The identified relationship may be used to predict diamond mill wear by measuring cutting force along one of the axes, x or y.
Finally, the present work suggests that even under varying cutting conditions, involving different machining parameters, it is possible to control, in a reliable and accurate way, diamond mill wear during stone cutting by measuring the cutting force along only one axis, x or y, respectively, since the corresponding signals show the same trends.
Footnotes
Acknowledgments
This work has been carried out with the funds received by the Italian Ministry of Instruction, University and Research (M.I.U.R.) within the project entitled “Intelligent sensor monitoring of stone machining” (MIUR-PRIN 2002).