
Abstract
Cutting force and energy are often used as parameters for monitoring the stone cutting process. Empirical models are required to guide the selection of the cutting conditions. This paper shows a simple empirical model to predict the variation of the cutting energy. It puts into relationship the cutting force and the cutting energy with the idealized chip thickness. It has been tested on six different kinds of stone. The models can be used to guide the selection of cutting conditions. The chip generation and removal process has been quantified with the intention of assisting both the toolmaker and the stonemason in optimizing the tool composition and cutting process parameters, respectively.
1. Introduction
Stone cutting by means of diamond tools has a wide field of application in stone industry. With the growing use of natural stones as a construction material, there is an increasing demand on optimizing the various processing parameters to improve productivity and reduce costs. In order to attain the economically best cutting conditions, the ideal balance between tool life and cutting rate has to be achieved. The harder the stone to be cut, the stronger the diamond type to be selected is a general rule, but there are collateral factors, such as tool manufacturing, workpiece properties, cutting conditions, cooling efficiency, metal core design, and machine condition, which may affect the performance and life of a saw blade.
An understanding of the prevailing mechanism of abrasive-workpiece interactions during stone machining is a necessary step in order to efficiently use the cutting process. The understanding of the cutting phenomena leads to models that voice the relationship between cutting behaviour and control parameters. Stone removal is dominated by the kinematics of cutting. The kinematics of cutting is determined by cutting speed and feed speed. Cutting behaviour can be related explicitly to the cutting force. Cutting force and energy are important parameters to better understand the cutting process since they are directly related to tool wear, cutting temperatures, and surface integrity. In order to achieve better control of a cutting process, a model is required to demonstrate the relationship between cutting and control parameters.
Very few researches exist in literature on stone cutting. Jerro et al. showed a mathematical approach to define and derive theoretical chipping geometries [1]. From the knowledge of the theoretical chipping geometries, chip area and mean chip thickness relations were obtained. The relationship between tangential cutting force and obtained chip thickness is empirically investigated. Brach et al. studied the problem to convert dynamometer readings of specific cutting energy into power consumed [2]. Asche et al. showed the empirical results of the influence of process parameters on tool wear [3]. Tönshoff et al. developed a model on stone cutting by disc-like diamond tools that is widely used even if it is not completely tested [4]. The model shows the mechanical interaction of tool and workpiece as caused by the elastic and plastic workpiece deformation of the cutting grits, the friction between stone and diamonds, stone and matrix, and swarf and matrix. Konstanty presented a theoretical model of natural stone sawing by means of diamond impregnated tools for both circular and frame sawing [5]. These models seem not to have been tested by means of experiments. Pai et al. collected and observed chip samples under a scanning microscope and related them to the specific grinding energy [6]. These investigations do not try to give an organic comprehension of phenomena that happen at the interface tool-workpiece during stone cutting.
The literature offers many works on grinding of ductile or brittle materials. Malkin proposed an interesting model of the relationship between the grinding power and the rate of plowed surface area generated by abrasive cutting grits that interact with the workpiece in ceramics [7]. He deepened the model by taking into account the influence of the rounding at the tip of the triangular-shaped grit on the specific grinding energy [8]. The work on metal grinding shows many approaches to model grinding force [9]. They are based on empirical [10] or physical considerations [11].
In a previous work, the authors have modelled the process of stone contouring by electroplated diamond mills [12], an empirical model of the relationship between the cutting force and energy and the relevant cutting parameters, such as the depth of cut and the feed rate, for the stone known as Coreno Perlato Royal. The cutting force and energy have been modelled as a function of equivalent chip thickness and material removal rate (MRR) by simple and general power function. In [13], Buyuksagis studied the effect of cutting mode on the sawability of granites using segmented circular diamond sawblade.
The present work demonstrated that the same models are valid for five further kinds of stone. The machining conditions that are most interesting from an industrial point of view have been investigated. The models have been tested for different values of the process parameters.
In the following, the design of the experimental set-up is shown together with the experimental work. Then, the models developed for cutting force versus equivalent chip thickness and for specific cutting energy versus equivalent chip thickness or material removal rate are presented. Then, they have been tested for different process conditions.
2. Design of Experimental Set-Up
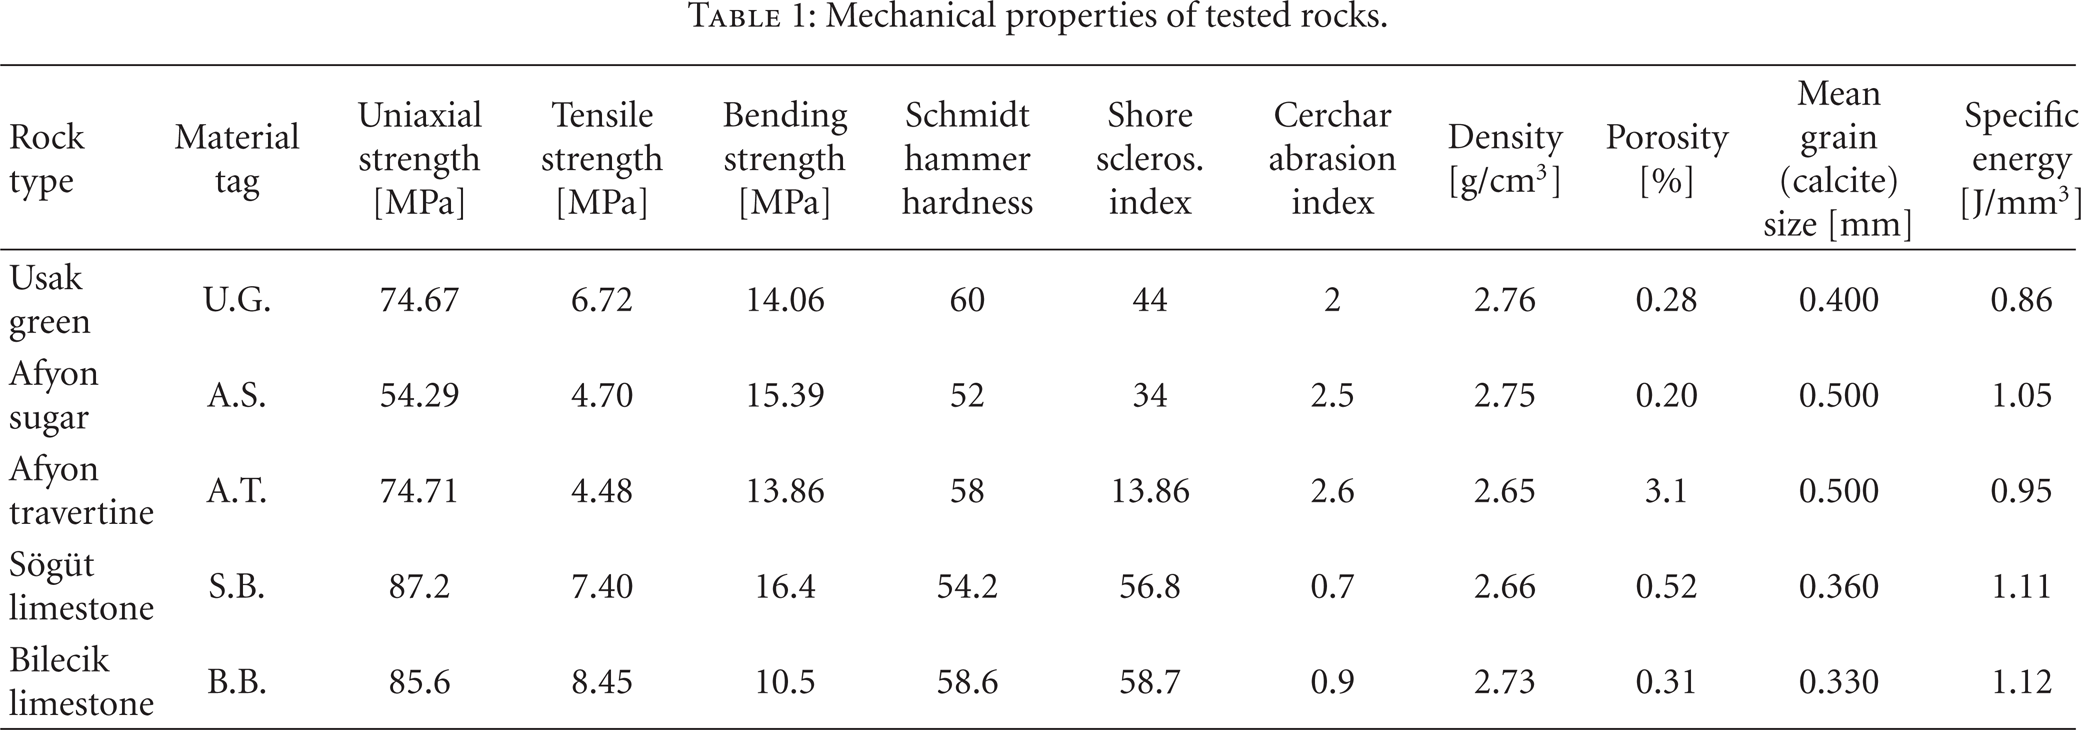
Experiments were undertaken on a Brembana Machine CNC machining centre. A diamond mill, commonly uses to contour marble, was used, with a diameter of 20 mm, height of 37.5 mm, diamond mesh no. 40/50, and concentration of 0.18 crt/cm2. The cutting length is 50 mm. Five different types of rocks (marble-limestone-travertine) which have substantial market demand were selected for the cutting experiments. All the samples used in the cutting tests were approximately 1.7–1.9 kg in weight, having a length of 150 mm, and 150 mm × 30 mm section. Some mechanical properties of the tested rocks are given in Table 1, together with their mineralogical compositions obtained from thin sections Table 2 [14]. The mechanical tests were performed according to related ISRM suggested methods [15] and testing procedures of the used instruments.
Mechanical properties of tested rocks.
Mineralogical properties of tested rocks.

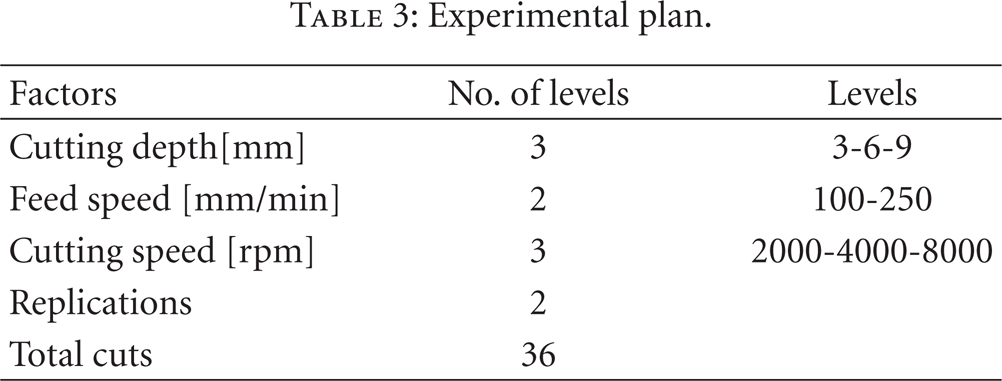
Two feed speed values, three cutting speed values, and three cutting depth values were taken into account for each material; they were chosen in order to reproduce the commonly used industrial range of process variables. Each cut was replicated two times, yielding a total of 36 measured forces. The experimental plan is shown in Table 3. The whole number of experimental tests was 180.
Experimental plan.
The cutting conditions were represented by the equivalent chip thickness heq. The experimental cuts were performed in a random sequence, in order to reduce the effect of any possible systematic error. The cutting forces F f n and F f have been measured by a Kistler piezoelectric platform dynamometer (Type 9257 BA).
3. Experimental Work
The cutting force has been measured by a dynamometer placed under the workpiece during the marble cutting, as shown in Figure 1. A dynamometer may measure the components of the cutting force, which acts on the workpiece, along the feed rate direction and along the perpendicular to the feed rate direction, F f and F f n , respectively. The resultant R of the F f and F f n components has been calculated as

F f and F f n measurements by dynamometer.

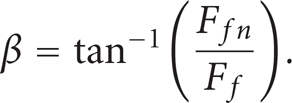
The resultant R forms an angle β with the component F f :
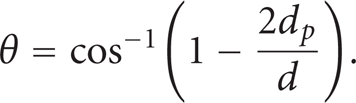
The angle of contact between mill and workpiece is given by
The tangential F c and radial F t components of the cutting force may be calculated by the resultant R (see Figure 2):
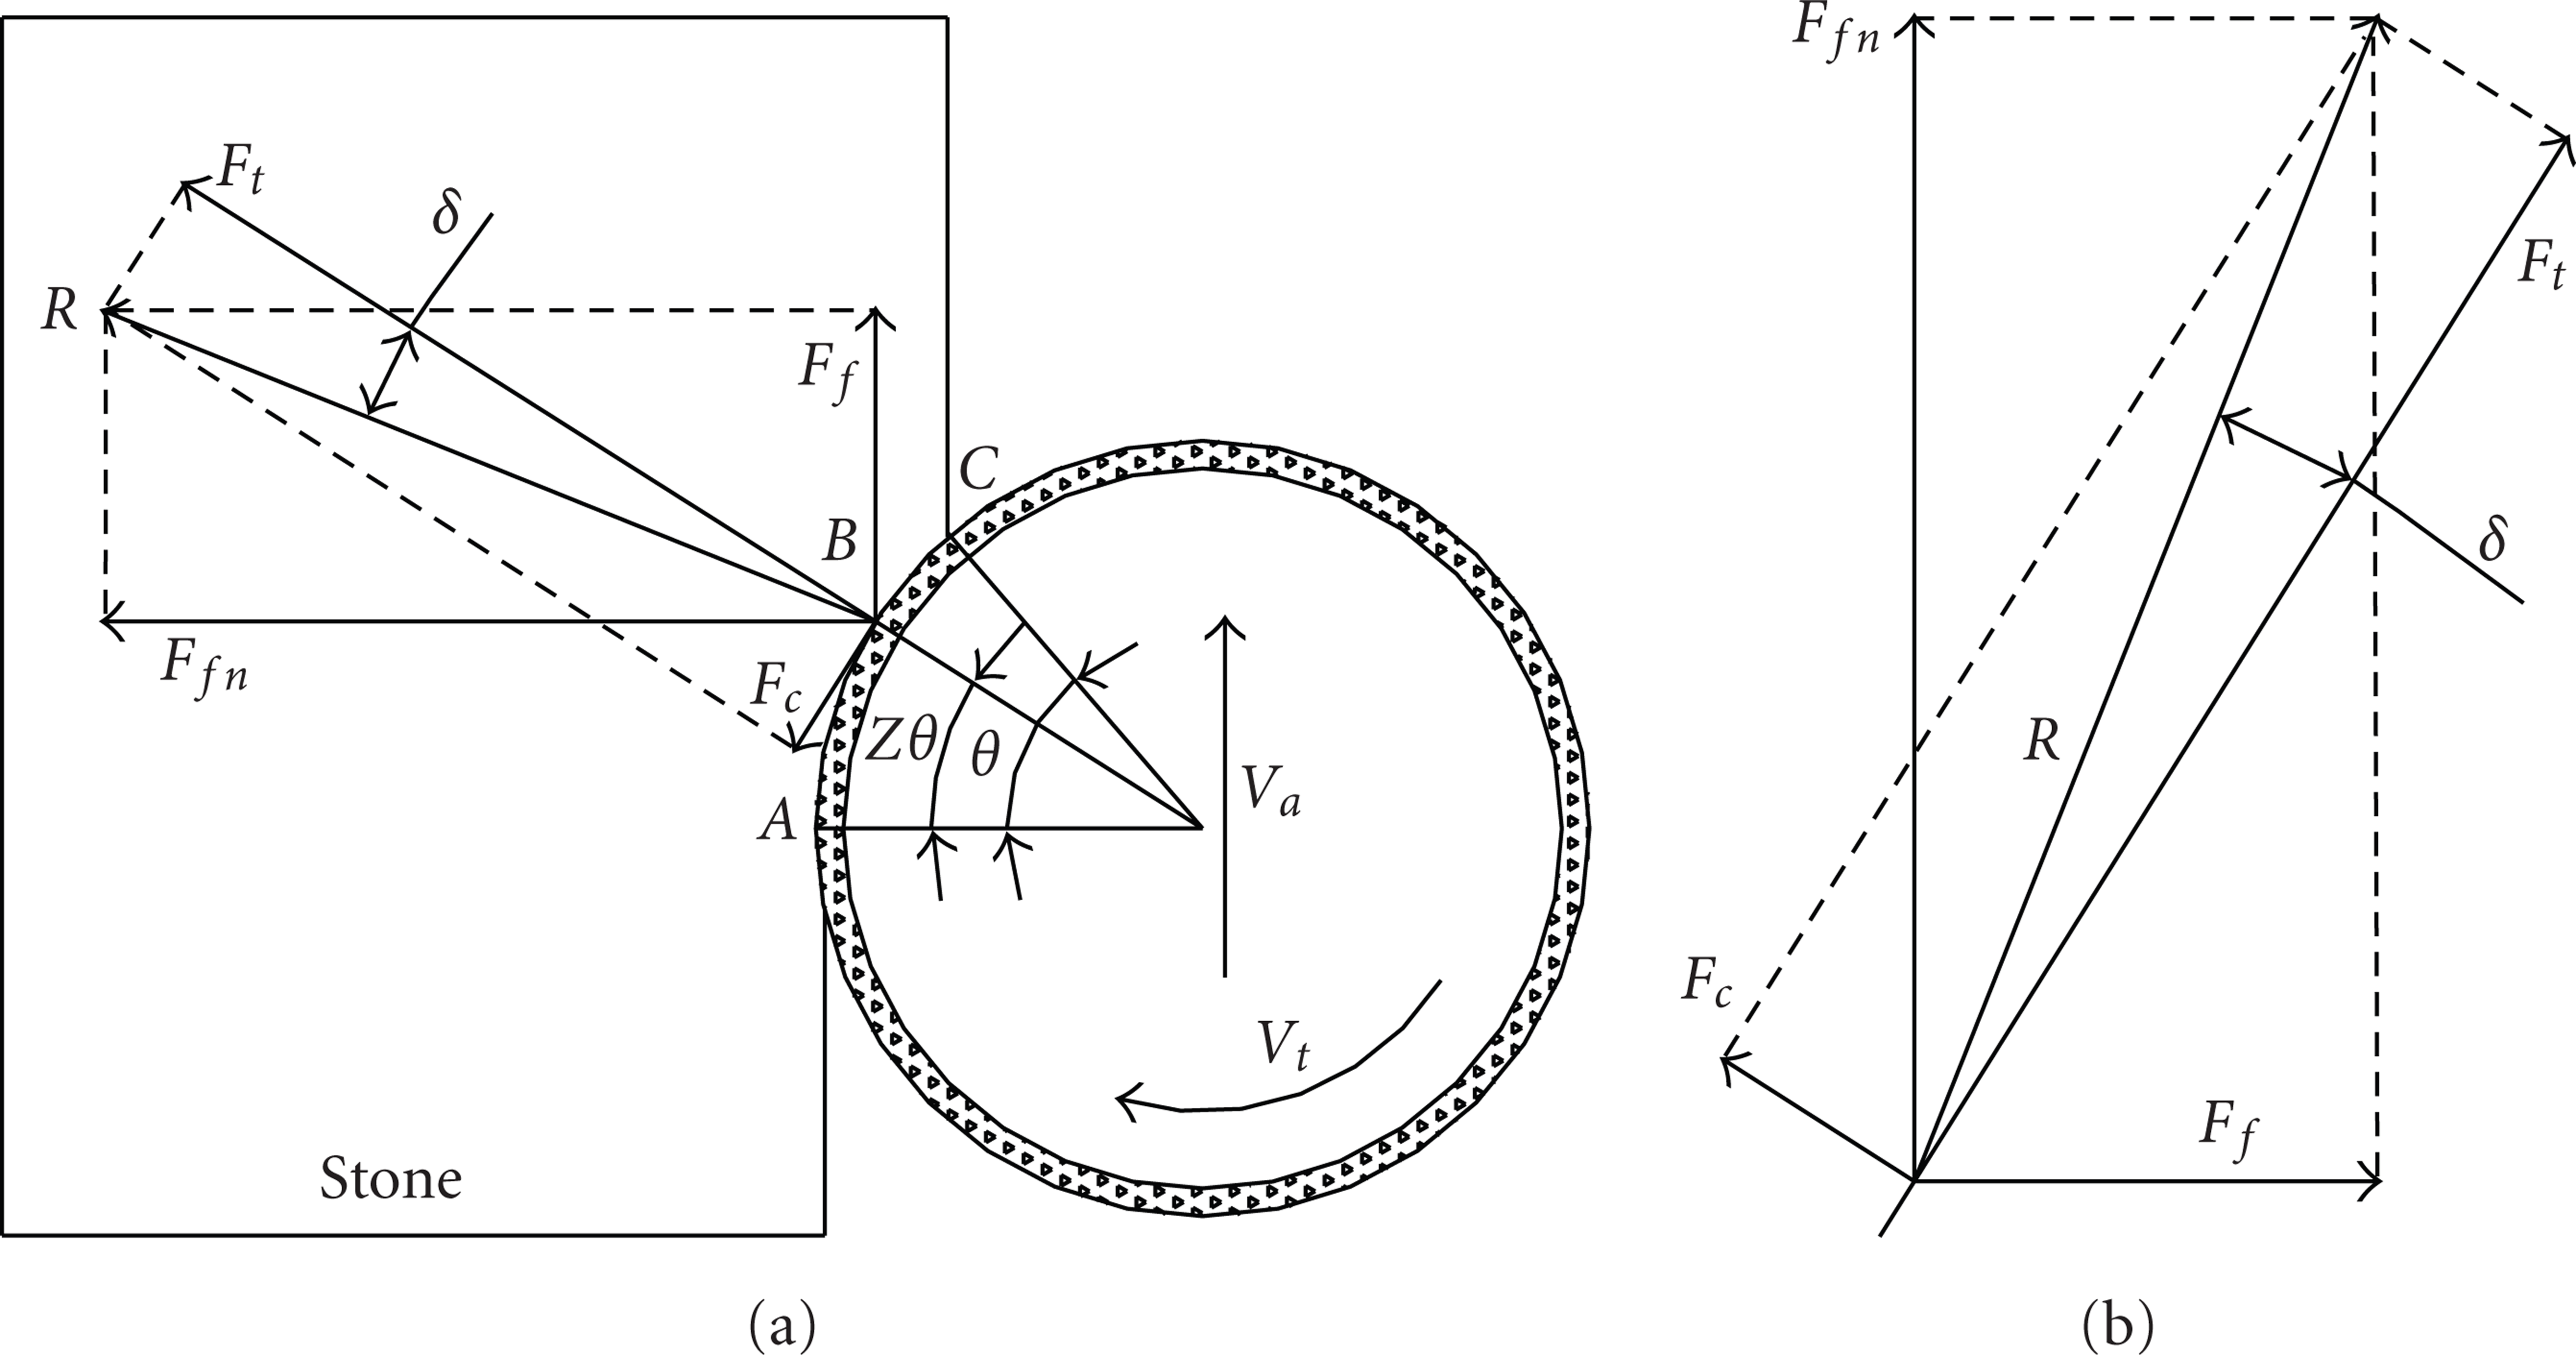
F t and F c force components.

where

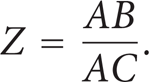
The Z parameter in (5) depends on the location of the application point of the resultant force R on the arc of contact AC between mill and workpiece. Thus,
Before obtaining the components F t and F c by the measurements of F f and F f n values, some ways of estimating the value of Z must be found. If the depth of cut has a small value, the tangential F c and the radial F t components of the cutting force roughly coincide (see Figure 2).
Considering the model developed in [2], the tangential F c and radial F t cutting forces have been expressed by the following models:


where K t and K c are the cutting force coefficients, ν t and ν c are constants, and heq is the equivalent chip thickness. The equivalent chip thickness is equal to

It is determined by depth of cut d p , the feed and the cutting speed, v a and v t , respectively. These relationships completely agree with those proposed by a CIRP cooperative research program on grinding [10]. Based on (7) and (8), the relationship between cutting force and cutting conditions is not linear but can be expressed by a single exponent.
The specific cutting power can be expressed as

The numerator is the time rate of power consumption, while the denominator is the time rate of stone volume removal. It tends to be constant for a given work material, mill specification, and undeformed chip thickness just as the fracture stress tends to have a characteristic value for a given material and type of loading. It varies significantly with chip thickness as well as with the condition of the mill face due to dressing technique and grit wear. Specific energy is a convenient quantity to use in estimating cutting forces. Substituting (8) and (9) in (10), we obtain the following result:

where K e = K c /b and υ e = υ c − 1.
We can conclude that by defining 4 parameters (K c ,K t ,υ c ,υ t ), it is possible to model both the cutting forces (F c ,F t ) and the specific cutting energy (E c ) by means of (7), (8), and (11). Those equations are general; they are valid for the five considered marbles.
4. Prediction of Cutting Force and Specific Energy
ANOVA analysis underlined that feed rate, cutting speed, depth of cut, and marble significantly influence the force components F c and F t , even if the depth of cut seems to be the most significant variable, as shown in Figures 3 and 4. An increase of both the depth of cut and the feed speed causes an increase of both the force components. However, an increase of cutting speed causes a decrease of the force components. The influence of the marble type has not a univocal trend, since the kinds of considered stone are different.
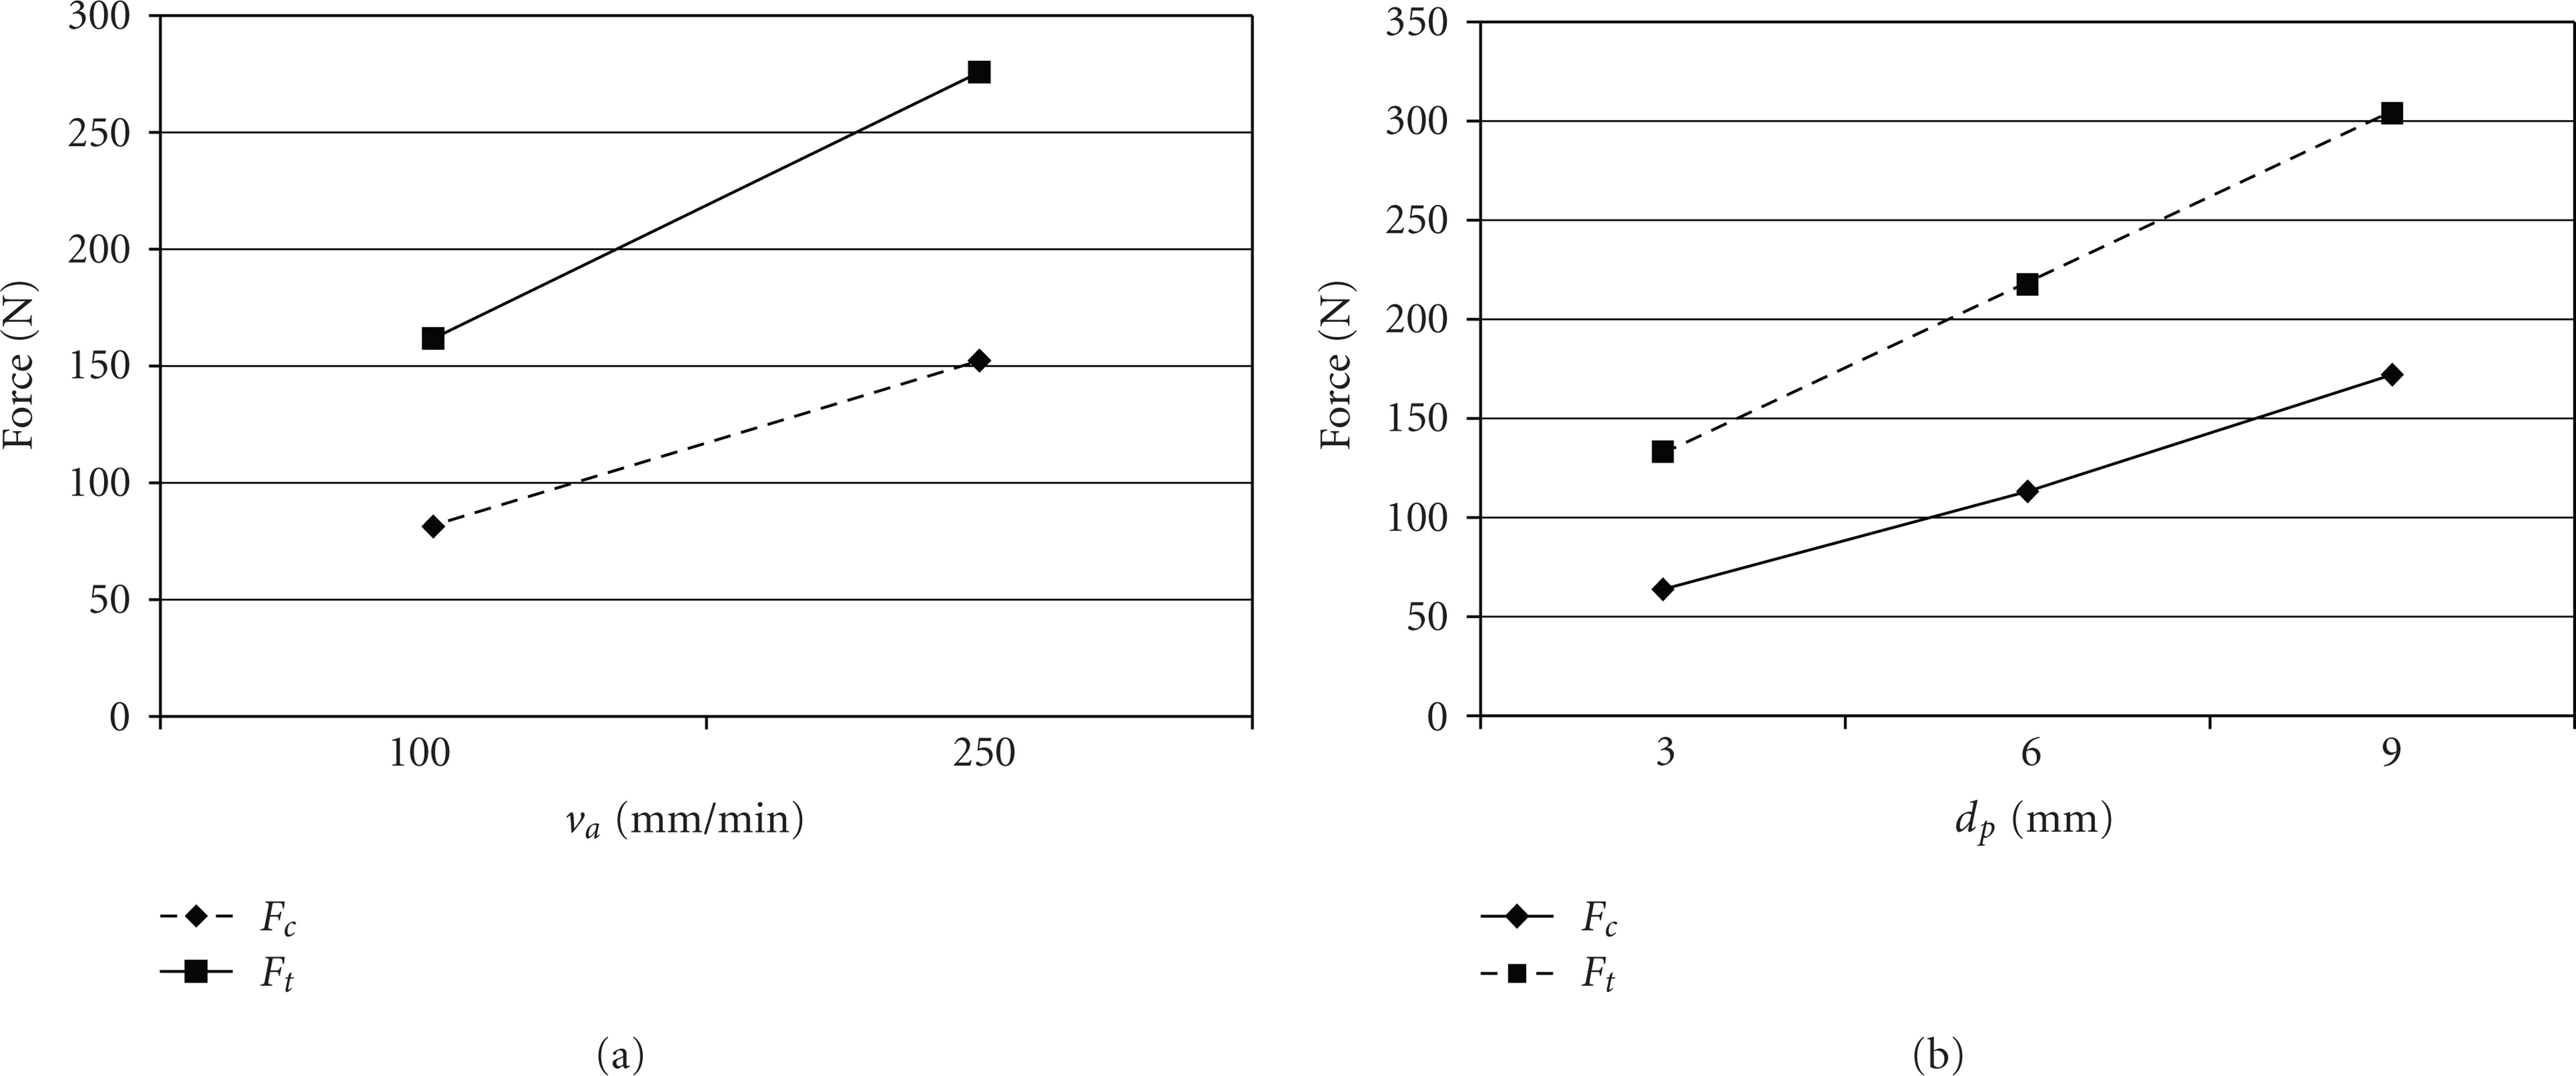
Main effect plot of F t and F c versus depth of cut and feed speed.

Main Effect Plot of F t and F c versus cutting speed and marble type.
Regression analysis of the experimental data is carried out to the constant values in (7), (8), and (11). All the regressions satisfy the hypotheses of normality and homogeneity of the residuals.
The radial cutting force F t versus the increase of the equivalent chip thickness is reported in Figure 5 for the five considered rocks. It increases with the increase of the equivalent chip thickness from 174 N of Afyon Travertine to 180 N of Afyon Sugar, 201 N of Usak Green, 325 N of Sogut Limestone, and 367 N of Bilecik Limestone.

Comparison of model and experimental data of F t versus heq and marble's kind.
The tangential cutting force F c versus the increase of the equivalent chip thickness is shown in Figure 6 for the five considered rocks. It increases with the increase of the equivalent chip thickness from 95 N of Usak Green 101 N of Afyon Sugar, 108 N of Afyon Travertine to 165 N of Sogut Limestone, and 181 N of Bilecik Limestone. The values of the tangential cutting force F c are significantly smaller than those of the radial cutting force F t .

Comparison among model and experimental data of F c versus heq and marble's kind.
The specific cutting energy E c versus the increase of the equivalent chip thickness heq is shown in Figure 7 for the five considered rocks. It decreases with the increase of the equivalent chip thickness from 930 J/m3 of Usak Green stone to 1021 J/m3 of Afyon Sugar stone, 1048 J/m3 of Afyon Travertine, 1623 J/m3 of Sogut Limestone, and 1752 J/m3 of Bilecik Limestone.

Comparison among model and experimental data of E c versus heq and marble's kind.
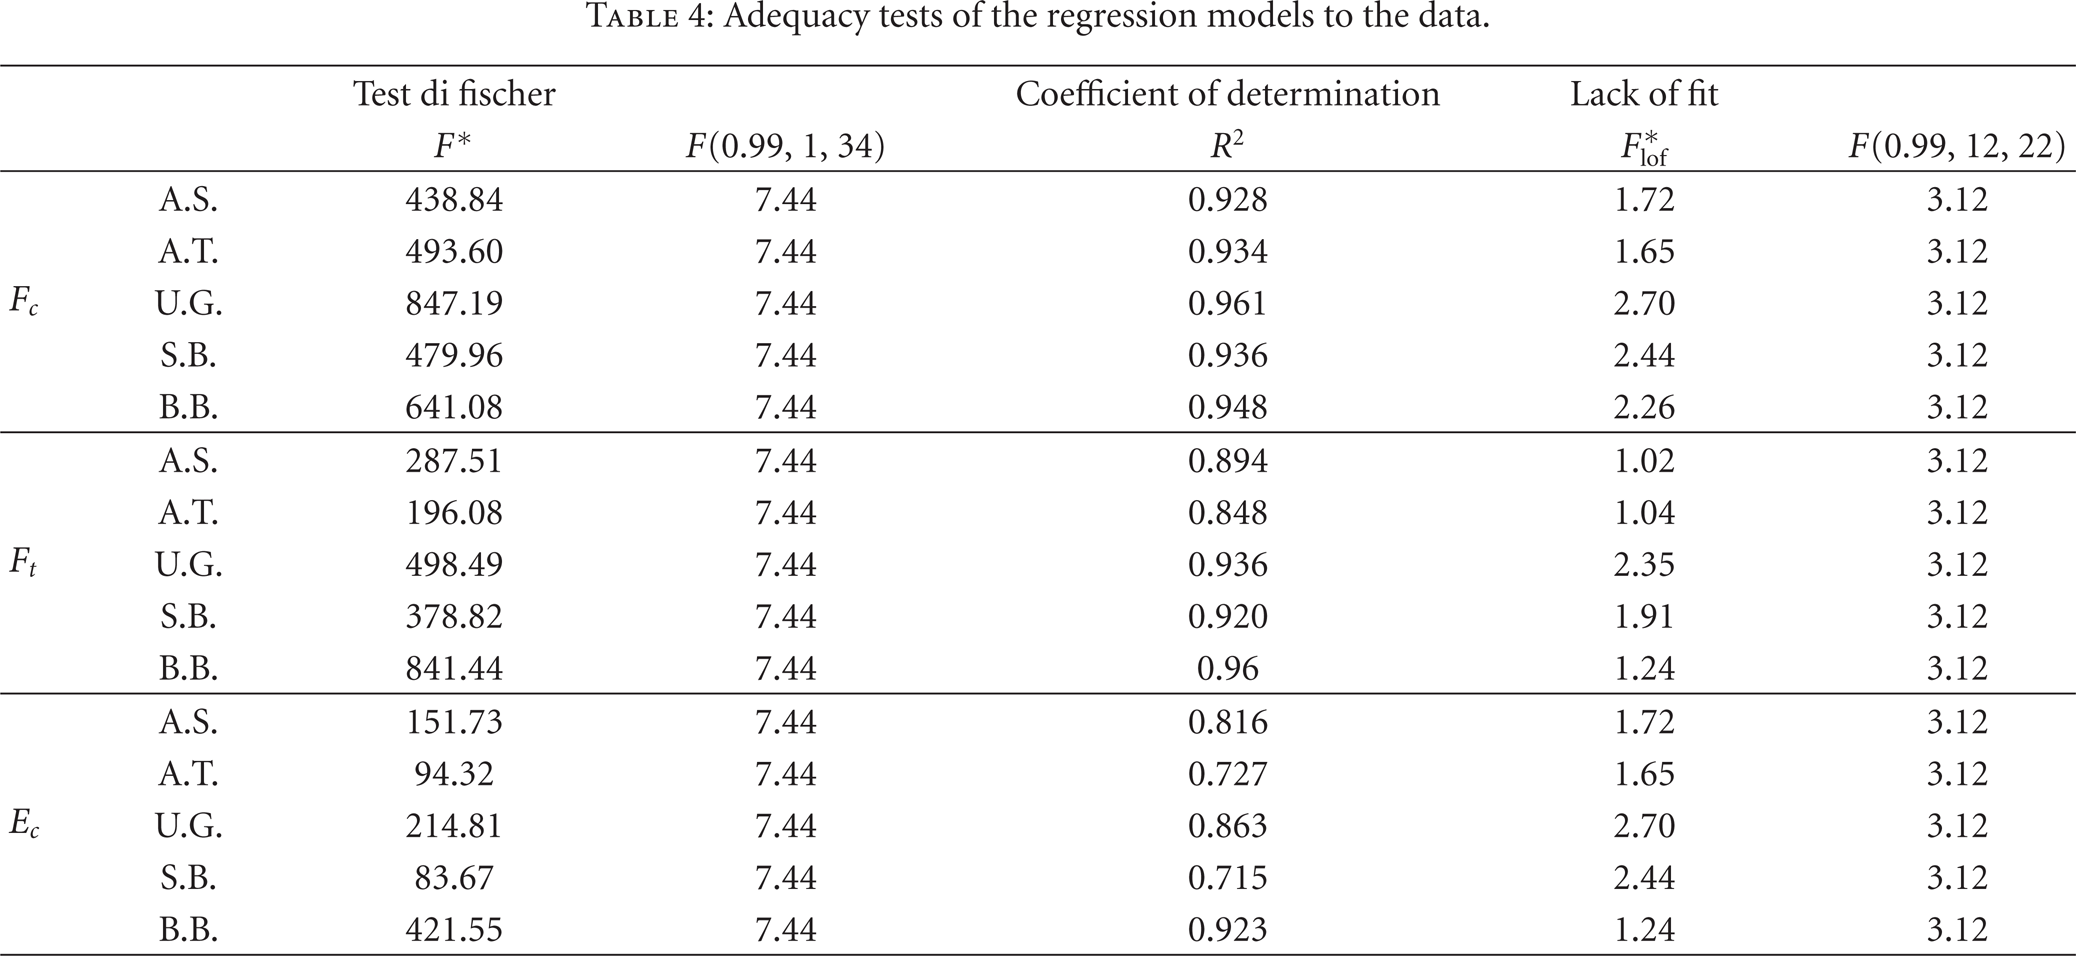
Some tests have been used to evaluate the obtained regression models (see Table 4). To analyse the adequacy of the models to the experimental data the test of Fisher has been used. This test calculates the variance of the data explained by the regression model by means of the statistical ratio F * : the higher is this ratio, the adequate is the model to the data. The coefficient of determination R2 gives an idea of the existing quantitative correlation between the dependent and the independent variables of the regression model. Finally, the lack of fit test has allowed verifying that the distribution of the data may be approximate by a linear relationship. It is a function of the distances between the regression equation and the sample means by the statistical ratio F * lof, that is, as higher is this ratio as far the data are from the regression line. Table 4 reports the results of those tests. It can be seen that the obtained models present a good result in terms of adequacy, correlation, and linearity.
Adequacy tests of the regression models to the data.
The five rocks have provided five different models of the radial cutting force F t , the tangential cutting force F c , and the specific cutting energy E c . The terms of those equations look similar. Therefore, it is necessary to evaluate if the five identified equations of the radial cutting force F t or the tangential cutting force F c or the specific cutting energy E c are significantly different by an analytical point of view. The five regression straight lines have been compared by means of statistical tools. In detail, the statistical test suitable to compare regression curves has been used. It is based on the consideration that if the regression lines are very near, all the experimental data may be considered as belonging to the same population. On the contrary, if they are significantly different, there are different populations of data by which the samples are extracted. It uses a statistical ratio F * comparison: as this ratio is lower as the compared regression equations are nearer. Following the rules of this test, it has been discovered that the five equations seem to be significantly different. In fact, the F * comparison ratio (109.58 for F t , 59.74 for F c , 70.24 for E c ) is higher than the established percentile of the Fisher probability distribution F(0.99, 8, 170) equal to 2.62. Further investigations have been involved to verify the eventual equality of the six couples of regression straight lines. The previous described test has been applied to each couple of curves and the results are reported in Table 5. It can be noted that the equation related to the three materials Afyon Sugar stone, Usak Green stone, and Afyon Travertine look similar, even if the equations related to Afyon Sugar stone and Usak Green stone seem different, the value of the statistical F * comparison is near to the admitted limits. The equations related to the two further materials Sogut Beige Limestone and Bilecik Limestone are the same, but they are significantly different from the first three. This means that Sogut Beige Limestone and Bilecik Limestone have cutting performances different from the other three materials. In fact, this is a result of origins and mineralogical properties differences of stones.
Comparison between each couple of regression curves.

In a previous work [16], Buyuksagis uses specific energy as a commonly accepted measure of sawing efficiency, when obtained under standardized conditions. He demonstrated that specific energy of the same seven marbles depends strongly on three marble's properties: the Cechar abrasion index, the Mohs’ hardness, and the uniaxial compressive strength. This means the cutting efficiency may be evaluated by means of these three marble's properties.
When compared the specific energy values of a previous sawing study (Buyuksagis) and the milling test used in this study, similar results have been obtained for same rocks in both methods (see Figure 8). The reason of the difference between the specific energy values obtained for same stones is due to using different specific removal rates (Q w ′ ) in sawing and milling experiments. It can be stated that sawing and milling tests give similar results in terms of specific energy values for same rock groups (Figure 8).
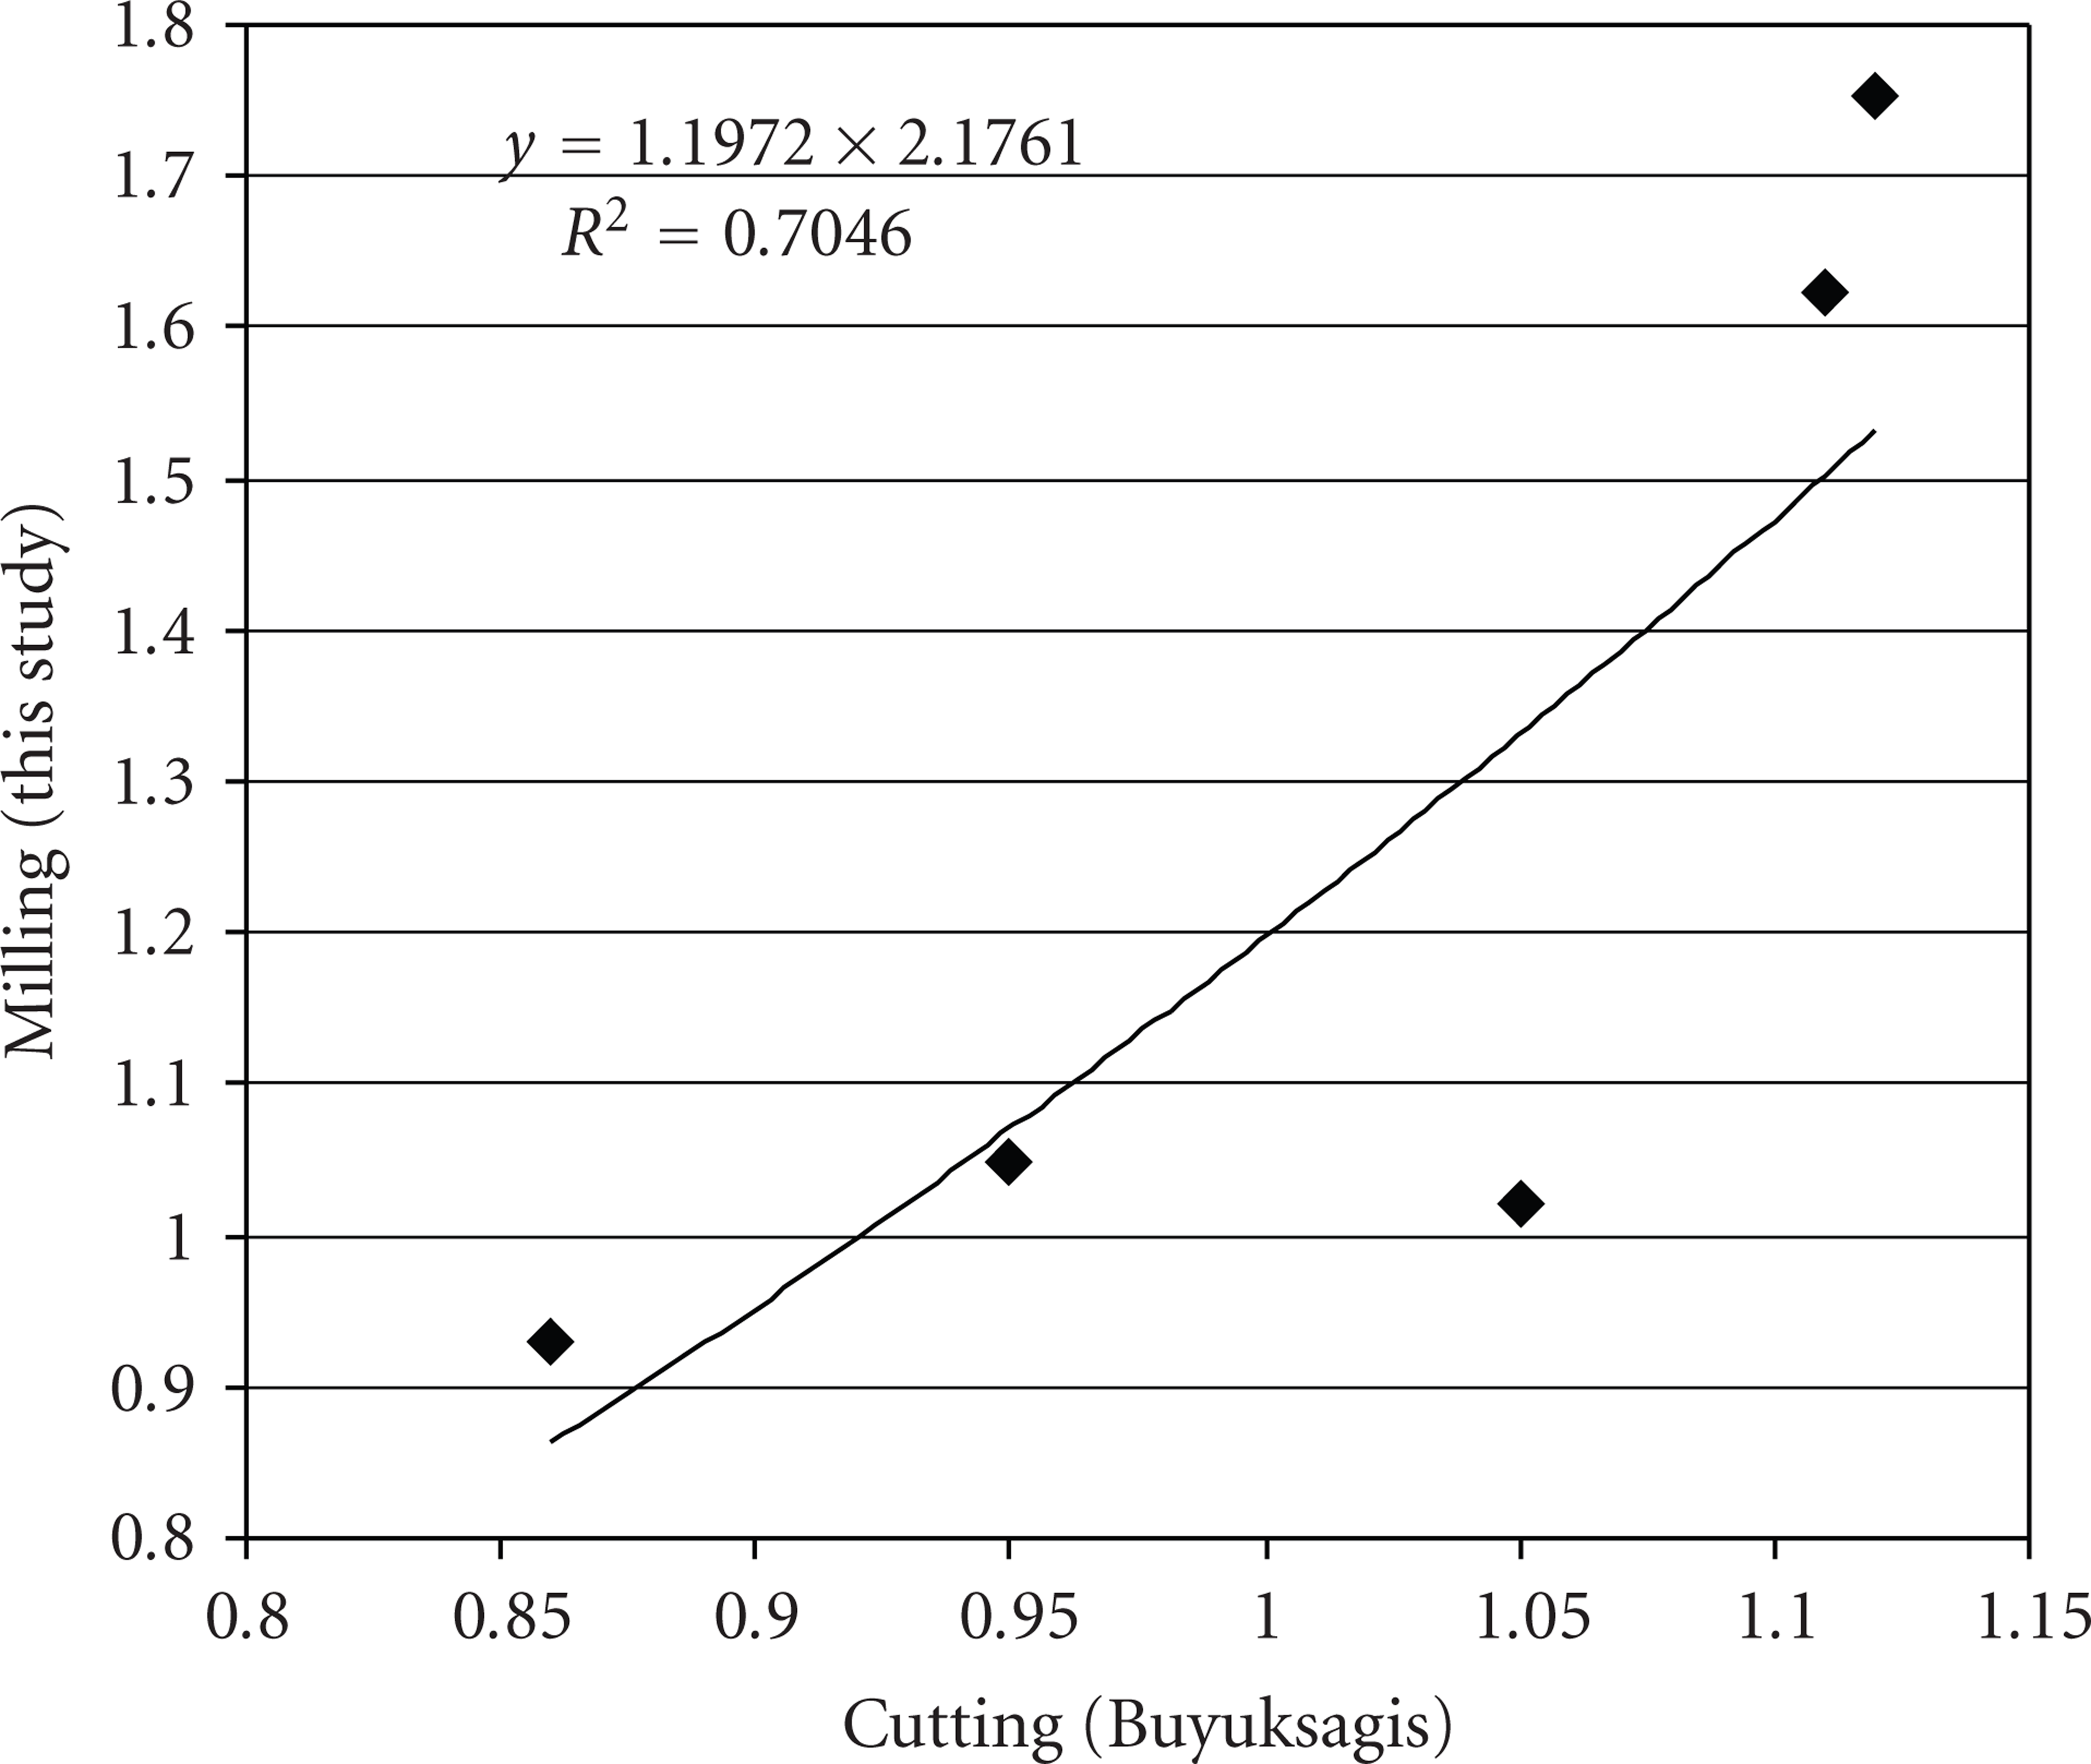
Comparison of Specific Energy in sawing and milling processes.
5. Conclusions
This work shows that a simple and general model is able to describe the relationship among the specific cutting energy and the process parameters to machine five different stones by means of a diamond mill. The model is a power function between the specific cutting energy and the equivalent chip thickness. It has been developed to contour Perlato Royal Coreno by a diamond mill. This work has extended the model to contour by a diamond mill to five further kinds of stones: Afyon Sugar stone, Usak Green stone, Afyon Travertine, Sogut Beige Limestone, and Bilecik Limestone.
This work represents a first step towards the increase of the knowledge on the stone machining processes in order to optimise them.
Footnotes
Nomenclature
Acknowledgments
Financial support to this work has been provided by MAP (Italian Ministry of the Production Activities) and MIUR (Italian Ministry of University and Research).