
Abstract
Hydrogen fuel cell is a developing technology that allows great amount of electrical power to be obtained using a source of hydrogen gas. It is a proven environment-friendly potential future fuel. During compression of hydrogen gas in reciprocating compressor, pressure fluctuation is built up. The pressure fluctuation and its reduction by the snubber are studied in this experiment. For different motor frequencies, the input and output pressure amplitude varies from 0.228 kPa–2.081 kPa and 0.095 kPa–0.898 kPa. The pressure magnitudes are 101.451–105.172 kPa and 101.388–102.565 kPa for input and output of the snubber, respectively. The acryl snubber reduces0.796 kPa (57.31%) pressure amplitude on average with restoring its high pressure. Detail information about the pressure including the critical pressure zone inside the tube like snubber part and the whole system can be obtained by CFD.
1. Introduction
Nowadays hydrogen is a proven environment-friendly potential future fuel because of rapid exhaustion of fossil fuel in the world due to its increasing demands. The United States, as one of the world's largest producers and consumers of fossil fuels, is responsible for a major portion of global energy-related emissions. A total of 2732.9 and 1 958.6 out of 5945.3 million metric tons of carbon dioxide emissions come from energy consumption by industrial and transportation sectors in 2005 [1]. And people's awareness against fossil fuel due to its environmental degradation character leads them to search for alternative fuels. The recent hikes in the price of fossil fuel have added momentum towards hydrogen and other alternative fuels [2]. Hydrogen possesses best properties against all alternatives. Due to renewability properties, hydrogen has become popular day by day. The physical and chemical properties of hydrogen make its utilization superior to fossil fuels. Environmental issues such as the global green house effect caused by carbon dioxide and the alternative fuel have been studied. Because of excellent ignitability and high adiabatic flame temperature of hydrogen fuel, ignition delay period, flame development angle, rapid burning angle in the hydrogen fueled engine are remarkably shorter than those of gasoline, diesel [3]. Hydrogen has much wider limits of flammability in air than methane, propane, or gasoline, and the minimum ignition energy is about an order of magnitude lower than for other combustibles [4]. If generated from renewable energy, hydrogen becomes the crucial link in an inexhaustible global fuel cycle based on the cleanest, most abundant, natural, and elementary substances: H2, O2, and H2O. The intension of holistic approach is to find the most optimum process route from “well to wheel” a methodology for the integrated production planning and reactive scheduling in the optimization of a hydrogen supply network like the one proposed [5]. Compressor is an essential part in hydrogen gas utilization. Reciprocating compressor, for its higher pressure increasing capacity, is used in hydrogen compressing system which is essential for transportation, storing, and supply network. But, during the compression in reciprocating compressor, pressure fluctuation is built up inherently. These pulsations are resulted from reciprocating back and forth movement of piston inside the cylinder of the compressor. It should be lessened this pressure pulsations otherwise there may be explosion, ignition, damage of the whole system. Snubber or dampers are linear units designed to limit this sudden unwanted pressure pulsation [6]. The purpose of the study is to find out the fluctuation characteristics at the snubber of reciprocating hydrogen compression system by experiment and CFD model.
2. Methodology
Snubber made by acrylic material was composed of inlet and outlet pipes, cylindrical shape with buffer inside. The inlet pipe was connected to the compressor using a small hose pipe, and outlet was exposed to the atmosphere. Six pressure measuring points were constructed in inlet and outlet pipes. It was run by a motor with 10, 20, 30, 40, 50, and 60 Hz, and pressure value sensed by pressure sensor was amplified and recorded in a PC using data logger (see Figures 1 and 2). The key parameters with respect to gases are: pressure, temperature, volume/capacity, mass and weight, and mass flow. Like air, hydrogen gases follow gas laws; Boyle's law (or the first gas law), Charles’ law (the second gas law), and the third or ideal gas law that deal with how gases behave in response to changes in pressure, temperature, or volume. So, air was used in the compressor in place of hydrogen in this experiment for its safety, availability, and expensiveness. The pressure loss and amplitude reduction can be expressed by (1) and (2), respectively,


Block diagram of experimental setup.

Details of snubber dimensions with measuring points (in mm).
RMS values of input and outputpressure at point 3 and point 4 of inlet and outlet pipe were used for pressure loss. FFT analysis was done on data to find out amplitude values of the pressure waves along the snubber. The resultant value of the variables was calculated by taking square root of summation of squares of all values [7]. The pressure loss was obtained by (1), and the pressure pulsation reduction was calculated by (2) using data from experiment.
The used computational code was Star CD (version 3.24), which solve the full 3D time dependent Navier-Stokes, continuity, and energy equations using the finite volume method. The geometry was drawn using the CATIA (V5R15) CAD package and then imported to pro-Surf (Star CD's surface mesh generator) as an Initial Graphics Exchange Specification file (IGES). The computational mesh consists of 50 000 trimmed hexahedral cells. Inlet and outlet boundary conditions of snubber for CFD were applying the measured pressure from the experiment using pressure sensors at inlet (point 1) and outlet (point 6) for CFD. The model was built in a half type for the symmetrical shape of the snubber, and the symmetry boundary condition was applied. Turbulent model was using standard k-ε model. Simple algorithm revised pressure and convection terms belong to Upwind Scheme. Maximum residual tolerance was set under the 0.001 [8].
3. Results and Discussion
Figure 3 is a distribution of RMS values of pressure at different points of a snubber for 6 different motor frequencies. The pressure data were plotted against the length of the snubber system from the compressor. These curves have different pressure drop according to motor frequency. It shows that pressure drop at points 7.5, 25, 45 cm is similar in fasion but different in slope for all the motor frequency setting. The post snubber parts have also alike pressure gradient as inlet with lesser slope for each pressure line for specific motor frequency. It is clearly shown that there is abrupt drop of pressure along the length 45 cm to 74 cm from compressor outlet, where exists snubber main body with buffer for 30, 40, 50, and 60 Hz motor operation. This abrupt drop has happened due to more pressure that was created during for these motor frequencies. Along the snubber body, more input pressure creates more opposite friction forece that reduces its original pressure. Abrupt increases in volume of the conduit passage [see Figure 2] andthe buffer [length = 163.97 mm, width = 75 mm, thickness = 4.88 mm, inclination θ=52.42°] cause abrupt pressure downfall from its high pressure from inlet. The declination of pressure sources is related to motor frequency. For 10 and 20 Hz motor frequency, the input pressure was 101.4571 kPa and 102.0846 kPa which were comparatively less than those for higher frequency of motor operation of compressor. So, they had comparatively less pressure gradient than others for inlet and outlet points of the snubber. The highest and lowest pressure lines are obtained from 60 and 10 Hz motor frequency.
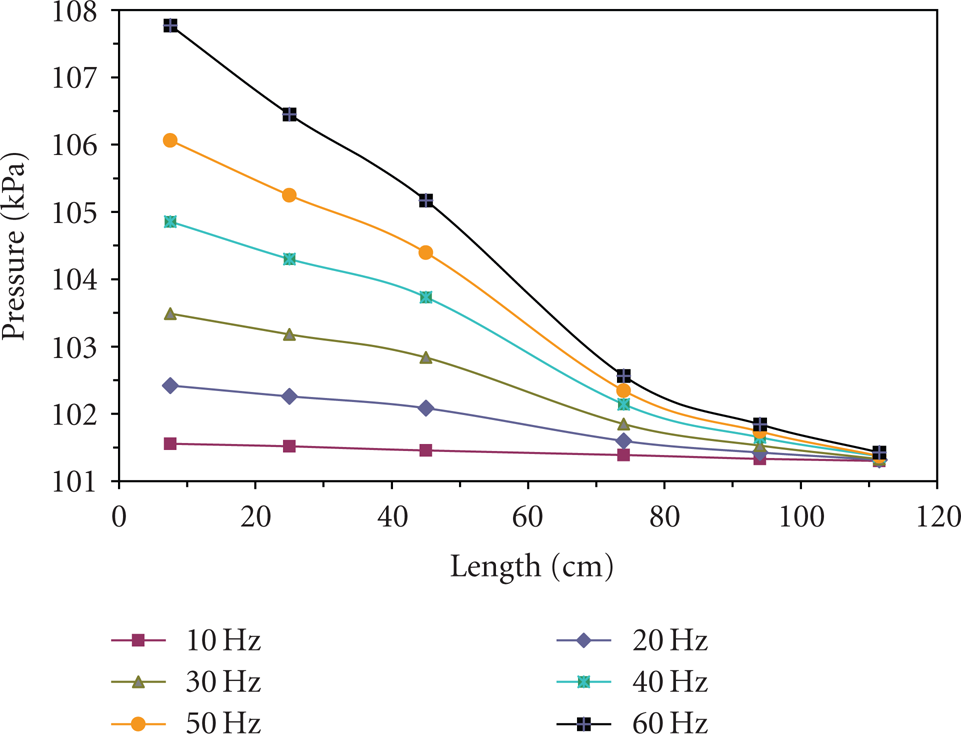
RMS values of pressure at different locations.
The motor frequency is plotted on x-axis, and the corresponding input (point 3) and output pressures (piont 4) obtained from experiment are plotted on y-axis as shown in Figure 4. It is observed that data points on the graph represent straight line for both input and output pressures. But the input pressure line has more slope than that of output pressure. The input pressures at the snubber were 101.46, 102.08, 102.83, 103.73, 104.39, 105.17 kPa for operating motor speed of 10, 20, 30, 40, 50, and 60 Hz. Those values for output of the snubber were 101.39, 101.60, 101.85, 102.14, 102.34, 102.56 kPa. The scenarios of RMS values of input and output pressures before and after the snubber possess a linear relationship for different motor frequency. Due to snubber, the output pressure line is at lower slope than that of input. For these motor speeds, the percentages of pressure losses were 0.07%, 0.48%, 0.96%, 1.53%, 1.97%, and 2.48%. The average pressure loss was obtained as 1.25% which was very low indicating good performance of snubber for its pressure restoring capacity.

Pressure magnitude at snubber.
The functional relationship between the motor frequency and input and output pressure amplitude is illustrated in Figure 5. Input and output pressure amplitude data against motor frequency show nonlinear relationship with motor speed. Both input and output pressure amplitudes are correlated with the motor frequency by polinomials of higher degrees. The input and output amplitudes and amplitude reductions were 0.228, 0.095, 58.46%; 0.793, 0.349, 55.95%; 1.349, 0.563, 58.25%; 1.881, 0.808, 57.03%; 2.081, 0.898, 56.87%, and 2.0215, 57.28% for varying motor frequencies from 10 Hz to 60 Hz. The fluctuation of the pressure was trimmed down 57.31% which shows the good performance of the snubber. Akbar et al. (2006) [9] showed that snubber with buffer had better performance than without buffer snubber in reduction of pressure fluctuation with less pressure loss. Experiment with steel snubber of different dimensions was resulted in maximum 21.59% pressure pulsation reduction [10].

Pressure amplitude at snubber for various motor speeds.
CFD analyses make the information about pressure in the snubber system available within inlet pipe, inside the snubber, including at buffer, and outlet pipe. In Figure 6, the pressure values by experiment and CFD model are compared at the snubber (point 3 and point 4). It shows that CFD has successfully calculated pressures at the snubber as the experiment with little variation. Pressure values at different points of the snubber, that is, tube shape with buffer are shown in Figure 7 with pictorial, numerical, maximum and minimum values. The pressure that developed in the compressor flows through the inlet pipe, snubber body, and outlet pipe to the atmosphere. There are more pressures at entrance of the inlet pipe, and then it reduces mainly by pipe friction along the pipe length. A sudden pressure drop from point 3 to point 4 is due to snubber main body with its buffer. Inside the snubber main unit, lower corners, the entrance point of snubber body, below the buffer parallel to inlet pipe, and exit pipe entrance experienced higher pressure than other points of the snubber. When the motor starts, its develop pressure increases gradually for first few time steps, then it adds more pressure, and finally it becomes constant same pressure inside the snubber. At the time step 0.35E − 01 seconds, the maximum and minimum pressures are 0.1070E + 06 Pa and 0.8975E + 05 Pa, respectively, at the entrance and exit points in the snubber system. The point of intersection between buffer and along the inlet, lower corner, has pressure between 0.1033E + 06 to 0.1045E + 06 Pa.

Comparison of CFD simulated pressure with experiment for point 3 and 4 at 35 Hz.

Pressure distribution inside the snubber at different time (CFD simulation) at 35 Hz.
4. Conclusion
More difference between input and output pressure fluctuations determines the performance of the snubber. In this study, acryl snubber damps the pressure fluctuation restoring its high-pressure values. The difference between amplitude of pressure for input and output amplitudes is 0.133, 0.444, 0.786, 1.073, 1.184, and 1.157 KPa for 10, 20, 30, 40, 50, and 60 Hz motor frequency, respectively. Pressure losses of 0.07% to 2.48% are found corresponding to these motor operations. The average amplitude reduction was 57.31% with a very small pressure loss of 1.25%. Detail information about the pressure including the critical pressure zone inside the tube of the snubber and the whole system are obtained using CFD analysis.
Footnotes
Nomenclature
Acknowledgments
This research was supported under project no.10024337 and Program for the Training of Graduate Students in Regional Innovation System ofthe Ministry of Knowledge Economy and Second-Phase of BK 21 project, Korea.