
Abstract
While global supply chains provide firms with a buffer against local shocks, they expose firms to multiregional risks. The COVID‐19 pandemic and its differential impact on different regions in the world offer an opportunity to explore these effects. We investigate the multiregional supply chain risk by focusing on credit risk measured by
INTRODUCTION
Supply chain resilience has always been a priority in the global setting (Cohen & Kouvelis, 2021; Cohen et al., 2020; Kouvelis, 2021). A critical question in assessing global supply chain resilience is the extent to which supply chain connections in distinct regions of the world either expose firms to increased risk or provide a buffer against local disruptions. The vulnerability of global supply chains and their impact on the economy has become a central issue during COVID‐19. While global supply chains allow firms to outsource production more cost‐effectively, they also expose firms to developments in the local economies where supply chain partners are located. The recent COVID‐19 pandemic and its shock to global supply chains provide a particularly relevant setting for exploring these effects. As countries took measures to contain the pandemic through shutdowns and social distancing measures, there were disruptions in local firms and their supply chain partners located in different regions. This setting allows the examination of the impact of changing local economic conditions on distant supply chain partners.
Disruptions during COVID‐19 adversely affected production for downstream firms, and financial flows for upstream firms, creating major vulnerabilities for firms connected within a production network. These vulnerabilities put firms at risk by reducing their ability to continue operations and make payments, increasing their default risk. This paper examines how these COVID‐19 disruptions affected firms' credit risk through their global supply chain linkages. While the focus of our paper is the credit risk transmission during COVID‐19, the results have implications for firms in general by showing that local shocks propagate in the global economy through supply chains and have a considerable impact on credit risk. Thus, our paper complements the literature that primarily focuses on disruption propagation through domestic supply chains, as in Hendricks et al. (2009), Barrot and Sauvagnat (2016), and Carvalho et al. (2021), by showing that not only local supply chains but also global production networks are important contributors to credit risk propagation of local shocks, a finding in support of the network model described in Acemoglu et al. (2012), in which microeconomic shocks can propagate throughout the global economy through supply chain connections. In sum, our paper contributes to the related literature by studying the implications of local shock propagation through global supply chains and focusing primarily on firm credit risks.
Following Agca et al. (2021), we use credit default swaps (CDS) to study credit risks in global supply chains. CDS contracts are financial contracts that protect the buyer when there is a default. Thus, CDS provides a gauge of firm credit risks from supply chain disruptions in COVID‐19. In this study, we first establish that CDS spreads respond both to disruption and resumption of supply chains during different phases of COVID‐19. We next show results for different industries by also taking into account the household demand channel. Different industries may be affected differently based on their exposure to household demand as consumer spending declines during economic shutdowns.1 We further examine pivotal firm, sector, and supply chain attributes that magnify or reduce firms' vulnerabilities to supply chain disruptions. We also show that our results are robust to an extensive series of tests and alternative specifications.
Our study investigates the effects of US firms' supply chain relationships with China. We focus on China because of its role as a major global production center, providing components, materials, and subsystems to partners around the world. In addition, China is the largest importer to the United States, providing 18% of total imports in 2019.2 Thus, COVID‐19–related economic disruptions in China would have significant potential consequences for US firms. We also focus on China because China experienced economic curtailments from COVID‐19 earlier than the rest of the world and reopened its economy back to normal when other regions reduced economic activity as the pandemic spread to them. The timeline in our study (December 1, 2019, to April 6, 2020) provides an important setting to understand the impact of supply chain dynamics and the household demand channel on credit risk during different pandemic phases. This timeline is before the period when the pandemic responses across different economies were coordinated and thus avoids the potential confounding effects that may exist in the later period of the pandemic due to the coordination in examining the credit risk responses of individual countries.3 The evidence we obtain provides important implications for understanding supply chain resilience to disruptions in different regions and the potential consequences of supply chain and household spending–driven vulnerabilities.
To focus our investigation of supply chain disruption propagation, we intentionally focus on the early months of the pandemic with two distinct periods: (1) when the Chinese economy shut down due to COVID‐19 (January 31 to February 29, 2020), which also corresponds to the time period immediately after the US travel ban to China on January 31, and we refer to this period as
We use a panel of daily CDS spreads of US firms, a high‐frequency variable for assessing the credit risk.4 We measure
The results are economically significant. Using industry times day fixed effects with the matched sample, we find that, for the US firms with suppliers in China, abnormal CDS spreads increase by 21 basis points (bps, or hundredths of 1%) in
Next, we explore which industries are more vulnerable than others to supply chain disruptions during the pandemic. Our sector‐level evidence suggests that the household demand channel is an important driver of how supply chain activity impacts credit risk in different industries during the pandemic. In sectors more closely connected to household demand, such as consumer goods and electronics, the impact of supply chain disruptions in China is mitigated by continuing demand in the United States when the US economy was open in
We further examine firm, industry, and supply chain characteristics to understand factors that affect supply chain resilience as reflected in credit risk during the pandemic. Among firm‐level factors, we find that the relative credit risk of firms with high financial and operational leverage, as well as that of firms operating in more competitive markets, is more sensitive to supply chain disruptions, and thus improves more when supply chain activity resumes. Since high financial leverage increases the likelihood of default and high operating leverage limits the ability to adjust operating costs, these firms are more affected by supply chain developments. Firms in highly competitive markets face potential substitution of goods, which increases supply chain vulnerabilities.
Factors that increase supply chain resilience during the pandemic are firm size, investment grade, cash holdings, inventory, number of segments, network centrality, and capital redeployability. Lenders may prefer large firms because they can provide asset collateral, and investment‐grade companies are far from the default boundary. Thus, these firms can better withstand adverse developments. Companies with higher cash and inventory levels have more cushions. Firms that are central in production networks have a better ability to hedge across multiple supply chains, reducing their sensitivity to supply chain changes. Firms with flexible capital can shift to other projects.
We run an extensive set of robustness tests and conduct alternative specifications, all supporting our findings. First, we look at the US firms with global supply chains in regions outside of China. Furthermore, we specifically consider supply chain links to Europe. Our results continue to show a major impact of US–China supply chain relationships on supply chain credit risk even when taking into account these other supply chain links. While having supply chain links to Europe relatively mitigates credit risk in
We carry out a set of alternative specifications. We consider US firms with Chinese supply chain links and those without these links as separate samples, and run our estimations for these two samples separately. Our results show the adverse impact of supply chain disruptions on US firms with Chinese supply chain links in this specification as well. For the overall sample, We estimate abnormal CDS spreads, controlling for interest rates, market volatility, term spread, liquidity, aggregate default premium, and intermediary capital ratio. In addition, we use two alternative start and end dates for different phases of the pandemic. In one specification, we consider Post1 starting with the Wuhan lockdown on January 23, 2020, and Post2 starting with the Lombardy lockdown on February 23, 2020. In another specification, we consider the start of Post1 as January 1, 2020, since that date roughly corresponds with news reports indicating a closely monitored unidentified pneumonia in Wuhan, Hubei Province, China, from multiple sources.7 We next run our estimations on subperiods separately. For the first subsample period, which includes
Our paper contributes to the literature on global supply chains (Berry & Kaul, 2015; Charoenwong et al., 2022; Cohen & Lee, 2020; Cohen et al., 2018; Hertzel et al., 2018; Jain & Wu, 2023; Jain et al., 2014; Kazaz et al., 2005), especially from the angle of disaster management (Gupta et al., 2016). While existing research considers local natural disasters such as earthquakes, tsunamis, and hurricanes (Carvalho et al., 2021; Hendricks et al., 2020; Kleindorfer & Saad, 2005; MacKenzie et al., 2012) in examining the impact on supply chains, here we focus on COVID‐19 as another natural disaster. The specificity of COVID‐19 lies in its origin as a localized natural disaster that spreads worldwide. In this way, the breadth and depth of its impact far exceeds that of other localized disasters. Our focus on earlier periods of COVID‐19 allows us to investigate this profound shock disseminated from China to other regions, however, before coordinated responses across different regions.
Second, our paper contributes to the literature on spillovers in supply chains. COVID‐19 disruptions in one country impact companies in other countries via supply chains. Conversely, recovery in one region has a positive impact on supply chain partners' risk in other regions. Thus, our findings contribute to the literature on the propagation of risk through supply chains (Acemoglu et al., 2012; Agca et al., 2021; Barrot & Sauvagnat, 2016; Costello, 2020; Das et al., 2007; Duffie et al., 2009; Hendricks et al., 2020; Hertzel & Officer, 2012; Jorion & Zhang, 2007; Kouvelis et al., 2011). While the majority of studies focus on the impact of shocks on local supply chains, our study specifically looks at the impact of local shocks on global supply chains and how this affects credit risk. While our setting is COVID‐19, the results have implications for any shock that transmits from local markets to global markets. The advantage of the COVID‐19 setting is that the pandemic first started in China and then moved to the rest of the world, creating a natural experiment setting to examine local supply chain shocks without confounding effects.
Last, our paper is related to the recent and fast‐growing literature on COVID‐19 and the economy. While these recent studies focus on the shareholder value in the stock market (Alfaro et al., 2020; Baker, Bloom, Davis, Kost, et al., 2020; BakerBloom, Davis, & Terry, 2020; Ding et al., 2022), we look at the impact on the credit market, as reflected in CDS spreads. Thus, our study complements studies that focus on the stock market by considering the default risk of firms arising from global supply chain linkages during the COVID‐19 pandemic. In addition, while recent work emphasizes the importance of the household demand channel during the COVID‐19 pandemic (BakerBloom, Davis, & Terry, 2020; Chetty et al., 2020; Cox et al., 2020; Coibion et al., 2020; Guerrieri et al., 2020), our study considers this issue within the context of supply chains.
The rest of the paper is as follows. Section 2 provides the research background, including the description of CDS and the COVID‐19 timeline. Section 3 is on data and empirical models. Section 4 presents corporate credit risk measured by abnormal CDS spreads in the context of COVID‐19. Section 5 provides the empirical setup and results. Section 6 is on a battery of robustness tests, alternative specifications, and a placebo test. Section 7 concludes.
RESEARCH BACKGROUND
In this section, we provide the background for the CDS market and the COVID‐19 timeline, which is used for a natural experiment setup in our analyses.
Credit default swaps
The CDS market is one of the largest financial derivatives markets, with an outstanding notional of $8 trillion as of June 2018 (Boyarchenko et al., 2020). A CDS is a derivatives contract that protects the buyer of the contract against the default of a particular entity (reference entity). The buyer of the CDS makes periodic payments to the CDS seller on a notional principal until the maturity of the CDS or until the default of the reference entity, whichever is earlier. In the event that the reference entity defaults, the seller pays the buyer the difference between the underlying notional and the recovery value of defaulted assets, which is referred to as
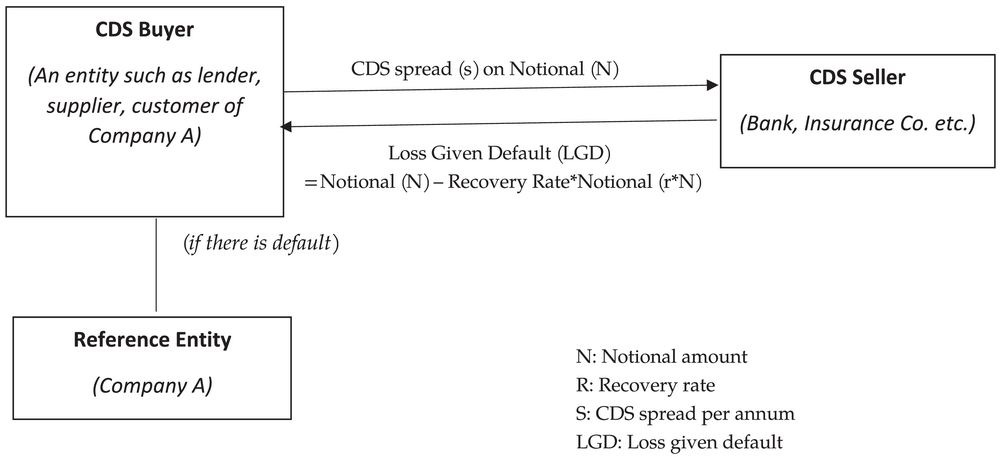
CDS contract structure.
CDS contracts are used not only by lenders and institutional investors but also by suppliers and customers with financial exposure to a given company for risk management purposes (Intercontinental Exchange Report, 2010).8 As discussed in this report, suppliers and customers with financial exposures to a given company may use CDS for risk management purposes. When that company defaults, its supply chain partners are exposed to disruptions in financial flows and need to wait for bankruptcy procedures to resolve in order to receive an uncertain recovery amount. Buying CDS contracts protects these supply chain partners against default as they recover cash payments faster and in a predictable manner in case of default.
As discussed in Blanco et al. (2005) and Stulz (2010), the CDS market is efficient in assessing a company's credit risk as it is a liquid market, and CDS pricing is determined mainly by expected default loss rather than contractual characteristics such as bond covenants. Lee et al. (2018) further show that CDS markets are more efficient than bond and stock markets in incorporating firm‐specific credit information, such information flows from CDS to stock and bond prices, and CDS spreads predict stock and bond prices. Lee et al. (2018) also find that CDS spreads anticipate rating changes around 90 days before the announcement of the rating changes. Thus, CDS spreads are useful in providing timely and accurate information for identifying and assessing credit risk conditions.
The CDS contract pricing for a given maturity primarily builds on (i) the probability of default and (ii) the loss given default.9 CDS spreads are determined such that the risk‐neutral expected present value of CDS spread payments is equal to the risk‐neutral expected present value of LGD (loss given default), that is, 


COVID‐19 timeline
The first reports related to COVID‐19 started on December 31, 2019, concerning a new pneumonia outbreak in China's Hubei province. During January and February 2020, China continued to report COVID‐19 cases. On January 30, China announced an extension of the Lunar New Year holiday and business closure until February 10. Although some businesses in China were reported to open on February 10, most businesses did not resume production until the end of February when COVID‐19 was under control in China. On February 29, China reported a 91.6% work resumption rate, implying the economy reopened. On the US side, the US government declared a travel ban to China on January 31, effective as of February 2. On March 2, Washington declared a state of emergency due to COVID‐19 in the United States, followed by seven more states (California, New York, New Jersey, Maryland, Oregon, Utah, and Kentucky) within a week. On March 11, the United States announced a travel ban to Europe, and the World Health Organization declared COVID‐19 a pandemic. A timeline of major events is shown in the Supporting Information Figure OA2.
Our analysis time frame is based on these developments of economic disruptions due to COVID‐19. We consider the first period as
DATA AND VARIABLES
Our data are primarily collected from four sources: Markit, FactSet Revere, Compustat, and consumer spending data. Markit daily CDS data from December 1, 2019, to April 6, 2020, are used to define the abnormal CDS spreads as a measure of credit risk for US firms. We construct a panel of US public‐listed firms by merging the CDS data with the FactSet Revere global supply chain data as of December 2019. We augment this panel with data on consumer spending and corporate attributes, including their financial condition, supply chain metrics, and industry characteristics. We exclude firms in the financial and utility sectors.
Data on CDS, supply chain, household spending, and firm attributes
We use the Markit data set for our daily close CDS quotes for the US public firms from December 1, 2019, to April 6, 2020. Specifically, we use 5‐year spreads as they constitute the majority of the CDS market and are the most liquid (Agca et al., 2021; Jorion & Zhang, 2007). Table 1 shows sample statistics. The average daily CDS spread is 211 bps, with significant variation in Post1 and Post2 (179 and 303 bps, respectively). As observed, during Post2, which is the economic shutdown period in the United States, the average US firm credit risk is substantially higher, as reflected in average CDS spreads.
Sample statistics.
The supply chain information is extracted from FactSet Revere as in several recently published papers (Agca et al., 2021; Osadchiy et al., 2021; Wang et al., 2021). The data are obtained through December 2019, the last month before the emergence of the pandemic and right before our sample period starting in January 2020. FactSet Revere uses public data sources, including annual and quarterly filings (SEC forms 10‐K, 8‐K, and 10‐Q), investor presentations, company websites, and press releases. After merging with the Markit CDS data, we get a sample of 545 US firms with global supply chains. We use supply chains as of December 2019. The average supply chain duration in our sample is 27 months, that is, around 2 years.
To examine the impact of household demand together with supply chain dynamics, we utilize consumer spending data from Chetty et al. (2020), which is constructed from Affinity Solutions Inc. that aggregates consumer credit and debit card spending information. Chetty et al. (2020) construct daily consumer spending data by dividing each value by the mean of seasonally adjusted 7‐day moving average values from January 8 to 28, 2020. This data set starts on January 13, 2020, whereas our sample period begins on December 1, 2019. For December 1, 2019, to January 12, 2020, we use household spending calculated as the mean consumer spending over January 13 to 31, 2020.
In our analyses, we consider firm, sector, and supply chain–related variables. We mainly use Compustat (2019 fiscal year) to construct the firm‐level variables. We calculate
Variable definitions and descriptive statistics
Following Agca et al. (2021), we construct abnormal CDS spread as the dependent variable for our analyses, which represents the CDS spread after adjusting for the implied ratings and industry. Let 


The variables of interest are China's supply chain relations with US firms and event period indicators. We use two definitions for US–China supply chain links: the natural logarithm of the number of links to suppliers or customers in China (
We use indicators for different pandemic phases. From late January to late February (January 31 to February 29, 2020), China experienced a pandemic shock when the rest of the world had not suffered from a surge of confirmed cases, which is
In our estimations, we control for an extensive set of firm and supply chain attributes that may affect the CDS response to the pandemic shock in supply chains. We also consider firm, sector, and supply chain characteristics specifically to understand how they impact the propagation of credit risk through supply chains. Definitions of variables are in Appendix Table A1.
Table 1, Panels A–E, present descriptive statistics. In Panel A, we provide descriptive statistics for the overall sample. In Panels B and C, we provide summary statistics for the matched samples for suppliers and customers respectively. In Panels D and E, we present the mean and median of variables for the US firms with Chinese suppliers and customers, respectively, and for the US firms without such links in the overall sample and the matched sample. Panels D and E allow comparison between China‐linked and not linked US firms.13
As observed in Table 1, average CDS spreads are smaller in the pre‐event period, slightly higher during Post1, and considerably higher during Post2. As in Post1, only China was affected by the pandemic and the global economy was functioning normally, average spreads were lower. During Post2, when China recovered and the pandemic spread globally, however, average spreads are considerably higher, reflecting the increased credit risk for an average firm due to the pandemic. Our variable of interest is abnormal CDS spreads. We observe that average abnormal CDS spreads are around zero, as expected for both the overall and the matched samples. As abnormal CDS spreads subtract the industry and credit rating adjusted spreads from the firm's CDS spreads, an average macroeconomic shock is captured in this benchmark, which is deducted from individual firm CDS spreads.
We further provide summary statistics for an extensive set of firm, supply chain, and industry characteristics in Table 1. Examining these statistics in Panels A, B, and C highlights that our sample consists of firms with varying degrees of attributes. In addition, Panels D and E provide the mean and median of these attributes for the US firms with and without supply chain links to China.
SUPPLY CHAIN CREDIT RISK IN THE CONTEXT OF COVID‐19
All analyses in our paper use abnormal CDS spreads, which are CDS spreads adjusted by the industry and the credit ratings.14 In Figure 2, we provide abnormal CDS spreads for both the full sample (Figure 2a) and the sample where Chinese supply chain–linked US firms are matched with nonlinked US firms based on size, industry, and number of segments (Figure 2b). Examining the period before the news about an outbreak in China (December 31, 2019), abnormal CDS spreads are around zero for over a month for both Chinese supply chain–linked and nonlinked firms, that is, average abnormal CDS spreads are not significantly different between these two groups throughout the pre‐event period (Appendix Table A2), establishing a parallel trend between the two groups.
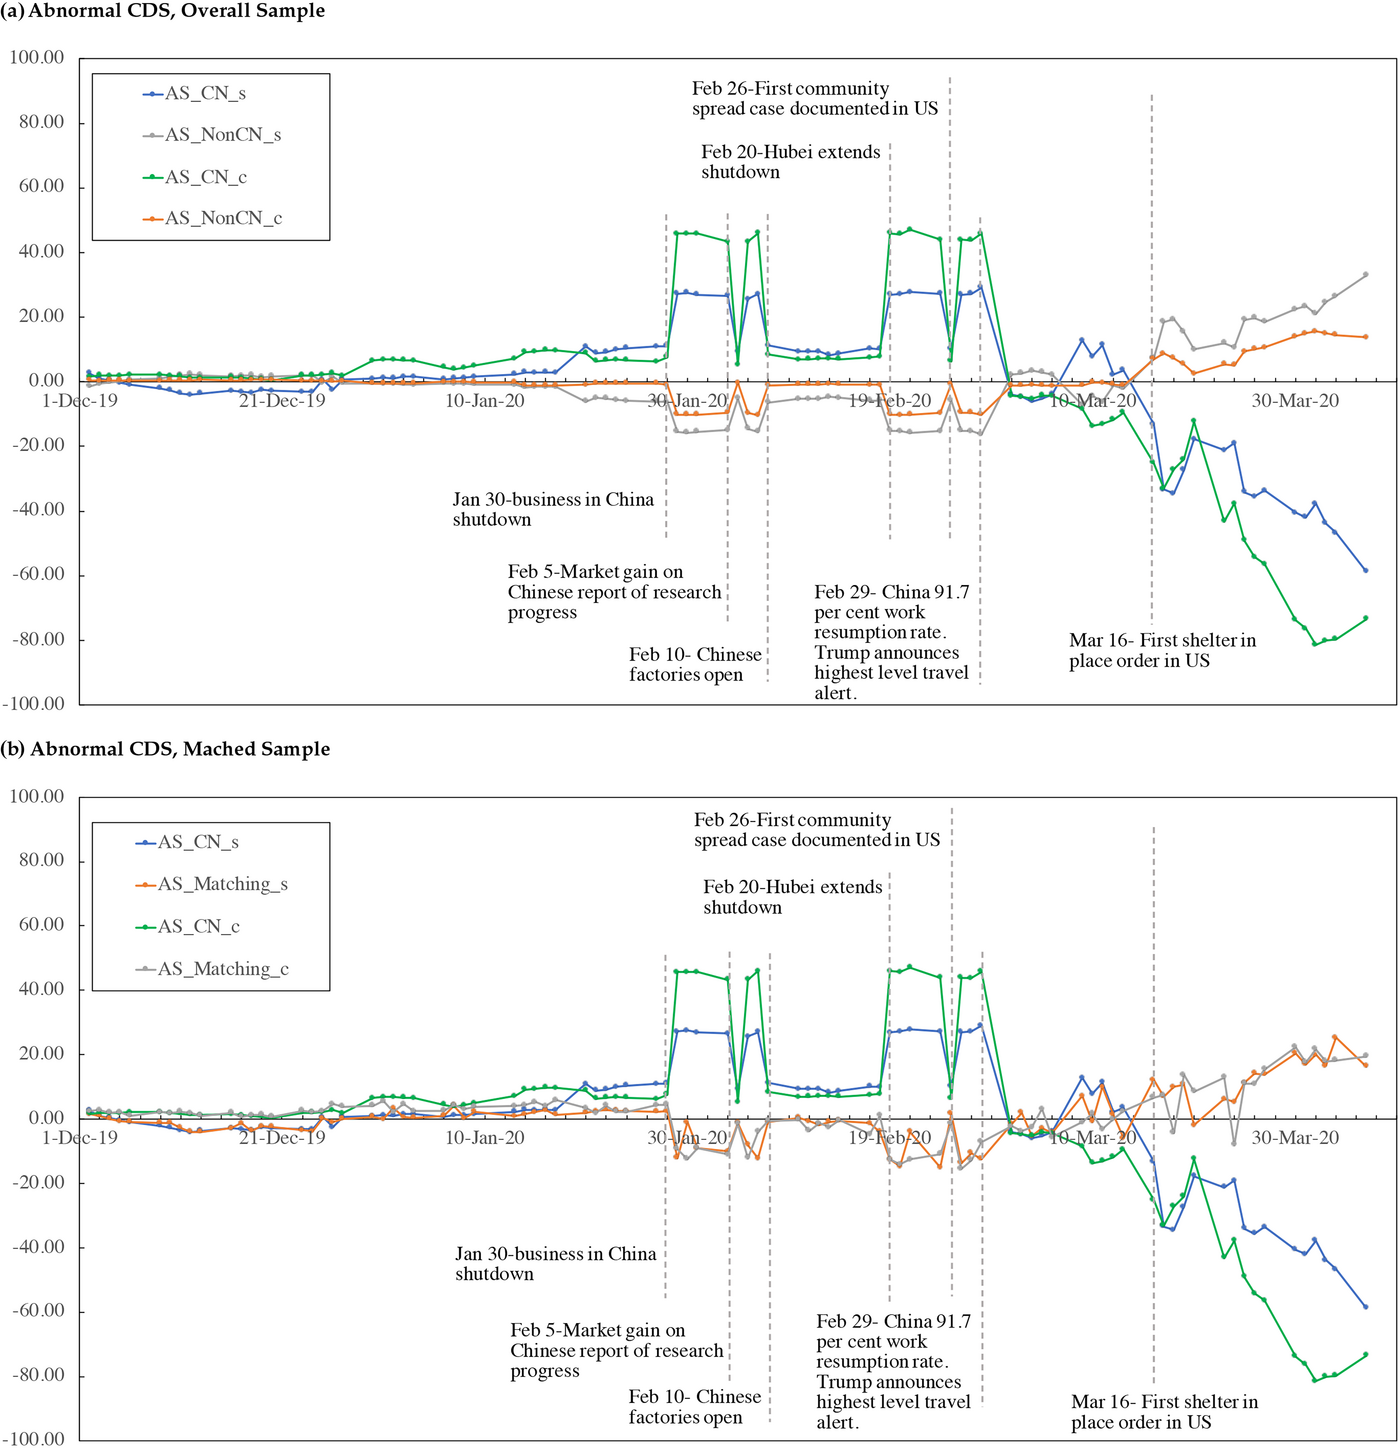
Abnormal credit default swaps (CDS) spreads in the context of COVID‐19.
The figure points out the main differences between
In addition, we report the statistics for the mean difference tests for abnormal CDS spreads in Appendix Table A2. As observed in Figure 2b, as well as Appendix Table A2, abnormal CDS spreads are comparable for the US firms with and without Chinese supply chain links before January 1, 2020, showing parallel trends in the pre‐event period. Following the local shock in China, credit risk responses as reflected in the abnormal CDS spreads are opposite for the China‐linked and non–China‐linked groups in the following periods.
To elaborate further on the abnormal CDS spreads evolution through the sample period, in our setting, abnormal CDS spreads, 


After documenting the effects of supply chain relationships in this basic analysis, we next run panel estimations that allow us to explore COVID‐19–driven supply chain credit risk in more detail.
EMPIRICAL MODELS AND RESULTS
Empirical model
Our baseline model is as follows: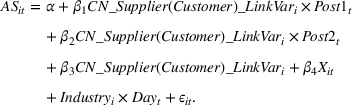
In the above equations, 


We run estimations with the above model for the full sample as well as for the matched sample where US firms with Chinese supply chain links are matched to US firms without such links based on
In our estimations, we include an extensive set of firm and supply chain variables as controls in one specification and firm fixed effects in the other. These controls capture any potential impact of firm‐specific variables on the abnormal CDS spreads. Both specifications control for industry‐day effects. Thus, any time‐varying industry attribute is taken into account. Additionally, any time‐varying macrolevel effect is controlled by industry‐year fixed effects.
Overall, this setting allows us to examine the impact of COVID‐19–driven supply chain shocks in China on US firms. We provide baseline estimations with both full and matched samples, and the extensions are provided using the matched sample.16 Based on the matched sample, we also conduct an alternative specification by using subsamples of the China‐linked firms and non–China‐linked firms separately for robustness.
In the extensions to the baseline analysis, we examine sector‐related effects by looking at a 6‐category industry classification based on the Fama–French 12‐industry groups17 including consumer goods, computers and electronics, manufacturing, oil, gas & chemicals, wholesale, retail & some services, healthcare, and medical equipment & drugs. We consider the interaction of industry indicators with different pandemic phases to examine these effects. We also consider the interaction of household demand with pandemic phases by utilizing consumer spending data. Finally, to investigate which firm, supply chain, or sector attributes intensify or moderate the supply chain–driven credit risk in the pandemic, we interact an extensive set of attributes with pandemic phases and explore supply chain resilience within our framework. We also conduct a placebo analysis, randomly assigning firms as Chinese supply chain–linked and not linked, and run a series of robustness tests and alternative specifications.
Supply chain relations, COVID‐19, and CDS spreads
We examine the relationship between abnormal CDS spreads and supply chain linkages to China during different phases of COVID‐19. We perform these estimations as in Equation (1). Table 2 provides the results for both full and matched samples. In columns (1)–(4), we include an extensive set of firm and supply chain controls as well as industry‐day effects to take into account daily variation in the sectors the firms operate. In columns (5)–(8), we saturate the model with firm fixed effects in addition to industry‐year fixed effects, thus firm and supply chain variables that are time‐invariant or that move slower than the sample period are captured by firm fixed effects. As observed in the table, when COVID‐19 spreads in China and businesses shut down, creating disruptions in production in
Panel estimations for the credit risk through Chinese supply chains.
***
Column (3) of Table 2, Panel B, provides the results for the matched sample for supplier links with industry times day fixed effects, and thus allows us to examine within industry and time effects. In this specification, holding other variables constant, before the pandemic, abnormal CDS spreads are 4.7 bps (not significant) lower for US firms with Chinese supplier links than US firms without such links. During
When we focus on the fixed effects specifications in columns (7) and (8), the change for a given firm over time where all variables that are time‐invariant or that vary slower than our sample period is saturated by firm fixed effects. As supply chain links to China are time‐invariant variables, these are captured by fixed effects and thus there is no additional coefficient for these variables in this model. In this specification, we observe that during Post1, that is, the period of supply chain disruptions in China, abnormal CDS spreads increase by 25.4 bps for US firms with Chinese suppliers, and when the economy reopens in China, and supply chain activity resumes in Post2, abnormal CDS spreads go down by 52.6 bps for these firms. Examining the results in column (8) of Table 2, Panel B, reveals that these values are a 30.3 bps increase in Post1 and a 28.3 bps decrease in Post2 for US firms with Chinese customers.
These are considerable economic effects, considering that the average abnormal CDS spread is zero (Table 1, Panel A). Even in comparison to the raw CDS spreads, the economic significance is large. In our sample, average raw CDS spreads are around 172 bps (193 bps) and 275 bps (304 bps) in
As our specification controls for an extensive set of firm‐ and supply chain–level factors, we examine the correlation structure of these variables to understand which attributes may be strongly associated with each other. The correlations, as reported in Supporting Information Table OA3, are not strong across the variables considered in our study. Nevertheless, we also run our estimations by including one attribute at a time as a control, and the results are comparable to those reported (shown in Supporting Information Table OA7). Thus, our results are robust to include an extensive set of attributes as controls and are not driven by potential multicollinearity.
Overall, the evidence points out that firms' global supply chain linkages are an important contributor to credit risk during the COVID‐19 pandemic. Supply chain disruptions and resumptions in the local economy impact global supply chain partners' default risk as measured in the abnormal CDS spreads. During the pandemic, vulnerabilities for the US firms working with Chinese supply chain partners increase the credit risk of these firms when the Chinese economy shuts down. Resuming production in China when the economy opens up, on the other hand, considerably reduces the default risk of US firms with Chinese supply chain partners, relatively. Thus, global supply chain linkages are important contributors to corporate credit risk, and credit markets adjust quickly to global supply chain dynamics.
Industry results and household channel
Establishing that supply chain vulnerabilities and resolution of these vulnerabilities have significant effects on firm credit risk as observed in abnormal CDS spreads, we next explore which industries are most influenced by these dynamics. We consider the Fama–French 12 industries and group them into six sectors. We interact each sector with a firm's number of supplier (and customer) links to China (measured in natural logarithm). We further consider the impact of the household demand channel on supply chain credit risk specifically. In this regard, we use daily consumer spending data from Chetty et al. (2020) and interact this variable with supply chain links to China and with different phases of the pandemic. Our estimations control for firm and supply chain variables as well as industry‐day effects. The results are in Panels A and B of Table 3 for the log number of US firm linkages with Chinese suppliers and customers, respectively. We also show the US firm linkages indicator results in Supporting Information Table OA6.
Credit risk propagation through supply chains: Industries and household channel.


***
The results on suppliers in China are in Panel A of Table 3. The findings indicate an overall increase in abnormal CDS spreads for US firms with Chinese suppliers for all the sectors during
When we examine different sectors for US companies with Chinese customers in Panel B of Table 3, we observe that abnormal CDS spreads go up in
We further examine interactions with household spending directly in column (6) of Table 3. In this setting, 
Overall, the results on different industries and on household spending suggest differential impacts of global supply chain disruptions and resumptions on different sectors, and point out that the sensitivity of a sector to household demand affects supply chain credit risk. While increasing local household demand offsets adverse developments in global supply chain disruptions, resuming global supply chain activity is insufficient to improve credit risk when household demand in the local economy is weak. Thus, it is important to consider supply chain dynamics together with the household demand channel to understand the implications of global supply chain dynamics as well as supply chain resilience.
Firm‐, supply chain‐, and sector‐level factors
We examine firm, sector, and supply chain factors to understand how these attributes affect the relationship between supply chain activity and firm credit risk. The results for the log number of US firm linkages with Chinese suppliers and customers are in Table 4. We also report the US firm linkages indicator results in Supporting Information Table OA8. To examine this issue, we use the triple‐interactive terms, that is, the number of links to Chinese supply chains with firm, supply chain, and sector characteristics, and
Firm, supply chain, and industry‐level attributes affecting supply chain credit risk propagation.
***
Firm‐level factors
We first explore firm characteristics that amplify or mitigate the impact of supply chain disruptions and resumptions in China on abnormal CDS spreads of US firms, in Panel A of Table 4. As the COVID‐19 shock was an unexpected event, in our setting, firm and supply chain variables such as investment grade rating or size do not have any effect on the probability of this shock happening, and thus the disruptions in the supply chains arise solely due to COVID‐19. The firm and supply chain attributes, however, affect supply chain resilience, and hence can amplify or mitigate the impact of COVID‐19 shock–related supply chain disruptions on firm credit risk. More resilient firms will be less affected by these disruptions, thus observing smaller increases in abnormal CDS spreads.
Larger firms generally have more collateral, which mitigates credit risk (Diamond, 1984; Stohs & Mauer, 1996). They have better diversification, which helps in mitigating the adverse effects arising from specific supply chain partner regions (Antras et al., 2017). They may also have greater bargaining power with suppliers and customers, access to alternative sources of raw materials or finished goods, and have more robust logistics and inventory management systems (Ponomarov & Holcomb, 2009).
Companies with high financial and operating leverage may have limited financial flexibility and capital deployability (Altman, 1968; Shleifer & Vishny, 1992), making it difficult to respond to unexpected changes in demand or supply chain disruptions. Highly leveraged firms may also be more vulnerable to pressure from their supply chain partners to accept less favorable terms due to their weaker bargaining power (Stulz & Johnson, 1985). This can lead to increased costs and reduced supply chain efficiency, further weakening a firm's resilience.
Inventory and cash are buffers against disruptions. With higher inventory and cash levels, firms can be better positioned to respond to sudden supply and demand changes caused by disruptions. Inventory and cash can also serve as collateral to provide access to other financing methods. This can be especially important during COVID‐19 when lead times may be extended due to shipping delays or factory shutdowns (Dittmar & Mahrt‐Smith, 2007; Liu et al., 2016; Maddah et al., 2014; Opler et al., 1999; Tomlin & Wang, 2011).
Highly rated firms are further away from the default boundary and, thus, are more likely to have access to financing during supply chain downturns. This can help to secure the necessary funds to maintain inventory levels and trade credit payment (Dichev & Piotroski, 2001).
Multisegment firms can also be more resilient to supply chain disruptions during the pandemic, since they are less dependent on a single line of suppliers or customers. This attribute can help to mitigate the impact of factory closures or transportation delays. Firms engaged in different segments can also identify and respond to potential disruptions more efficiently by collaboration due to more diverse information exchange, and establishment of joint processes between partners in different segments (Lavastre et al., 2012).
In
To conclude, major firm‐level factors that improve supply chain resilience are firm size, investment‐grade rating, inventory, and cash holdings. These firms are less vulnerable due to their ability to move to alternative products or markets, buffer shocks, or distance from the default boundary. On the other hand, financial and operating leverage weakens supply chain resilience. These firms are closer to the default boundary or more confined in adjusting operations due to large fixed cost components and, thus, are more sensitive to supply chain dynamics.
Sector‐ and supply chain–level factors
We next look at sector and supply chain moderators and show the results are in Panel B of Table 4. When we examine industry‐level factors, we observe that firms facing high competition are more vulnerable to disruptions in China, as observed with high product similarity and low industry concentration. Firms producing goods that are more similar to other firms or those operating in more competitive industries could be replaced easily. Thus, China's economic shutdown in
When we examine supply chain factors, we find that for firms with Chinese suppliers, the impact of supply chain disruptions is subdued for more upstream firms. As there are fewer intermediaries for these firms (Defever et al., 2020), the impact of the local shock in China on these firms is less severe. Thus, in
ROBUSTNESS AND ALTERNATIVE SPECIFICATIONS
Robustness
Global supply chains and supply chain links with Europe
We consider other global supply chain relations of US firms to observe whether our findings are robust to these dynamics. We include the natural logarithm of total global supplier links and total global customer links (excluding China) for each US firm as additional controls, shown in columns (1) and (2), Panel A, Table 5. In addition, in columns (3) and (4), we consider specifically the links to European supply chains as COVID‐19 affected Europe following China, in a more contemporaneous manner with the United States. The evidence continues to show a strong effect of Chinese supply chain linkages on abnormal CDS spreads during the pandemic in support of the baseline. The results indicate that COVID‐driven supply chain disruptions in China have a distinct effect on the abnormal CDS spreads of the US firms with these links, indicating that links to European (or global) supply chains do not explain away the adverse effect of supply chain disruptions in China.
Robustness and alternative specifications.
***
Supply chain length
We consider supply chain links that persist for longer periods as the impact of disruptions and resumptions may differ for them. For this specification, we focus on supply chains that have been active for more than 1 year. Columns (5) and (6), Panel A, Table 5, show that the impact through these longer supply chain links is comparable to the baseline for US firms with Chinese suppliers and is more mitigated than the baseline for US firms with Chinese customers.
Alternative headquarters
In this test, we define a firm's nationality as the region with the firm's largest segment sales, instead of using the reported headquarters location. We report these results in columns (7) and (8) of Panel A in Table 5. Our results are comparable to baseline findings.
Trade sanctions
Our analysis focuses on the sample period from December 1, 2019, to April 6, 2020. Because there have been ongoing trade disputes since 2018 between the United States and China with the imposition of tariffs on certain goods and materials, our results may be affected by trade sanctions on supply chain dynamics. To address this issue, we exclude electronics and manufacturing industries, which are the most directly affected by trade sanctions.21 The results are presented in columns (9) and (10) of Panel A in Table 5, and are in line with the baseline findings.
Strong supply chain links
We also consider the supply chain relationships more significant by looking at strong links between US and Chinese firms. More specifically, Factset Revere records the proportion of revenue between supply chains if a supply chain partner requires mandatory or voluntary disclosure. Accordingly, we calculate the transaction volume between each supply chain. We define a company with strong customer links to China if it has a total revenue percentage greater than 10% in China‐related customers, and with strong supplier links to China if it has a total cost of goods sold percentage greater than 10% in China‐related suppliers. We show the results in columns (11) and (12), Panel A, Table 5, which are comparable to those presented for the baseline.
Alternative specifications
Adjusted abnormal CDS spreads
In the baseline analyses, we construct the abnormal CDS spreads following Jorion and Zhang (2007) and Agca et al. (2021). However, there may exist underlying market factors related to credit risks, such as liquidity measurements, the secondary market's volatility, investor sentiments, and intermediary capital ratios. To take into account these factors, we use an alternative definition of 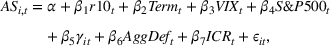


Alternative definitions of pandemic phases
In the baseline, we use January 31, 2020, the China economy shutdown and the US travel ban on China as the start of
Subsample periods
As an alternative specification, we estimate our model on subperiods that contain
Next, we examine the second subsample period that focuses on February 1 to March 31, 2020. As in the baseline, we consider March 1, 2020, as the start of
Subsamples with and without Chinese supply chain links
In our baseline specifications, we implement a DID setting with two periods. We consider the relative difference in the average differences of abnormal CDS spreads of the China‐linked and non–China‐linked firms in the
In addition to our baseline specification, we consider an alternative specification by using subsamples of the China‐linked and non–China‐linked groups separately. We test the effects of COVID‐19 supply chain disruptions arising from economic shutdowns in China in Post1 and the resumption of economic activity in Post2 for these two subsamples. The results are shown in Table A3.
In column (1), for firms with Chinese suppliers, the coefficient of
Thus, disruptions in Chinese supply chains adversely affects the China‐linked sample in
The results reported in columns (3) and (4) for firms with Chinese customers and those without Chinese customers show similar effects as found for suppliers. In
Overall, these findings are in line with our baseline evidence. Firms that are affected from Chinese COVID‐19 supply chain shock, that is, China‐linked firms in the DID setting, observe an increase in abnormal CDS spreads when there are supply chain disruptions in
Placebo test
To explore whether active supply chain relationships explain the COVID‐19 shock propagation in the CDS market or whether the results are a byproduct of latent factors affecting CDS spreads concurrently, we run a placebo test by randomly generating placebo supply chain links in China for the matched sample. The dependent variable is abnormal CDS spreads (bps). Specifically, for a customer (supplier) firm comprising an actual link, we randomly identify a potential supplier (customer) that is present in our sample.
The placebo result in Table 6 shows no significant effect of supply chain linkages on abnormal CDS spreads during the pandemic. This suggests that credit risk is driven by COVID‐19–driven propagation through active supply chain linkages to China and not driven by latent factors affecting CDS spreads.
Placebo test.
***
CONCLUSION
This paper contributes to the literature on supply chain resilience by demonstrating the impact of regional economic disruptions on global supply chains and firm credit risk, particularly the effects of both positive and negative shocks in a given region on firms' interregional suppliers and customers. We use the different COVID‐19 pandemic phases to examine these effects by also considering the role of the household demand channel in amplifying or mitigating the impact.
By exploring the two phases of the pandemic, namely, the period of COVID‐19 spread in China and the period of reopening in the Chinese economy while the rest of the world was affected by the pandemic, we find that interruption and resumption of supply chains considerably affected credit risk during the pandemic. Credit risk, as measured by abnormal CDS spreads, increases relative to other firms with supply chain interruptions caused by economic shutdowns in supply chain partner regions and decreases when these partner region disruptions dissipate, and the effects are economically significant.
Our paper focuses on the early stages of the pandemic when examining US–China supply chain relations. Thus, our results are immune to the implications of coordinated responses of countries on COVID‐19 that is observed in the later periods of the pandemic. Exploring this coordinated response aspect is outside the scope of this paper and faces challenges due to the lack of clean identification. We control for links to other global supply chains to consider the impact of such connections, and continue to find results comparable to the baseline during our sample period.
We also show that household demand had an important role in the impact of interregional connections on supply chain credit risk during the pandemic. In the consumer goods and electronics sectors, resuming economic activity in the partner region was insufficient to improve relative credit risk as local household spending declined due to economic shutdowns. On the other hand, during such periods, having access to a more global customer base mitigated the adverse effects of reduced local consumer demand.
In terms of factors affecting supply chain resilience, we find that financial and operating leverage and product market competition in the supply chain increase supply chain vulnerabilities during the pandemic. Firm size, inventory, cash holdings, capital redeployability, network centrality, high credit ratings, and the number of segments, on the other hand, increase supply chain resilience during the pandemic. Since the COVID‐19 shock was unforeseen in our context, firm and supply chain variables have no bearing on its likelihood. Consequently, disruptions to supply chains are solely attributable to COVID‐19. Nevertheless, firm and supply chain characteristics impact supply chain resilience, and thus either enhance or diminish the impact of COVID‐19–related supply chain disruptions on firm credit risk, measured by abnormal CDS spreads. More resilient firms experience less severe effects of these disruptions. However, in the absence of any exogenous variation in the investment grade variable, the specification might be estimating an equilibrium outcome, that is, better resilient firms receive better grading from agencies. Therefore, additional studies need to be conducted in the future.
Our study has important managerial implications: First, the paper provides evidence from the CDS market that default risk can propagate across regions through the global supply chain network. Investors and managers can use the CDS market to capture this risk dissemination during changing supply chain dynamics. Second, with respect to firm supply chain risk management, the paper shows specific factors mitigating the firm's default risk during the pandemic, including lower financial and operating leverage, higher level of inventory and cash, as well as a more central position in a supply chain network to diversify the risk. For managers, these key factors can be used as a basis for risk assessment ex‐ante the disruptions. Third, managers may also use these observations in considering entering the CDS market to insure against default risks that arise from global supply chain disruptions as the propagation of credit risk is reflected in CDS spreads promptly.
Footnotes
APPENDIX
ACKNOWLEDGMENTS
We would like to thank Ann Harrison, Andrew Feltenstein and conferences at ASSA/ACAES, New Orleans, Louisiana, Eastern Economics Conference Presidential Panel, Fort Lauderdale, Florida, for helpful comments. All errors are our own. This work was supported in part by the National Natural Science Foundation of China (NSFC) Grant No.72201230, and Research Grants Council (RGC) of Hong Kong Grant No. 14504621.
1
According to the Bureau of Economic Analysis (BEA), year‐over‐year (YoY) change in US GDP was 0.3% in the first quarter of 2020 and reduced to −9.5% in the second quarter when COVID‐19 affected the US economy through stay‐at‐home orders and shutdowns. Changes in personal consumption were 0.2% and −10.7% (YoY) in the first quarter and the second quarter of 2020, respectively, pointing out to considerable impact of weak household spending on sluggish economic activity during the pandemic. See also Chetty et al. (![]() ) and Cox et al. (2020) on the US consumer spending patterns during the pandemic.
) and Cox et al. (2020) on the US consumer spending patterns during the pandemic.
2
Data are obtained from the US Census Data on Foreign Trade in 2019. See
3
See, for example, the report by the United Nations “A UN Framework for the Immediate Socio‐Economic Response to COVID‐19.” The report points out the need for coordinated response across different countries, which was published in April 2020, that is, when our sample period ends.
4
The alternative measures for credit risk such as bond spreads and credit ratings do not frequently adjust, because bonds are not as liquid as CDS spreads and credit ratings are known for their stickiness.
5
Note that increases in abnormal CDS spreads mean that the relative CDS spreads of the target group (US firms with supply chain partners in China) increase compared to similar rating and industry firms not in the target group. Since the overall change in abnormal CDS spreads across all firms is mechanically zero by definition, this measure has no relationship to overall raw CDS spread changes, that is, to overall market perceptions of credit risk.
6
We also show that firms with Chinese supply chain links (treatment firms) and those without such links (control firms) show parallel trends in abnormal CDS spreads in the pre‐event period using the sample where these firms are matched on size, industry, and the number of segments (Figure 2), and see also Appendix ![]() , which shows that the difference between the two groups, abnormal CDS spreads, size, and number of segments are comparable in the pre‐event period. Thus, the findings are not driven by different starting conditions for the treatment and control groups.
, which shows that the difference between the two groups, abnormal CDS spreads, size, and number of segments are comparable in the pre‐event period. Thus, the findings are not driven by different starting conditions for the treatment and control groups.
7
The news from Hong Kong government:
8
Global Derivatives Markets Overview: Evolution, Standardization and Clearing, Intercontinental Exchange (ICE), March 2010, available at
9
Loss given default is (1‐recovery rate), that is, the portion that was not recovered due to default.
10
This allows us to examine the COVID‐19 impact on supply chain credit risk for three periods: pre‐event period: December 1, 2019, to January 30, 2020; Post1: January 31 to February 29, 2020; and Post2: March 1 to April 6, 2020, respectively.
11
We use Markit's implied rating as it is updated more frequently than the common agencies' credit ratings. Markit's implied credit rating is derived based on daily single‐name CDS spreads, and the associated sector curve spreads.
12
The extension results based on indicators, including industry results, amplifying and mitigating factors, robustness, and alternative specifications, are shown in the Supporting Information. These findings are statistically similar and comparable to the presented results using the log number of links.
13
We provide additional detailed descriptive statistics for different periods in Supporting Information Table OA1.
14
15
While our estimations are based on abnormal CDS spreads, to present the benchmark, we report the raw CDS with and without Chinese supply chains along with the raw CDS benchmark in Supporting Information Figure OA3.
16
We provide the details of the full sample results in the Supporting Information.
17
The reason to combine the 12‐industry into a 6‐industry classification is to ensure enough firm observations with both CDS and supply chain information for each industry. Supporting Information Table OA2 describes our industry classification and the firm sample sizes.
18
We use the US credit card spending as the proxy for the household spending. The values are the percentage changes in 2020 compared to 2019.
19
Table 4 presents the interactions variables (variables of interest) for the sake of brevity. The details, including control variables, are provided in Supporting Information Table OA7.
20
In using network‐related centrality measure, potential endogeneity is documented to be a concern when these measures are considered at the firm level (Acemoglu & Azar, 2020). To address this issue, we consider macrolevel network centrality measures, that is, we measure them at the industry level instead, based on Ahern and Harford (![]() ).
).
21
For a detailed timeline on US–China trade disputes, refer to
22
23
We do not use this specification as our main model for two reasons. First, we indeed have two major events, China's shutdown and reopening, in the whole period. That said, Post1 and Post2 are each other's controls. Second, the study on subsamples uses different periods, creating challenges for comparison of the estimated effects. Thus, we present findings with the primary model presented but consider this specification mainly for robustness.
24
For more details, please refer to our Supporting Information Section OA3.